Remdesivir for COVID-19: real-time meta-analysis of 81 studies

Meta-analysis81 studies · 200K patientsc19early.org

Remdesivir for COVID-19

Serious outcome risk
Remdesivir
Control
Outcome (studies)
Improvement
Relative risk · 95% CI
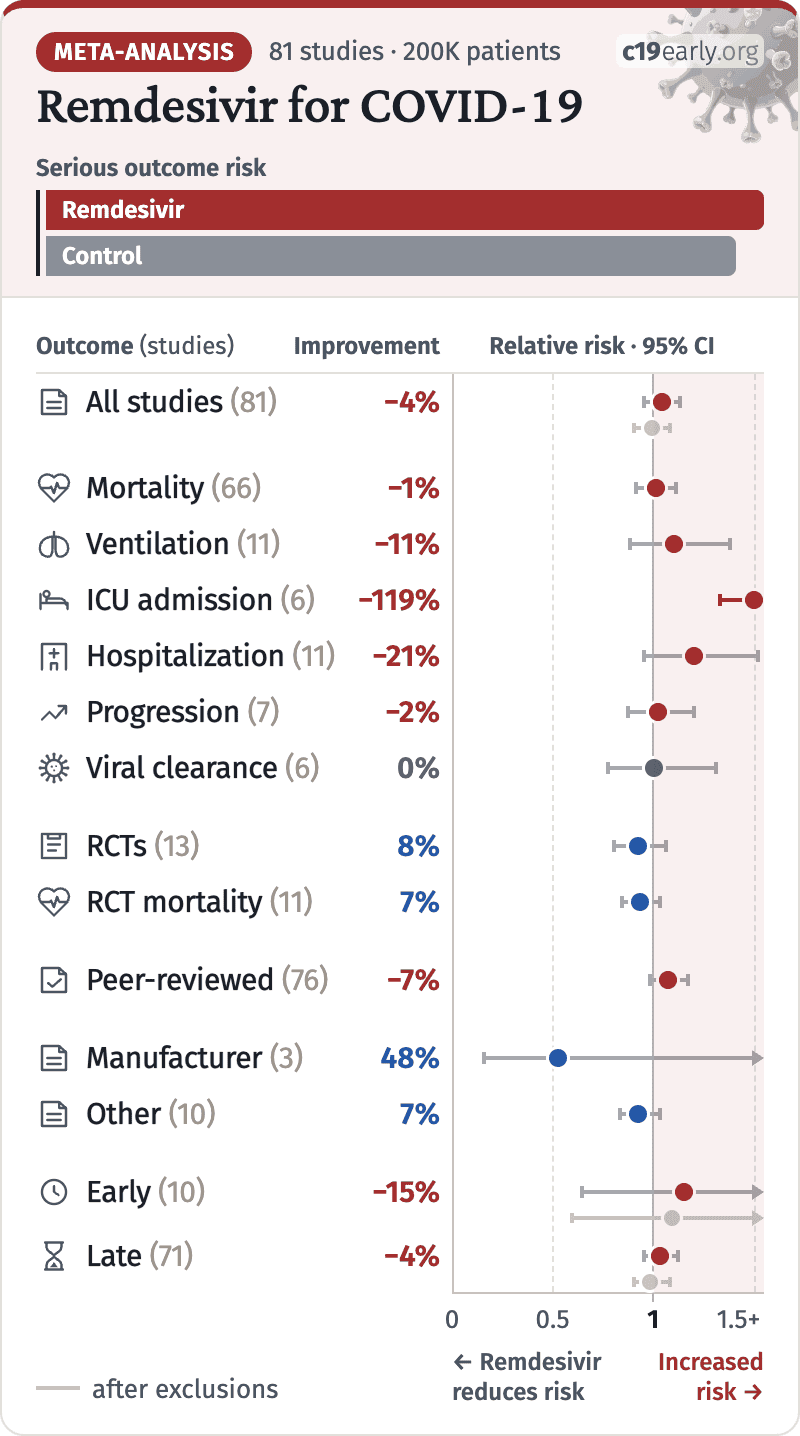
All studies (81)−4%
Mortality (66)−1%
Ventilation (11)−11%
ICU admission (6)−119%
Hospitalization (11)−21%
Progression (7)−2%
RCTs (13)8%
RCT mortality (11)7%
Peer-reviewed (76)−7%
Manufacturer (3)48%
Other (10)7%
Early (10)−15%
Late (71)−4%
after exclusions
00.511.5+
← Remdesivir
reduces risk
Increased
risk →
October 2026

Media coverage of remdesivir for COVID‑19

Media covered only 5% of negative studies

3 positive remdesivir studies were covered

14%

Only 3 negative studies were covered

5%
2.9×
Positive bias
positive studies were 2.9 times more likely to be covered
Abstract
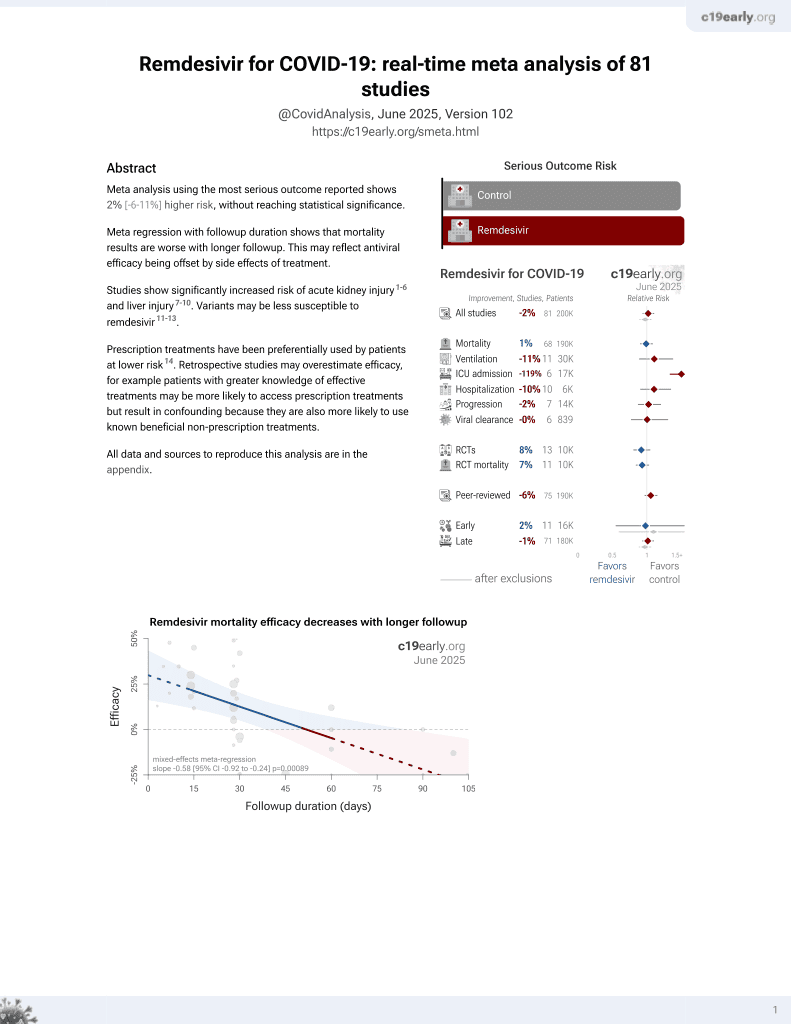
Meta-analysis using the most serious outcome reported shows 4% [-4‑13%] higher risk, without reaching statistical significance.
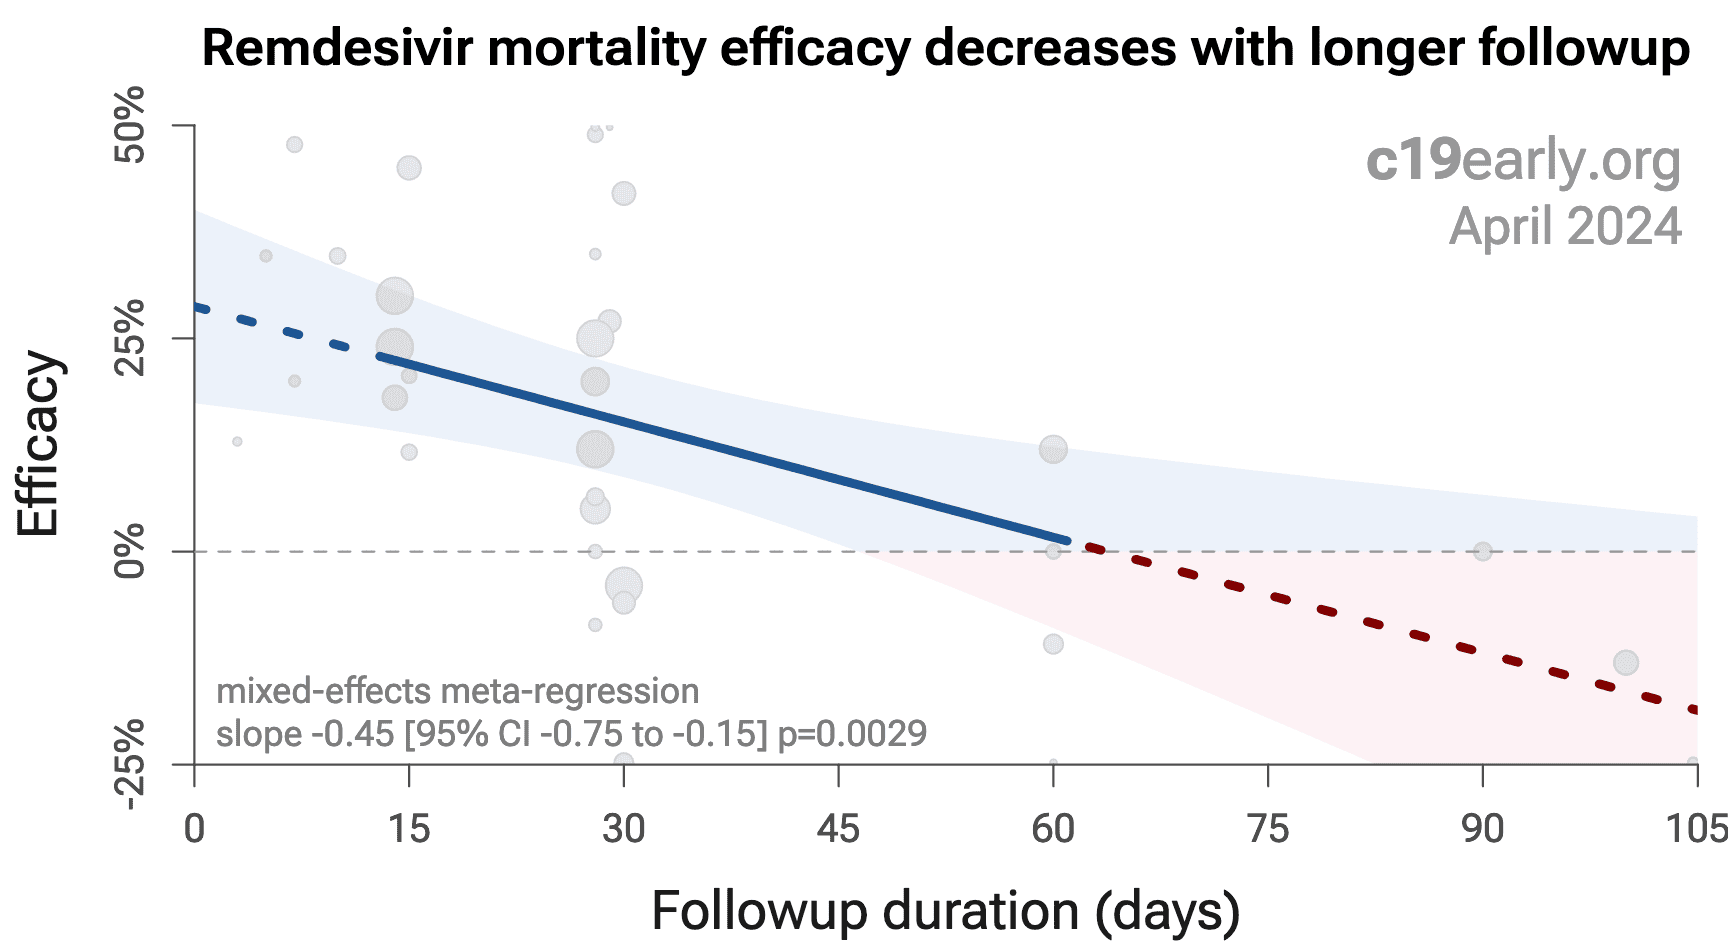
Meta regression with follow-up duration shows that mortality results are worse with longer follow-up. This may reflect antiviral efficacy being offset by side effects of treatment.
Meta-analysis81 studies · 200K patientsc19early.org

Remdesivir for COVID-19

Serious outcome risk
Remdesivir
Control
Outcome (studies)
Improvement
Relative risk · 95% CI
All studies (81)−4%
Mortality (66)−1%
Ventilation (11)−11%
ICU admission (6)−119%
Hospitalization (11)−21%
Progression (7)−2%
RCTs (13)8%
RCT mortality (11)7%
Peer-reviewed (76)−7%
Manufacturer (3)48%
Other (10)7%
Early (10)−15%
Late (71)−4%
after exclusions
00.511.5+
← Remdesivir
reduces risk
Increased
risk →
Remdesivir is a nucleoside analog that affects RNA replication. Off-target effects include mitochondrial1-5 and organ toxicity. Studies show significantly increased risk of acute kidney injury6-11, liver injury12-16, and cardiac disorders1,17-20. Harms may be greater than suggested from short-term follow-up, with significant long-term morbidity. Variants may be less susceptible to remdesivir21-23.
1 RCT with 2,200 patients has not reported results (9 months late)24.
Prescription treatments have been preferentially used by patients at lower risk25. Retrospective studies may overestimate efficacy, for example patients with greater knowledge of effective treatments may be more likely to access prescription treatments but result in confounding because they are also more likely to use known beneficial non-prescription treatments.
All data and sources to reproduce this analysis are in the appendix.
Follow-up duration (days) Mortality efficacy Remdesivir benefit disappears with longer follow-up - side effects may offset antiviral action 0 15 30 45 60 75 90 105 120 -25% 0% 25% 50% c19early.org October 2026 mixed-effects meta-regression slope -0.54 [95% CI -0.9 to -0.18] p=0.0032

Remdesivir for COVID-19

Highlights
  • No significant improvements are seen. Meta regression with follow-up duration shows that mortality results are worse with longer follow-up. This may reflect antiviral efficacy being offset by side effects of treatment.
  • Studies show significantly increased risk of acute kidney injury, liver injury, and cardiac disorders.
  • Real-time updates and corrections with a consistent protocol for 227 treatments. Outcome specific analysis and combined evidence from all studies including treatment delay, a primary confounding factor.
A
October 2026

Remdesivir COVID-19 studies

StudyImprovementRR · 95% CIOutcomeTreatmentControlRelative Risk
Early treatment−15%1.15 · 0.64–2.0410/1,15246/14,60315% higher risk
Tau² = 0.31, I² = 40.6%, p = 0.65
Wang (RCT)−9%1.09 · 0.54–2.18death22/15810/78 Olender59%0.41 · 0.24–0.71death24/312102/818 Spinner (RCT)35%0.65 · 0.18–2.40death5/3844/200 Pasquini (ICU)16%0.84 · 0.69–0.94death14/2524/26ICU patients Fried61%0.39 · 0.15–0.99death4/482,510/11,673 Beigel (RCT)27%0.73 · 0.52–1.03death541 (n)521 (n)ACTT-1 SOLIDARITY .. (RCT)5%0.95 · 0.81–1.11death301/2,743303/2,708SOLIDARITY El-Solh29%0.71 · 0.52–0.97death63/219202/424 Flisiak49%0.51 · 0.19–1.30death5/12217/211SARSTer Garibaldi20%0.80 · 0.46–1.41death23/30345/303 Ullah−100%2.00 · 0.67–5.94death8/304/30 Yeramaneni−24%1.24 · 0.11–14.19death32 (n)7,126 (n) Goldberg9%0.91 · 0.50–1.67hosp. time29 (n)113 (n) Tsuzuki−4%1.04 · 0.98–1.09death69/824285/11,663 Mahajan (RCT)−76%1.76 · 0.46–6.82death5/343/36 Mulhem−86%1.86 · 0.21–5.24death1/8515/3,211 Haji Aghajani19%0.81 · 0.46–1.46death46 (n)945 (n) Elhadi (ICU)−11%1.11 · 0.81–1.51death14/21267/444ICU patients Pourhoseingholi−2%1.02 · 0.72–1.44death42/123297/2,345 Arch (PSM)20%0.80 · 0.64–0.98death203/1,491777/4,676 Barrat-Due (DB RCT)0%1.00 · 0.20–4.60death3/424/57NOR-Solidarity Ohl (PSM)−6%1.06 · 0.83–1.36death143/1,172124/1,172 Kuno (PSM)1%0.99 · 0.84–1.17death214/999216/999 Elavarasi−137%2.37 · 1.98–2.83death146/403207/1,352 Diaz35%0.65 · 0.46–0.92death33/286173/852 Ader (RCT)6%0.94 · 0.59–1.45death34/41437/418DISCOVERY Mozaffari12%0.88 · 0.81–0.96death4,441/28,8555,499/28,855 Sarhan (RCT)−35%1.35 · 0.70–2.60death15/5212/56OT1 Schmidt (PSM)−509%6.09 · 2.71–13.68severe case43 (n)434 (n) Mustafa33%0.67 · 0.38–1.20death16/20029/244 Ali (RCT)12%0.88 · 0.72–1.07death127/634152/647CATCO Kurniyanto−460%5.60 · 2.32–13.50death7/4512/432 Siraj53%0.47 · 0.35–0.62death108/413197/587 Salehi (ICU)37%0.63 · 0.43–0.94death17/4057/85ICU patients Elec19%0.81 · 0.38–1.69death7/3829/127 Malundo−17%1.17 · 0.80–1.70death24/115197/1,100 Bowen−57%1.57 · 1.25–1.97death817 (n)3,814 (n) Raad42%0.58 · 0.39–0.88deathn/an/a Oku−40%1.40 · 0.41–4.36death3/468/172 Behboodikhah38%0.62 · 0.30–1.30death1,214 (n)960 (n) Cacho−80%1.80 · 0.37–8.82death5/572/41 Hartantri11%0.89 · 0.31–2.53deathn/an/a Alshamrani (PSM)17%0.83 · 0.72–0.93death137/246725/1,078 Mitsushima−44%1.44 · 1.09–1.90deathn/an/a Punzalan−42%1.42 · 0.92–2.20death47/22426/176 Kim−1612%17.12 · 1.06–277death14/1450/22 Aweimer−13%1.13 · 0.93–1.37death40/5168/98Intubated patients Arfijanto1%0.99 · 0.64–1.53viral+17/4446/118 Bavaro (PSW)7%0.93 · 0.89–0.97severe case120 (n)211 (n) Shamsi−23%1.23 · 0.56–2.69death8/5316/130 Mozaffari (PSM)25%0.75 · 0.68–0.83death14,169 (n)5,341 (n) Nadeem−12%1.12 · 0.39–3.26death12/964/36 Burhan (ICU)−15%1.15 · 0.96–1.37death33/43345/516ICU patients Hagman0%1.00 · 0.60–1.80death105 (n)213 (n) Ho−62%1.62 · 1.35–1.95death5,294 (n)21,151 (n) Amirizadeh (ICU)−3%1.03 · 0.86–1.24death31/3530/35ICU patients Muntean−45%1.45 · 1.04–2.03death71/28745/264 Chang−185%2.85 · 1.03–7.85death81 (n)81 (n) Alsaraj (RCT)−83%1.83 · 0.66–5.11death9/525/53 Liao−25%1.25 · 0.55–2.86death37/593/6 Sokolski0%1.00 · 0.67–1.47death88 (n)460 (n) Lewandowski−21%1.21 · 0.66–2.22death430 (all patients) Drouin−46%1.46 · 1.15–1.54severe case52/102135/354 Milan−34%1.34 · 0.20–8.91death1/816/172 Sise (DB RCT)−6%1.06 · 0.72–1.55death55/16626/83REDPINE Anzalone (PSM)−33%1.33 · 1.29–1.37deathn/an/a Kawther−9%1.09 · 0.46–2.57death111 (n)340 (n) Angleitner−223%3.23 · 1.46–7.17viral time8 (n)55 (n) Mohammed (PSM)67%0.33 · 0.04–3.15death1/1013/101 Floridia−23%1.23 · 0.78–1.95PASC318 (n)1,216 (n) Heiran−22%1.22 · 0.89–1.66deathn/an/a
Late treatment−4%1.04 · 0.95–1.136,711/65,38413,813/122K4% higher risk
Tau² = 0.07, I² = 90.8%, p = 0.42
All studies−4%1.04 · 0.96–1.136,721/66,53613,859/136K4% higher risk
Tau² = 0.07, I² = 89.7%, p = 0.3600.511.52+
1 OT: comparison with other treatment
Rotate screen for more detailsIncrease width for more details
← Remdesivir
reduces risk
Remdesivir
increases risk →
B
Loading..
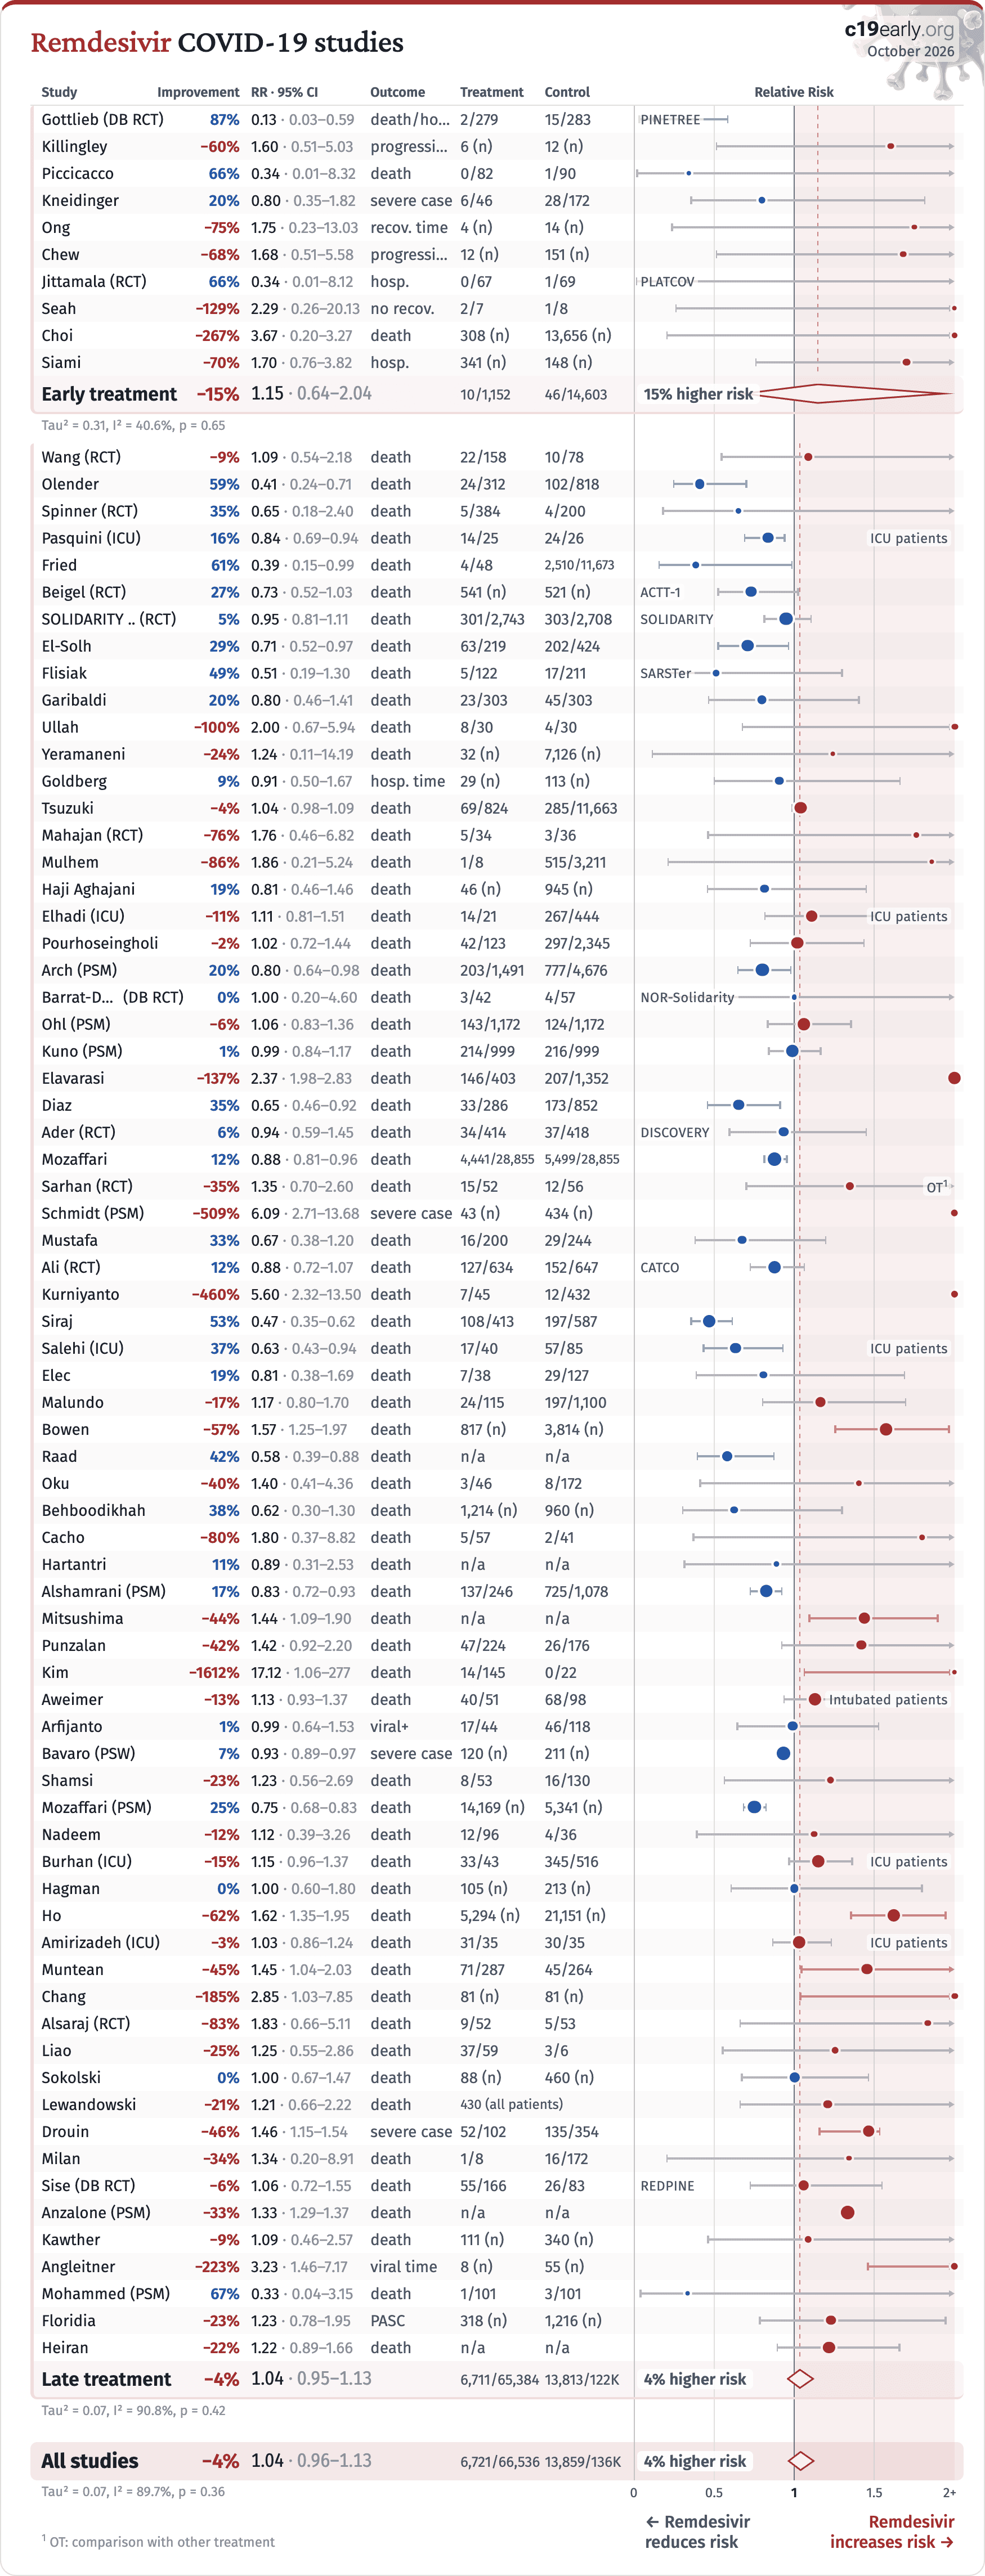
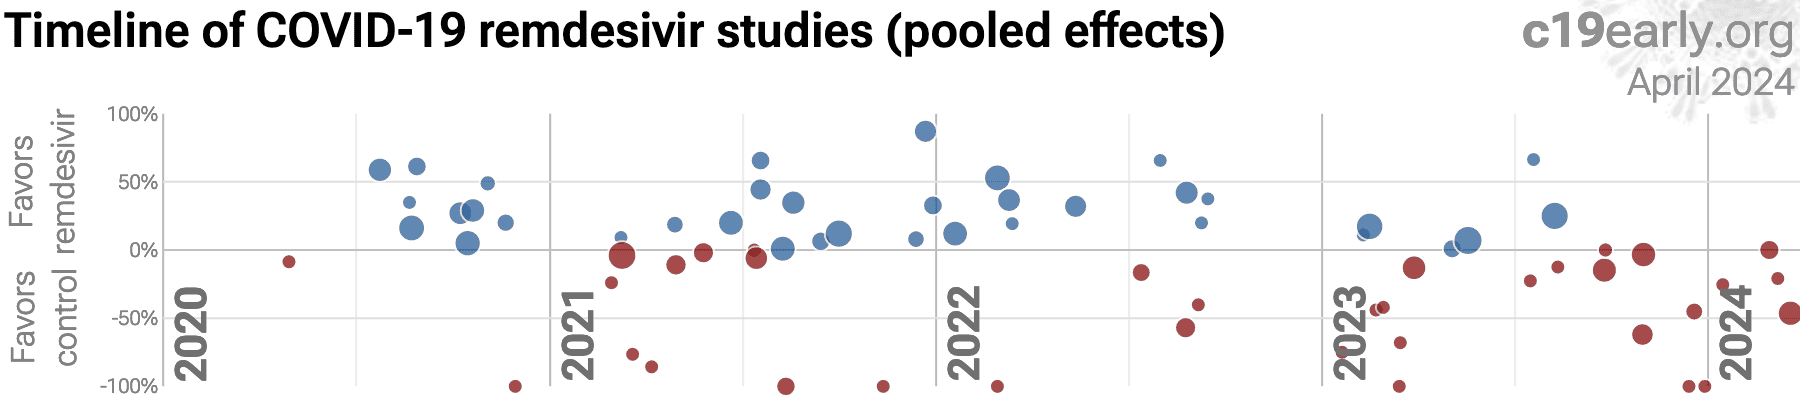
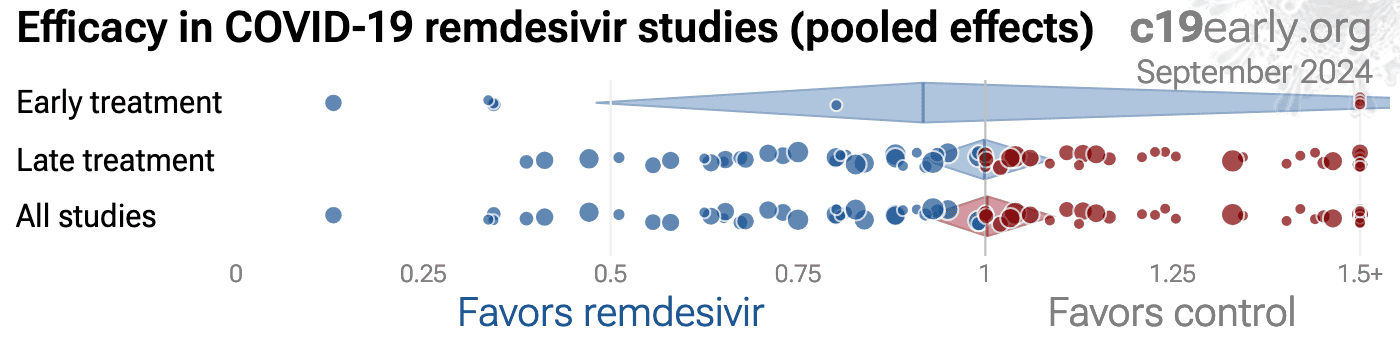
Fig. 1. A. Random-effects meta-analysis. This plot shows pooled effects, see the specific outcome analyses for individual outcomes. Analysis validating pooled outcomes for COVID-19 can be found below. Effect extraction is pre-specified, using the most serious outcome reported. For details see the appendix. B. Timeline of results in remdesivir studies.
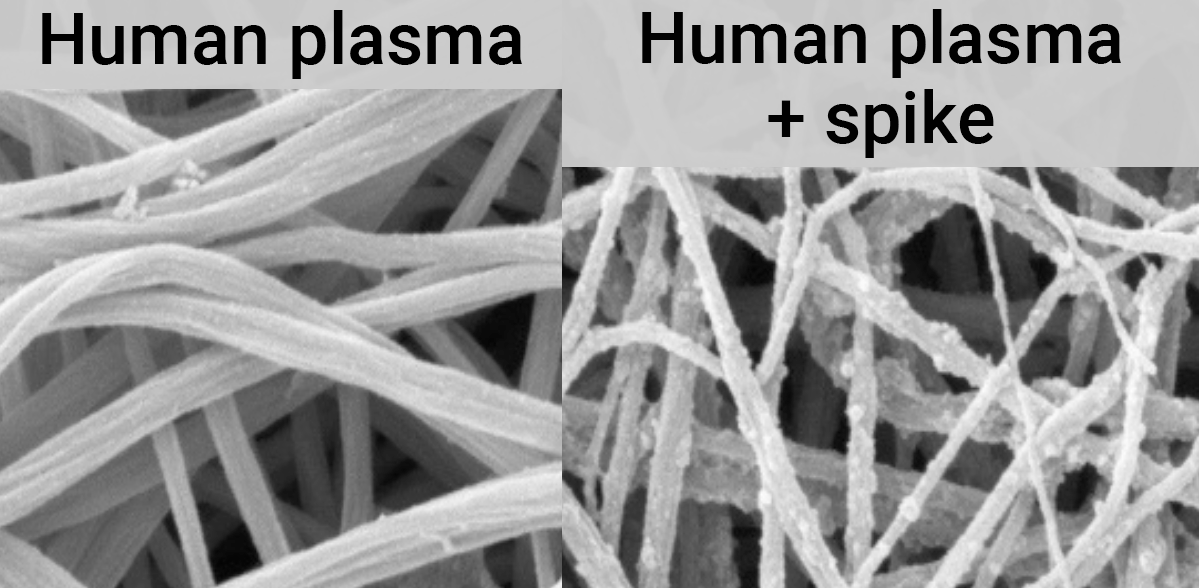
Fig. 2. SARS-CoV-2 spike protein fibrin binding leads to thromboinflammation and neuropathology, from26.
SARS-CoV-2 infection primarily begins in the upper respiratory tract and may progress to the lower respiratory tract, other tissues, and the nervous and cardiovascular systems, which may lead to cytokine storm, pneumonia, ARDS, neurological injury27-43 and cognitive deficits30,35, cardiovascular complications44-50, DNA damage51-54, organ failure, and death. Even mild untreated infections may result in persistent cognitive deficits55—the spike protein binds to fibrin leading to fibrinolysis-resistant blood clots, thromboinflammation, and neuropathology. Minimizing replication as early as possible is recommended.
SARS-CoV-2 infection and replication involves the complex interplay of 500+ host and viral proteins and other factorsA,56-63, providing many therapeutic targets for which many existing compounds have known activity. Scientists have predicted that over 12,000 compounds may reduce COVID-19 risk64, either by directly minimizing infection or replication, by supporting immune system function, or by minimizing secondary complications.
We analyze all significant controlled studies of remdesivir for COVID-19. Search methods, inclusion criteria, effect extraction criteria (more serious outcomes have priority), all individual study data, PRISMA answers, and statistical methods are detailed in Appendix 1. We present random-effects meta-analysis results for all studies, studies within each treatment stage, individual outcomes, peer-reviewed studies, Randomized Controlled Trials (RCTs), and higher quality studies.
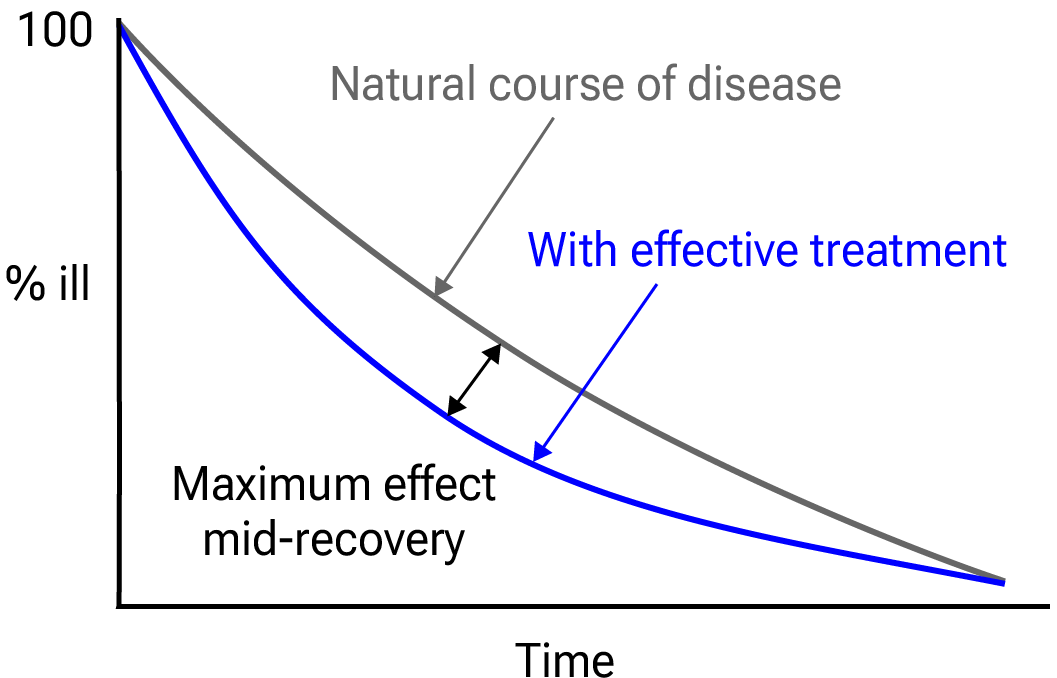
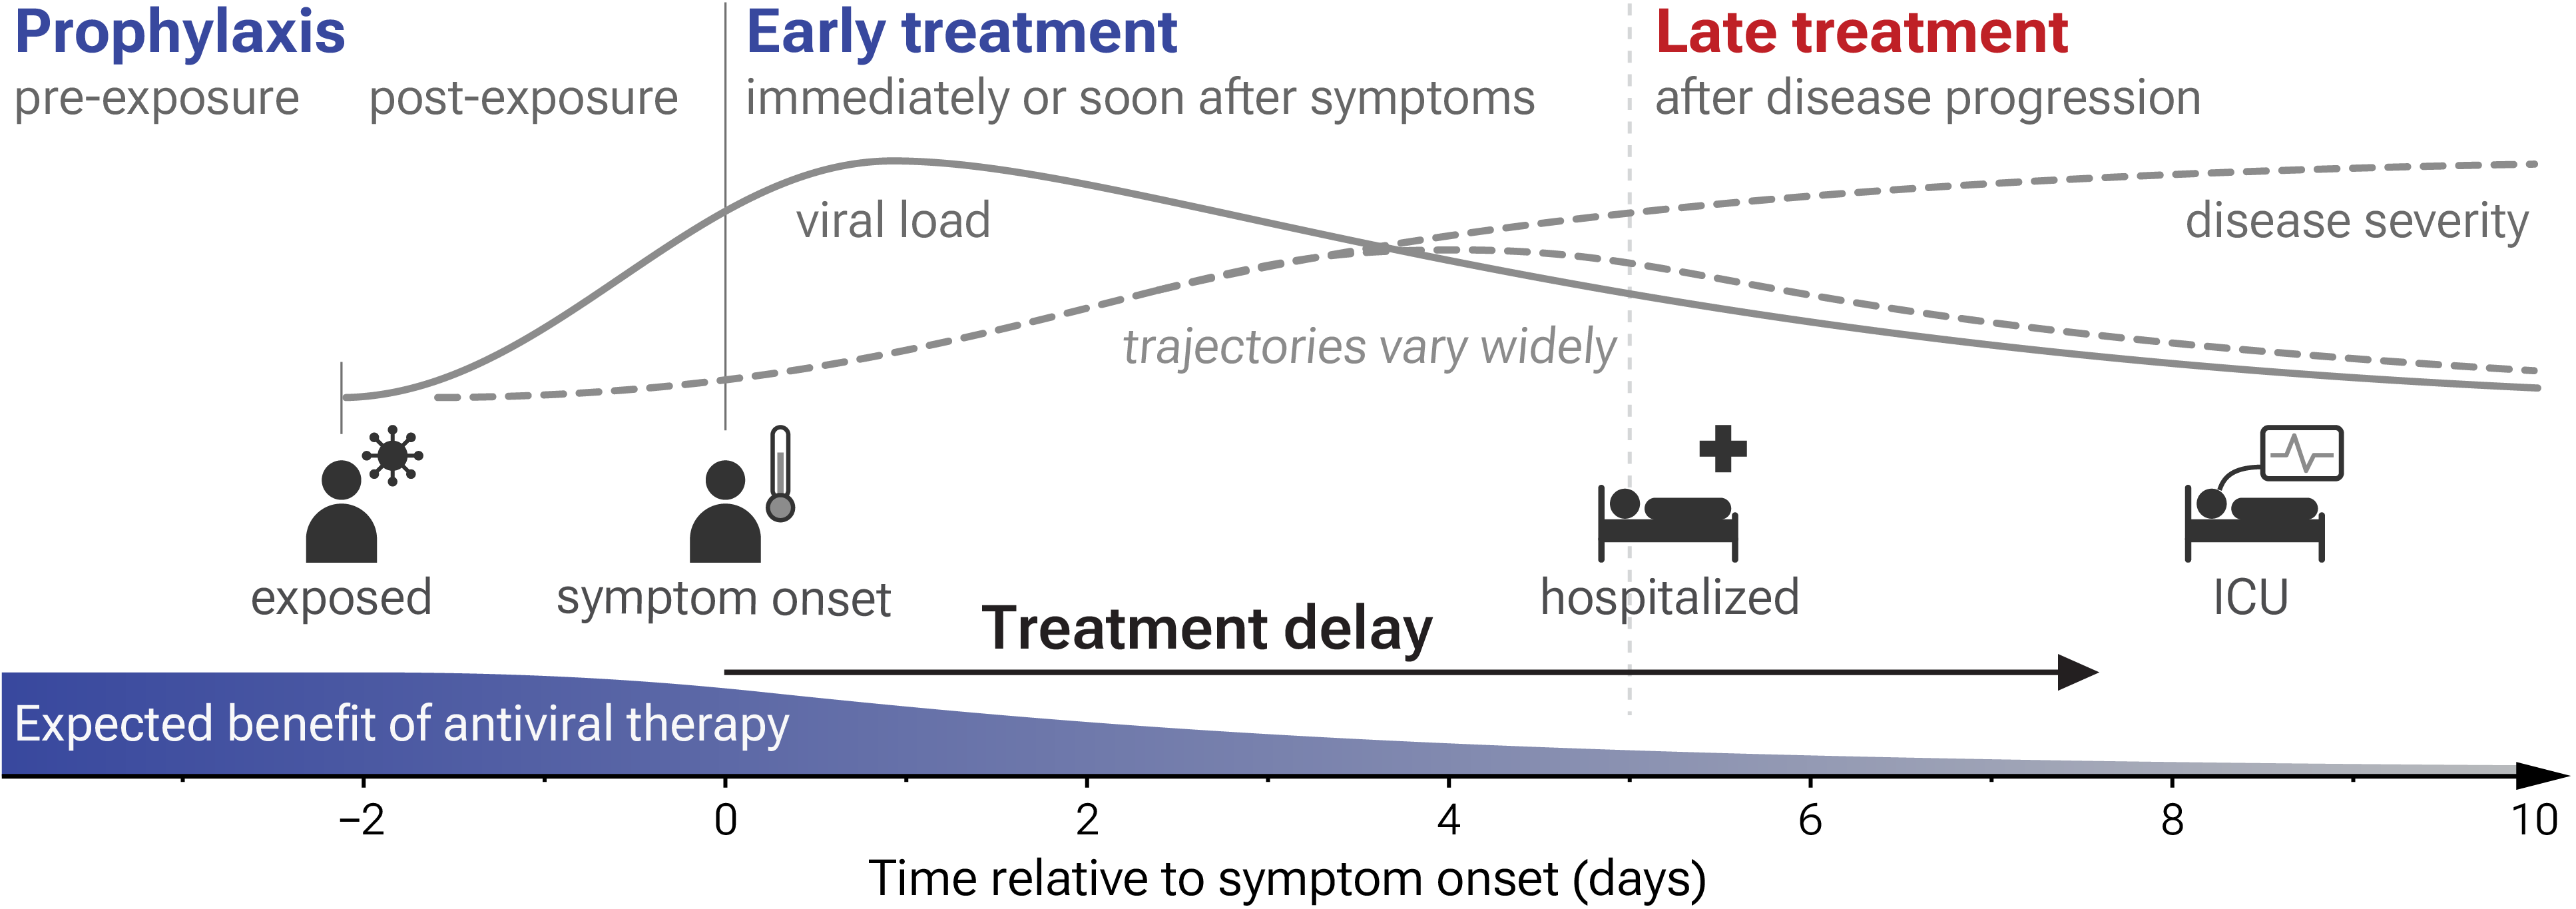
Fig. 3 shows stages of possible treatment for COVID-19. Prophylaxis refers to regularly taking medication before becoming sick, in order to prevent or minimize infection. Early treatment refers to treatment immediately or soon after symptoms appear, while late treatment refers to more delayed treatment.
Prophylaxis pre-exposure post-exposure Early treatment Late treatment Treatment delay viral load disease severity exposed symptom onset hospitalized ICU Expected benefit of antiviral therapy −2 0 2 4 6 8 10 Time relative to symptom onset (days) trajectories vary widely immediately or soon after symptoms after disease progression
Fig. 3. Treatment stages.
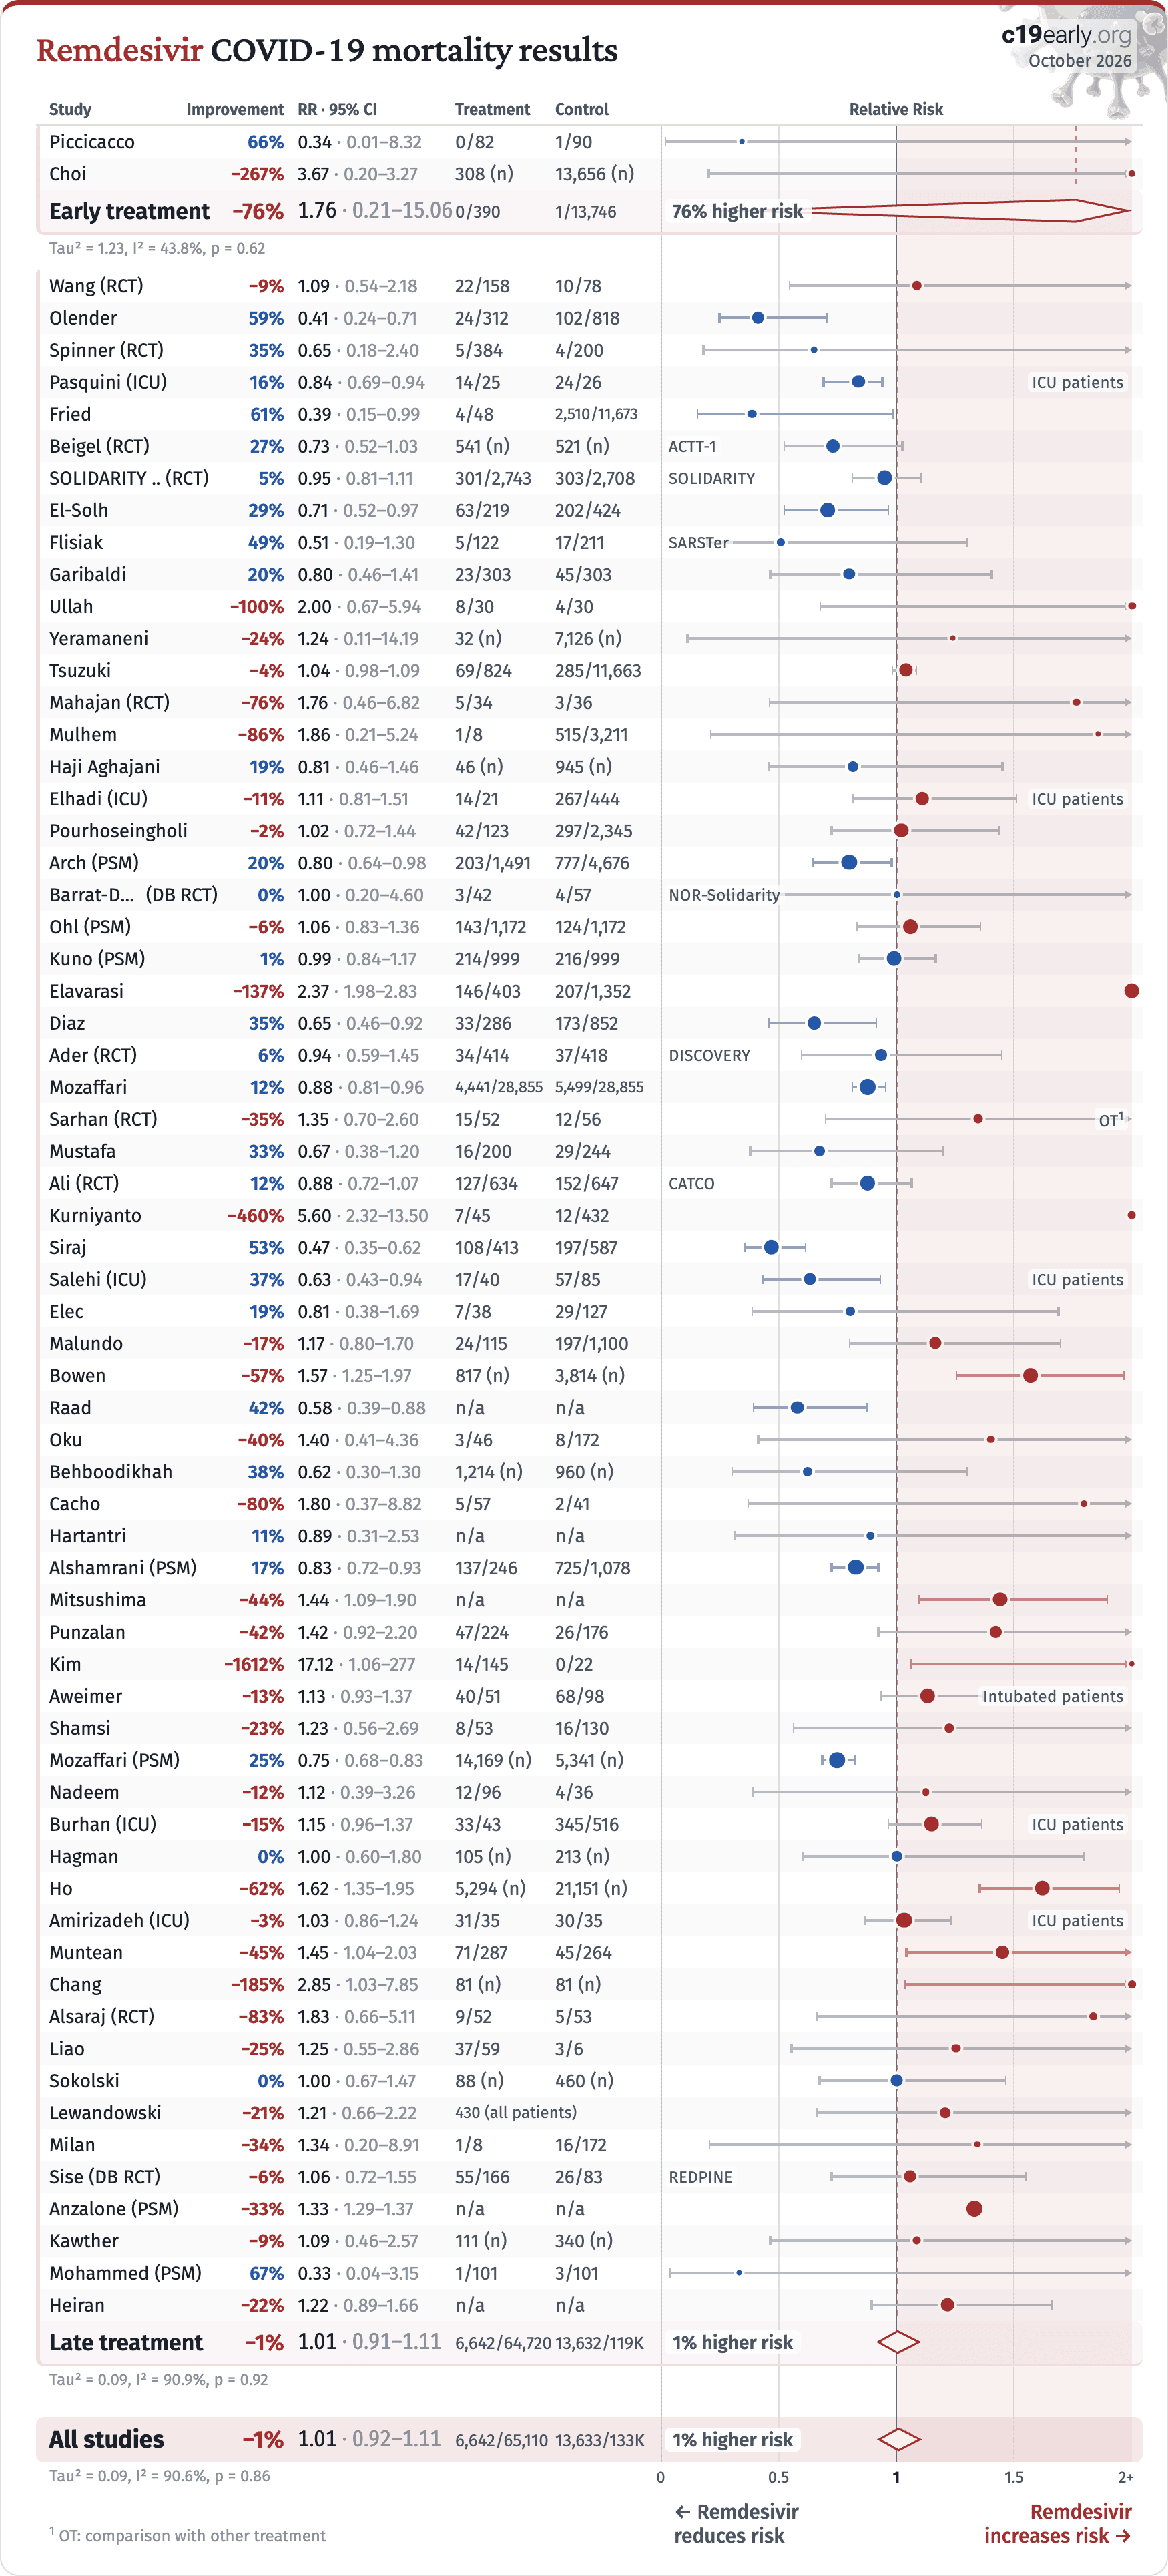
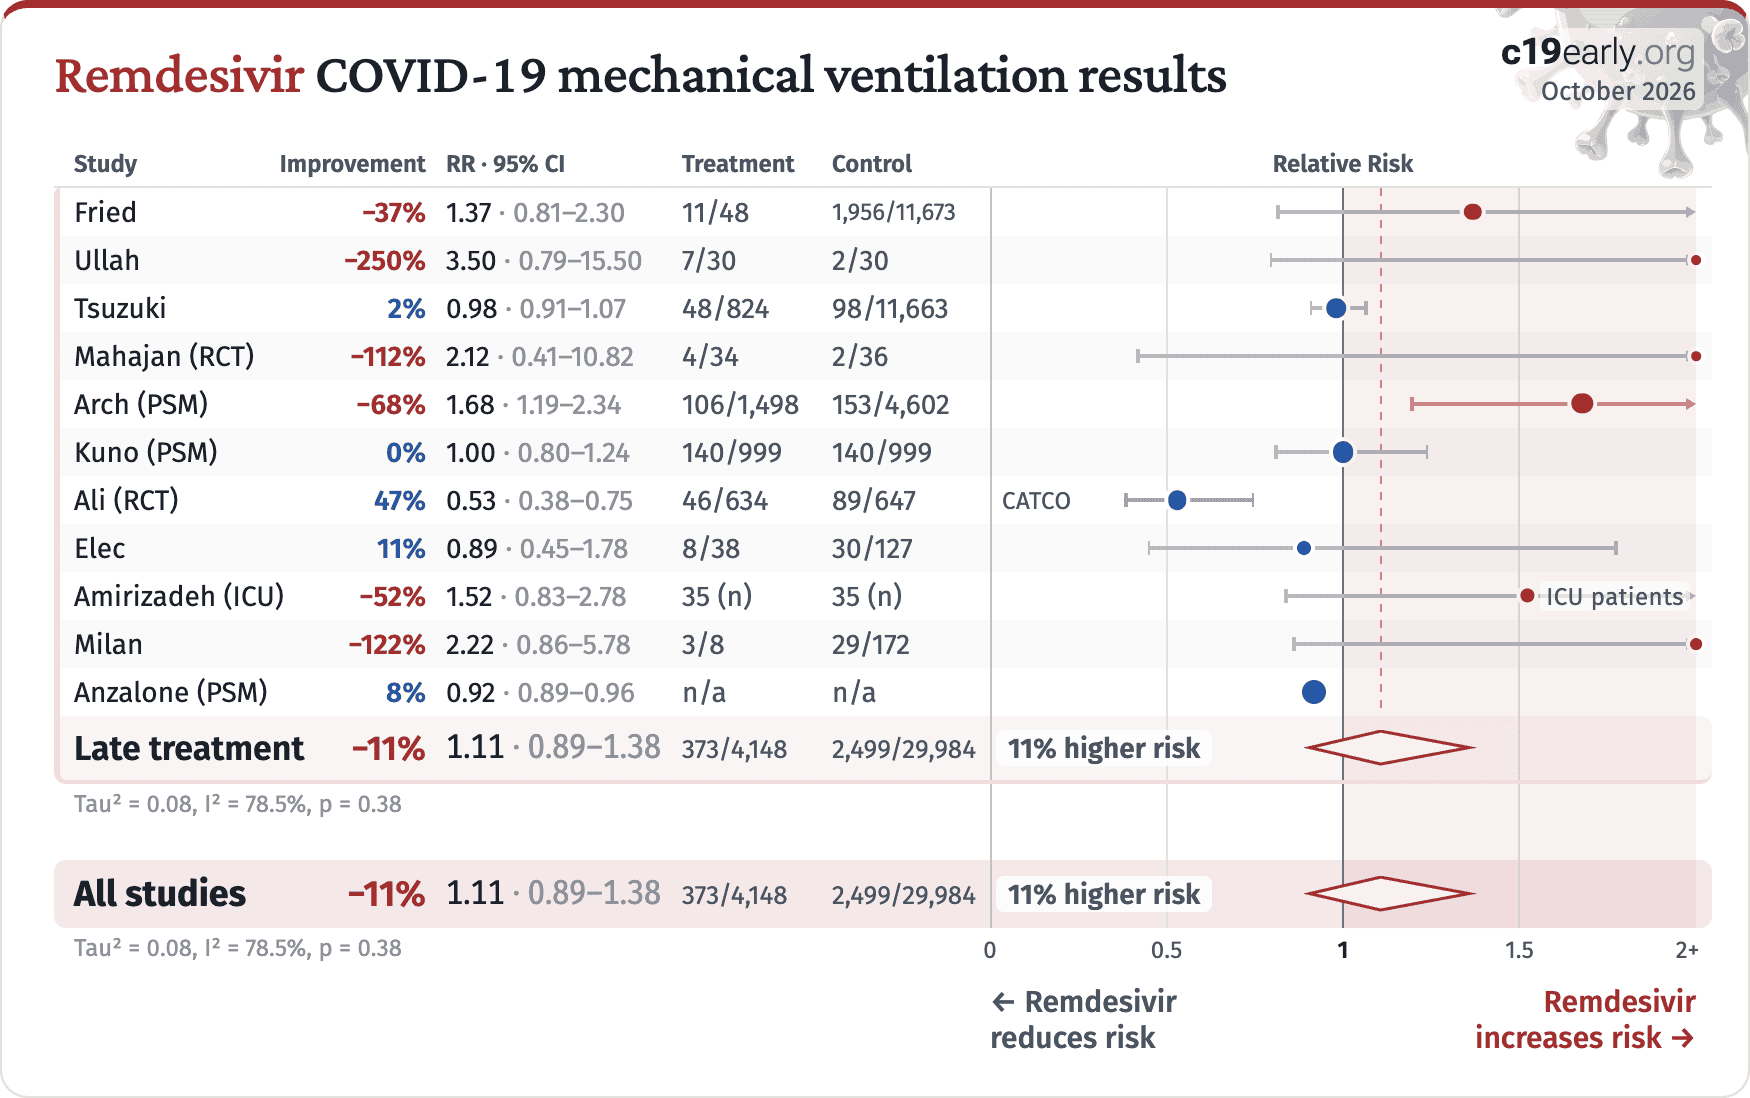
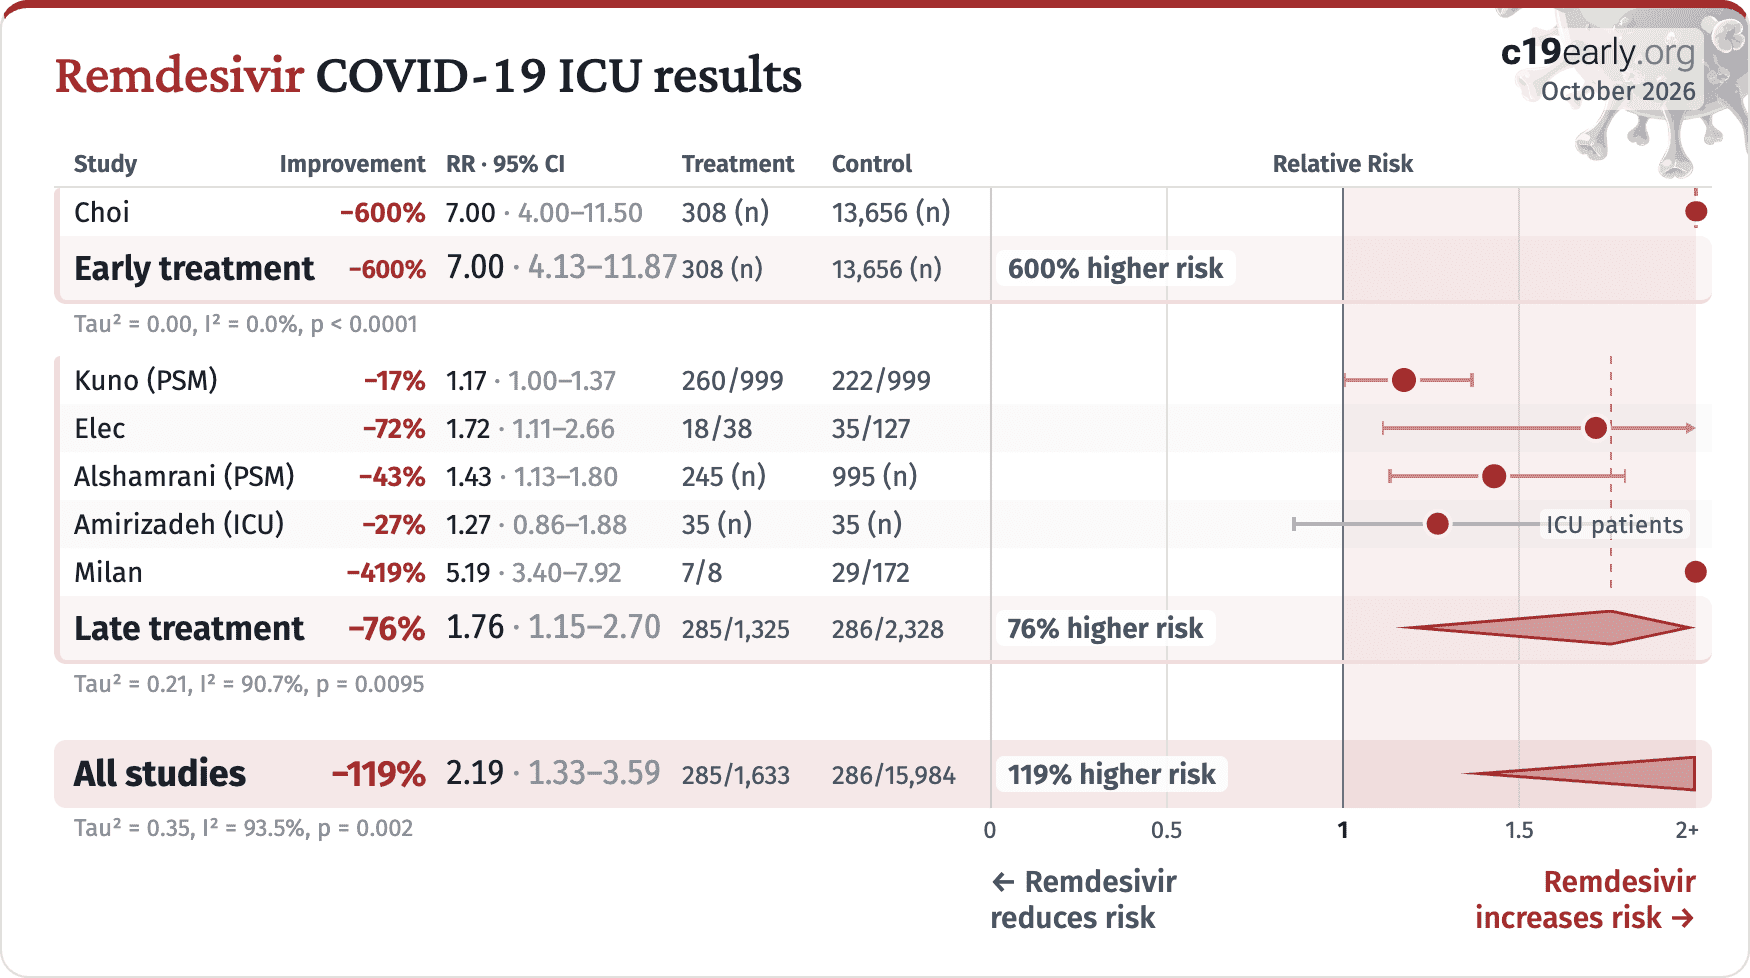
Table 1 summarizes the results for all stages combined, for Randomized Controlled Trials, for peer-reviewed studies, after exclusions, and for specific outcomes. Table 2 shows results by treatment stage. Fig. 4 plots individual results by treatment stage. Fig. 5, 6, 7, 8, 9, 10, 11, 12, and 13 show forest plots for random-effects meta-analysis of all studies with pooled effects, mortality results, ventilation, ICU admission, hospitalization, progression, viral clearance, peer reviewed studies, and long COVID.
Table 1. Random-effects meta-analysis for all stages combined, for Randomized Controlled Trials, for peer-reviewed studies, after exclusions, and for specific outcomes. Results show the relative risk with treatment and the 95% confidence interval. * p<0.05  ** p<0.01  **** p<0.0001.
Relative Risk Studies Patients
All studies1.04 [0.96‑1.13]81200K
After exclusions0.99 [0.91‑1.09]59180K
Peer-reviewedPeer-reviewed1.07 [0.98‑1.17]76190K
RCTsRCTs0.92 [0.81‑1.06]1310K
Mortality1.01 [0.92‑1.11]66190K
VentilationVent.1.11 [0.89‑1.38]1130K
ICU admissionICU2.19 [1.33‑3.59]**610K
HospitalizationHosp.1.21 [0.96‑1.52]116,740
Viral1.00 [0.77‑1.31]6839
RCT mortality0.93 [0.84‑1.04]1110K
RCT hospitalizationRCT hosp.0.58 [0.18‑1.87]31,979
Table 2. Random-effects meta-analysis results by treatment stage. Results show the relative risk with treatment and the 95% confidence interval.treatment and the 95% confidence interval. * p<0.05  ** p<0.01  **** p<0.0001.
Early treatment Late treatment
All studies1.15 [0.64‑2.04]1.15
[0.64‑2.04]
1.04 [0.95‑1.13]1.04
[0.95‑1.13]
After exclusions1.10 [0.59‑2.03]1.10
[0.59‑2.03]
0.99 [0.90‑1.08]0.99
[0.90‑1.08]
Peer-reviewedPeer-reviewed1.15 [0.64‑2.04]1.15
[0.64‑2.04]
1.07 [0.98‑1.17]1.07
[0.98‑1.17]
RCTsRCTs0.15 [0.04‑0.58]**0.15**
[0.04‑0.58]
0.93 [0.84‑1.04]0.93
[0.84‑1.04]
Mortality1.76 [0.21‑15.06]1.76
[0.21‑15.06]
1.01 [0.91‑1.11]1.01
[0.91‑1.11]
VentilationVent.1.11 [0.89‑1.38]1.11
[0.89‑1.38]
ICU admissionICU7.00 [4.00‑11.50]****7.00****
[4.00‑11.50]
1.76 [1.15‑2.70]**1.76**
[1.15‑2.70]
HospitalizationHosp.0.84 [0.40‑1.76]0.84
[0.40‑1.76]
1.30 [1.01‑1.67]*1.30*
[1.01‑1.67]
Viral1.01 [0.46‑2.22]1.01
[0.46‑2.22]
1.07 [0.75‑1.52]1.07
[0.75‑1.52]
RCT mortality0.93 [0.84‑1.04]0.93
[0.84‑1.04]
RCT hospitalizationRCT hosp.0.29 [0.11‑0.73]**0.29**
[0.11‑0.73]
1.11 [1.01‑1.23]*1.11*
[1.01‑1.23]
Loading..
Fig. 4. Scatter plot showing the most serious outcome in all studies, and for studies within each stage. Diamonds shows the results of random-effects meta-analysis.
October 2026

Remdesivir COVID-19 studies

StudyImprovementRR · 95% CIOutcomeTreatmentControlRelative Risk
Early treatment−15%1.15 · 0.64–2.0410/1,15246/14,60315% higher risk
Tau² = 0.31, I² = 40.6%, p = 0.65
Wang (RCT)−9%1.09 · 0.54–2.18death22/15810/78 Olender59%0.41 · 0.24–0.71death24/312102/818 Spinner (RCT)35%0.65 · 0.18–2.40death5/3844/200 Pasquini (ICU)16%0.84 · 0.69–0.94death14/2524/26ICU patients Fried61%0.39 · 0.15–0.99death4/482,510/11,673 Beigel (RCT)27%0.73 · 0.52–1.03death541 (n)521 (n)ACTT-1 SOLIDARITY .. (RCT)5%0.95 · 0.81–1.11death301/2,743303/2,708SOLIDARITY El-Solh29%0.71 · 0.52–0.97death63/219202/424 Flisiak49%0.51 · 0.19–1.30death5/12217/211SARSTer Garibaldi20%0.80 · 0.46–1.41death23/30345/303 Ullah−100%2.00 · 0.67–5.94death8/304/30 Yeramaneni−24%1.24 · 0.11–14.19death32 (n)7,126 (n) Goldberg9%0.91 · 0.50–1.67hosp. time29 (n)113 (n) Tsuzuki−4%1.04 · 0.98–1.09death69/824285/11,663 Mahajan (RCT)−76%1.76 · 0.46–6.82death5/343/36 Mulhem−86%1.86 · 0.21–5.24death1/8515/3,211 Haji Aghajani19%0.81 · 0.46–1.46death46 (n)945 (n) Elhadi (ICU)−11%1.11 · 0.81–1.51death14/21267/444ICU patients Pourhoseingholi−2%1.02 · 0.72–1.44death42/123297/2,345 Arch (PSM)20%0.80 · 0.64–0.98death203/1,491777/4,676 Barrat-Due (DB RCT)0%1.00 · 0.20–4.60death3/424/57NOR-Solidarity Ohl (PSM)−6%1.06 · 0.83–1.36death143/1,172124/1,172 Kuno (PSM)1%0.99 · 0.84–1.17death214/999216/999 Elavarasi−137%2.37 · 1.98–2.83death146/403207/1,352 Diaz35%0.65 · 0.46–0.92death33/286173/852 Ader (RCT)6%0.94 · 0.59–1.45death34/41437/418DISCOVERY Mozaffari12%0.88 · 0.81–0.96death4,441/28,8555,499/28,855 Sarhan (RCT)−35%1.35 · 0.70–2.60death15/5212/56OT1 Schmidt (PSM)−509%6.09 · 2.71–13.68severe case43 (n)434 (n) Mustafa33%0.67 · 0.38–1.20death16/20029/244 Ali (RCT)12%0.88 · 0.72–1.07death127/634152/647CATCO Kurniyanto−460%5.60 · 2.32–13.50death7/4512/432 Siraj53%0.47 · 0.35–0.62death108/413197/587 Salehi (ICU)37%0.63 · 0.43–0.94death17/4057/85ICU patients Elec19%0.81 · 0.38–1.69death7/3829/127 Malundo−17%1.17 · 0.80–1.70death24/115197/1,100 Bowen−57%1.57 · 1.25–1.97death817 (n)3,814 (n) Raad42%0.58 · 0.39–0.88deathn/an/a Oku−40%1.40 · 0.41–4.36death3/468/172 Behboodikhah38%0.62 · 0.30–1.30death1,214 (n)960 (n) Cacho−80%1.80 · 0.37–8.82death5/572/41 Hartantri11%0.89 · 0.31–2.53deathn/an/a Alshamrani (PSM)17%0.83 · 0.72–0.93death137/246725/1,078 Mitsushima−44%1.44 · 1.09–1.90deathn/an/a Punzalan−42%1.42 · 0.92–2.20death47/22426/176 Kim−1612%17.12 · 1.06–277death14/1450/22 Aweimer−13%1.13 · 0.93–1.37death40/5168/98Intubated patients Arfijanto1%0.99 · 0.64–1.53viral+17/4446/118 Bavaro (PSW)7%0.93 · 0.89–0.97severe case120 (n)211 (n) Shamsi−23%1.23 · 0.56–2.69death8/5316/130 Mozaffari (PSM)25%0.75 · 0.68–0.83death14,169 (n)5,341 (n) Nadeem−12%1.12 · 0.39–3.26death12/964/36 Burhan (ICU)−15%1.15 · 0.96–1.37death33/43345/516ICU patients Hagman0%1.00 · 0.60–1.80death105 (n)213 (n) Ho−62%1.62 · 1.35–1.95death5,294 (n)21,151 (n) Amirizadeh (ICU)−3%1.03 · 0.86–1.24death31/3530/35ICU patients Muntean−45%1.45 · 1.04–2.03death71/28745/264 Chang−185%2.85 · 1.03–7.85death81 (n)81 (n) Alsaraj (RCT)−83%1.83 · 0.66–5.11death9/525/53 Liao−25%1.25 · 0.55–2.86death37/593/6 Sokolski0%1.00 · 0.67–1.47death88 (n)460 (n) Lewandowski−21%1.21 · 0.66–2.22death430 (all patients) Drouin−46%1.46 · 1.15–1.54severe case52/102135/354 Milan−34%1.34 · 0.20–8.91death1/816/172 Sise (DB RCT)−6%1.06 · 0.72–1.55death55/16626/83REDPINE Anzalone (PSM)−33%1.33 · 1.29–1.37deathn/an/a Kawther−9%1.09 · 0.46–2.57death111 (n)340 (n) Angleitner−223%3.23 · 1.46–7.17viral time8 (n)55 (n) Mohammed (PSM)67%0.33 · 0.04–3.15death1/1013/101 Floridia−23%1.23 · 0.78–1.95PASC318 (n)1,216 (n) Heiran−22%1.22 · 0.89–1.66deathn/an/a
Late treatment−4%1.04 · 0.95–1.136,711/65,38413,813/122K4% higher risk
Tau² = 0.07, I² = 90.8%, p = 0.42
All studies−4%1.04 · 0.96–1.136,721/66,53613,859/136K4% higher risk
Tau² = 0.07, I² = 89.7%, p = 0.3600.511.52+
1 OT: comparison with other treatment
Rotate screen for more detailsIncrease width for more details
← Remdesivir
reduces risk
Remdesivir
increases risk →
Fig. 5. Random-effects meta-analysis for all studies. This plot shows pooled effects, see the specific outcome analyses for individual outcomes. Analysis validating pooled outcomes for COVID-19 can be found below. Effect extraction is pre-specified, using the most serious outcome reported. For details see the appendix.
October 2026

Remdesivir COVID-19 mortality results

StudyImprovementRR · 95% CITreatmentControlRelative Risk
Early treatment−76%1.76 · 0.21–15.060/3901/13,74676% higher risk
Tau² = 1.23, I² = 43.8%, p = 0.62
Wang (RCT)−9%1.09 · 0.54–2.1822/15810/78 Olender59%0.41 · 0.24–0.7124/312102/818 Spinner (RCT)35%0.65 · 0.18–2.405/3844/200 Pasquini (ICU)16%0.84 · 0.69–0.9414/2524/26ICU patients Fried61%0.39 · 0.15–0.994/482,510/11,673 Beigel (RCT)27%0.73 · 0.52–1.03541 (n)521 (n)ACTT-1 SOLIDARITY .. (RCT)5%0.95 · 0.81–1.11301/2,743303/2,708SOLIDARITY El-Solh29%0.71 · 0.52–0.9763/219202/424 Flisiak49%0.51 · 0.19–1.305/12217/211SARSTer Garibaldi20%0.80 · 0.46–1.4123/30345/303 Ullah−100%2.00 · 0.67–5.948/304/30 Yeramaneni−24%1.24 · 0.11–14.1932 (n)7,126 (n) Tsuzuki−4%1.04 · 0.98–1.0969/824285/11,663 Mahajan (RCT)−76%1.76 · 0.46–6.825/343/36 Mulhem−86%1.86 · 0.21–5.241/8515/3,211 Haji Aghajani19%0.81 · 0.46–1.4646 (n)945 (n) Elhadi (ICU)−11%1.11 · 0.81–1.5114/21267/444ICU patients Pourhoseingholi−2%1.02 · 0.72–1.4442/123297/2,345 Arch (PSM)20%0.80 · 0.64–0.98203/1,491777/4,676 Barrat-Due (DB RCT)0%1.00 · 0.20–4.603/424/57NOR-Solidarity Ohl (PSM)−6%1.06 · 0.83–1.36143/1,172124/1,172 Kuno (PSM)1%0.99 · 0.84–1.17214/999216/999 Elavarasi−137%2.37 · 1.98–2.83146/403207/1,352 Diaz35%0.65 · 0.46–0.9233/286173/852 Ader (RCT)6%0.94 · 0.59–1.4534/41437/418DISCOVERY Mozaffari12%0.88 · 0.81–0.964,441/28,8555,499/28,855 Sarhan (RCT)−35%1.35 · 0.70–2.6015/5212/56OT1 Mustafa33%0.67 · 0.38–1.2016/20029/244 Ali (RCT)12%0.88 · 0.72–1.07127/634152/647CATCO Kurniyanto−460%5.60 · 2.32–13.507/4512/432 Siraj53%0.47 · 0.35–0.62108/413197/587 Salehi (ICU)37%0.63 · 0.43–0.9417/4057/85ICU patients Elec19%0.81 · 0.38–1.697/3829/127 Malundo−17%1.17 · 0.80–1.7024/115197/1,100 Bowen−57%1.57 · 1.25–1.97817 (n)3,814 (n) Raad42%0.58 · 0.39–0.88n/an/a Oku−40%1.40 · 0.41–4.363/468/172 Behboodikhah38%0.62 · 0.30–1.301,214 (n)960 (n) Cacho−80%1.80 · 0.37–8.825/572/41 Hartantri11%0.89 · 0.31–2.53n/an/a Alshamrani (PSM)17%0.83 · 0.72–0.93137/246725/1,078 Mitsushima−44%1.44 · 1.09–1.90n/an/a Punzalan−42%1.42 · 0.92–2.2047/22426/176 Kim−1612%17.12 · 1.06–27714/1450/22 Aweimer−13%1.13 · 0.93–1.3740/5168/98Intubated patients Shamsi−23%1.23 · 0.56–2.698/5316/130 Mozaffari (PSM)25%0.75 · 0.68–0.8314,169 (n)5,341 (n) Nadeem−12%1.12 · 0.39–3.2612/964/36 Burhan (ICU)−15%1.15 · 0.96–1.3733/43345/516ICU patients Hagman0%1.00 · 0.60–1.80105 (n)213 (n) Ho−62%1.62 · 1.35–1.955,294 (n)21,151 (n) Amirizadeh (ICU)−3%1.03 · 0.86–1.2431/3530/35ICU patients Muntean−45%1.45 · 1.04–2.0371/28745/264 Chang−185%2.85 · 1.03–7.8581 (n)81 (n) Alsaraj (RCT)−83%1.83 · 0.66–5.119/525/53 Liao−25%1.25 · 0.55–2.8637/593/6 Sokolski0%1.00 · 0.67–1.4788 (n)460 (n) Lewandowski−21%1.21 · 0.66–2.22430 (all patients) Milan−34%1.34 · 0.20–8.911/816/172 Sise (DB RCT)−6%1.06 · 0.72–1.5555/16626/83REDPINE Anzalone (PSM)−33%1.33 · 1.29–1.37n/an/a Kawther−9%1.09 · 0.46–2.57111 (n)340 (n) Mohammed (PSM)67%0.33 · 0.04–3.151/1013/101 Heiran−22%1.22 · 0.89–1.66n/an/a
Late treatment−1%1.01 · 0.91–1.116,642/64,72013,632/119K1% higher risk
Tau² = 0.09, I² = 90.9%, p = 0.92
All studies−1%1.01 · 0.92–1.116,642/65,11013,633/133K1% higher risk
Tau² = 0.09, I² = 90.6%, p = 0.8600.511.52+
1 OT: comparison with other treatment
Rotate screen for more detailsIncrease width for more details
← Remdesivir
reduces risk
Remdesivir
increases risk →
Fig. 6. Random-effects meta-analysis for mortality results.
October 2026

Remdesivir COVID-19 mechanical ventilation results

StudyImprovementRR · 95% CITreatmentControlRelative Risk
Late treatment−11%1.11 · 0.89–1.38373/4,1482,499/29,98411% higher risk
Tau² = 0.08, I² = 78.5%, p = 0.38
All studies−11%1.11 · 0.89–1.38373/4,1482,499/29,98411% higher risk
Tau² = 0.08, I² = 78.5%, p = 0.3800.511.52+
Rotate screen for more detailsIncrease width for more details
← Remdesivir
reduces risk
Remdesivir
increases risk →
Fig. 7. Random-effects meta-analysis for ventilation.
October 2026

Remdesivir COVID-19 ICU results

StudyImprovementRR · 95% CITreatmentControlRelative Risk
Early treatment−600%7.00 · 4.13–11.87308 (n)13,656 (n)600% higher risk
Tau² = 0.00, I² = 0.0%, p < 0.0001
Late treatment−76%1.76 · 1.15–2.70285/1,325286/2,32876% higher risk
Tau² = 0.21, I² = 90.7%, p = 0.0095
All studies−119%2.19 · 1.33–3.59285/1,633286/15,984119% higher risk
Tau² = 0.35, I² = 93.5%, p = 0.00200.511.52+
Rotate screen for more detailsIncrease width for more details
← Remdesivir
reduces risk
Remdesivir
increases risk →
Fig. 8. Random-effects meta-analysis for ICU admission.
October 2026

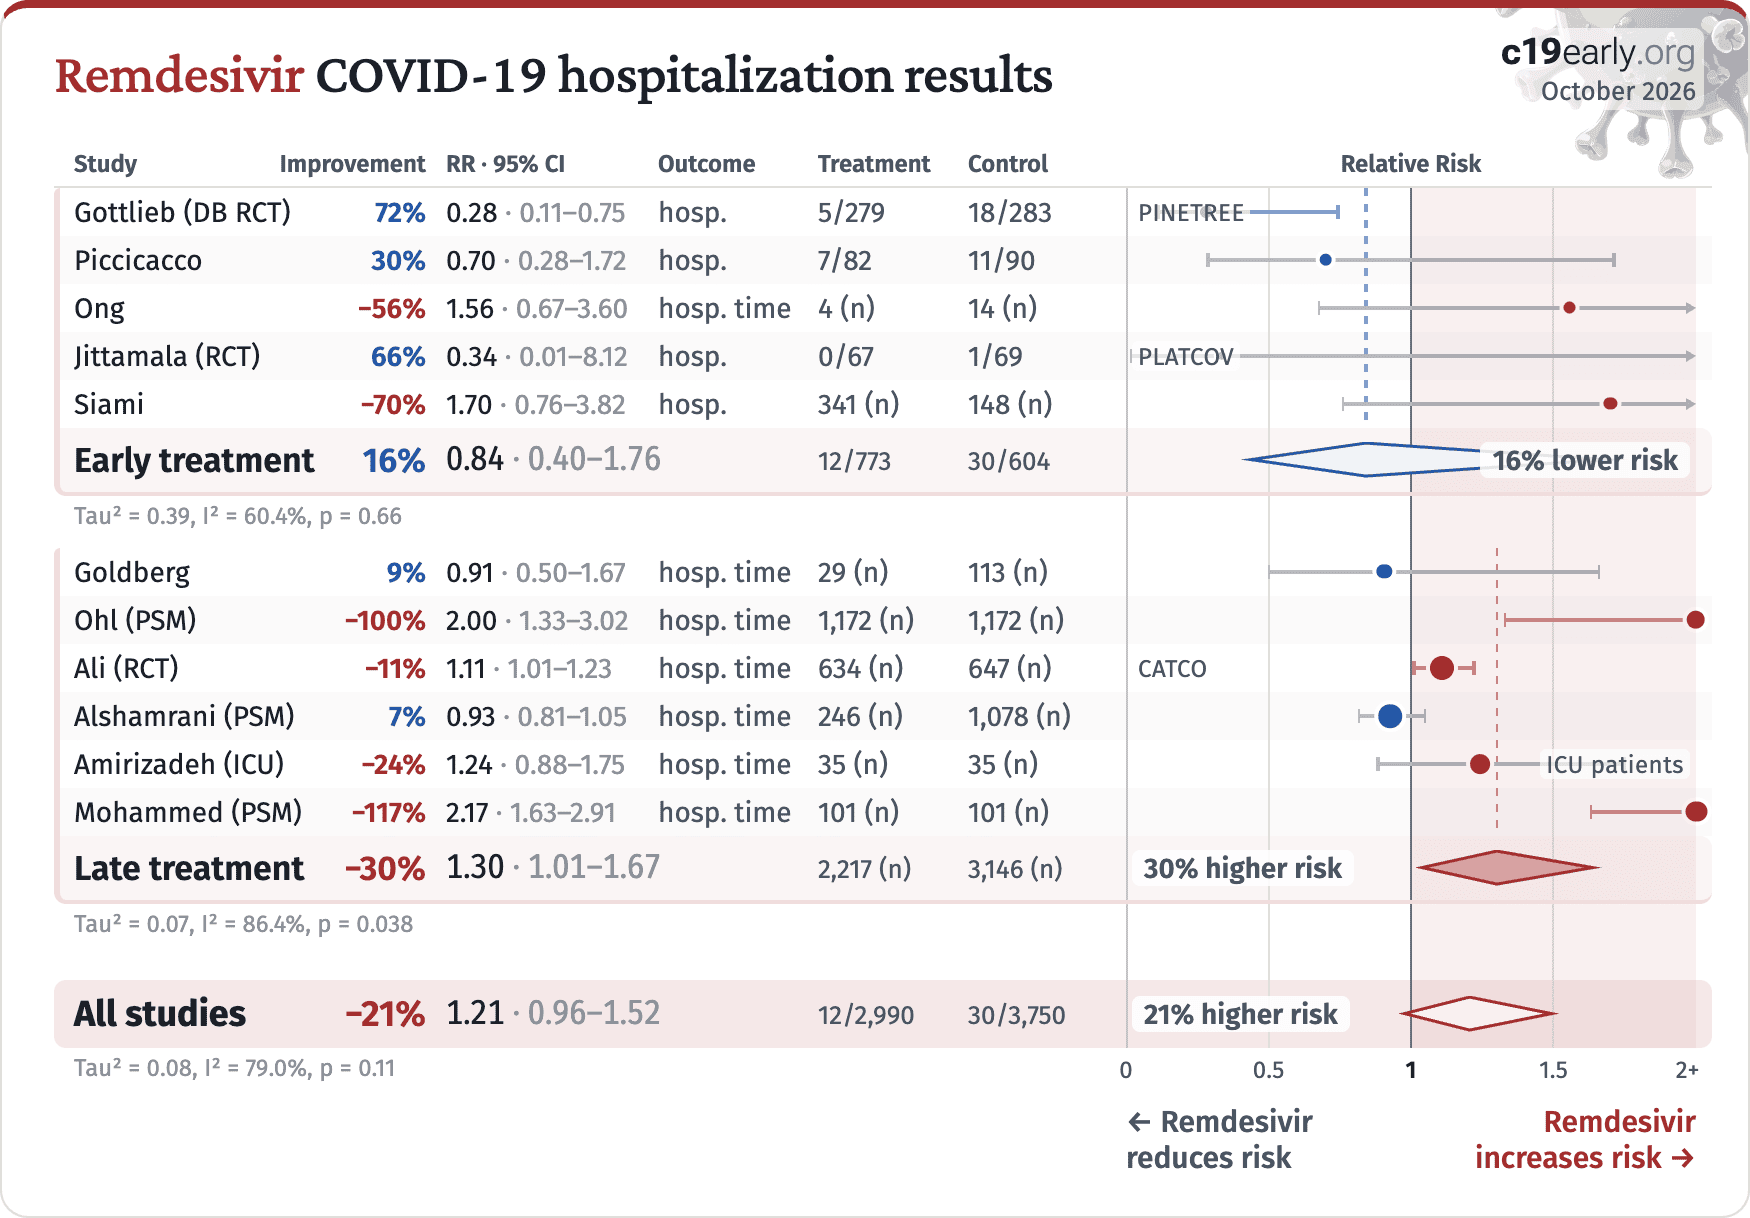
Remdesivir COVID-19 hospitalization results

StudyImprovementRR · 95% CIOutcomeTreatmentControlRelative Risk
Early treatment16%0.84 · 0.40–1.7612/77330/60416% lower risk
Tau² = 0.39, I² = 60.4%, p = 0.66
Late treatment−30%1.30 · 1.01–1.672,217 (n)3,146 (n)30% higher risk
Tau² = 0.07, I² = 86.4%, p = 0.038
All studies−21%1.21 · 0.96–1.5212/2,99030/3,75021% higher risk
Tau² = 0.08, I² = 79.0%, p = 0.1100.511.52+
Rotate screen for more detailsIncrease width for more details
← Remdesivir
reduces risk
Remdesivir
increases risk →
Fig. 9. Random-effects meta-analysis for hospitalization.
October 2026

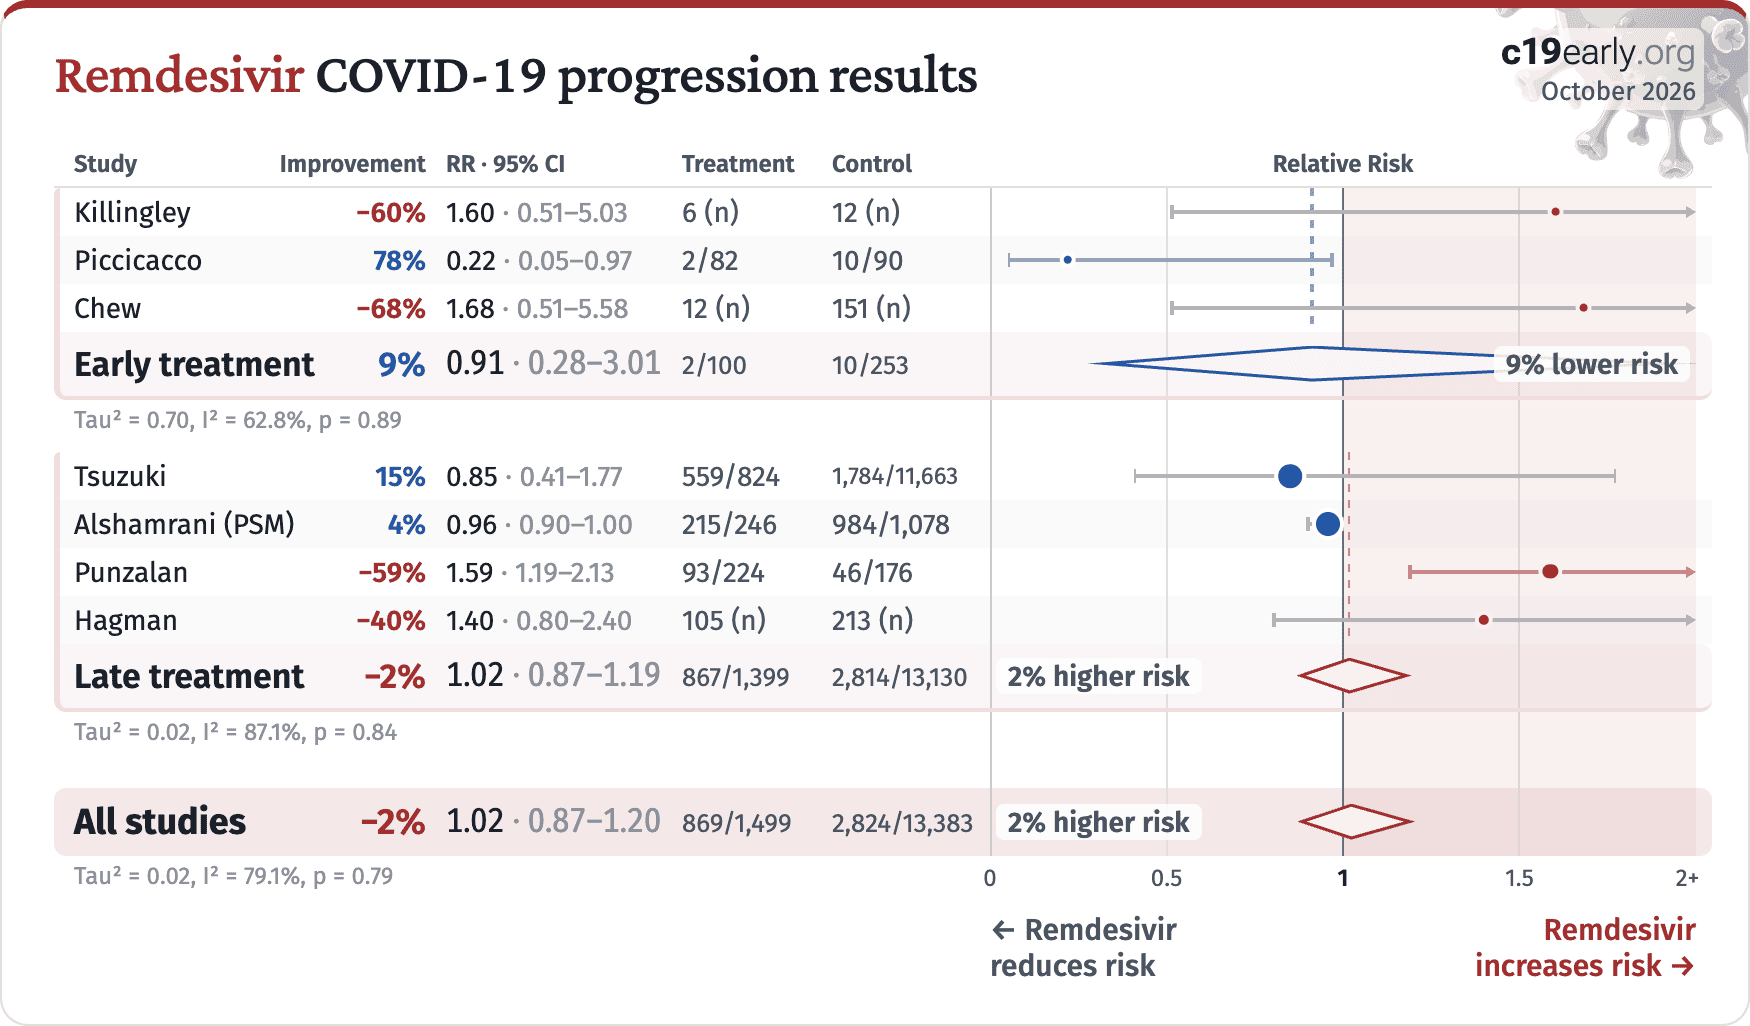
Remdesivir COVID-19 progression results

StudyImprovementRR · 95% CITreatmentControlRelative Risk
Early treatment9%0.91 · 0.28–3.012/10010/2539% lower risk
Tau² = 0.70, I² = 62.8%, p = 0.89
Late treatment−2%1.02 · 0.87–1.19867/1,3992,814/13,1302% higher risk
Tau² = 0.02, I² = 87.1%, p = 0.84
All studies−2%1.02 · 0.87–1.20869/1,4992,824/13,3832% higher risk
Tau² = 0.02, I² = 79.1%, p = 0.7900.511.52+
Rotate screen for more detailsIncrease width for more details
← Remdesivir
reduces risk
Remdesivir
increases risk →
Fig. 10. Random-effects meta-analysis for progression.
October 2026

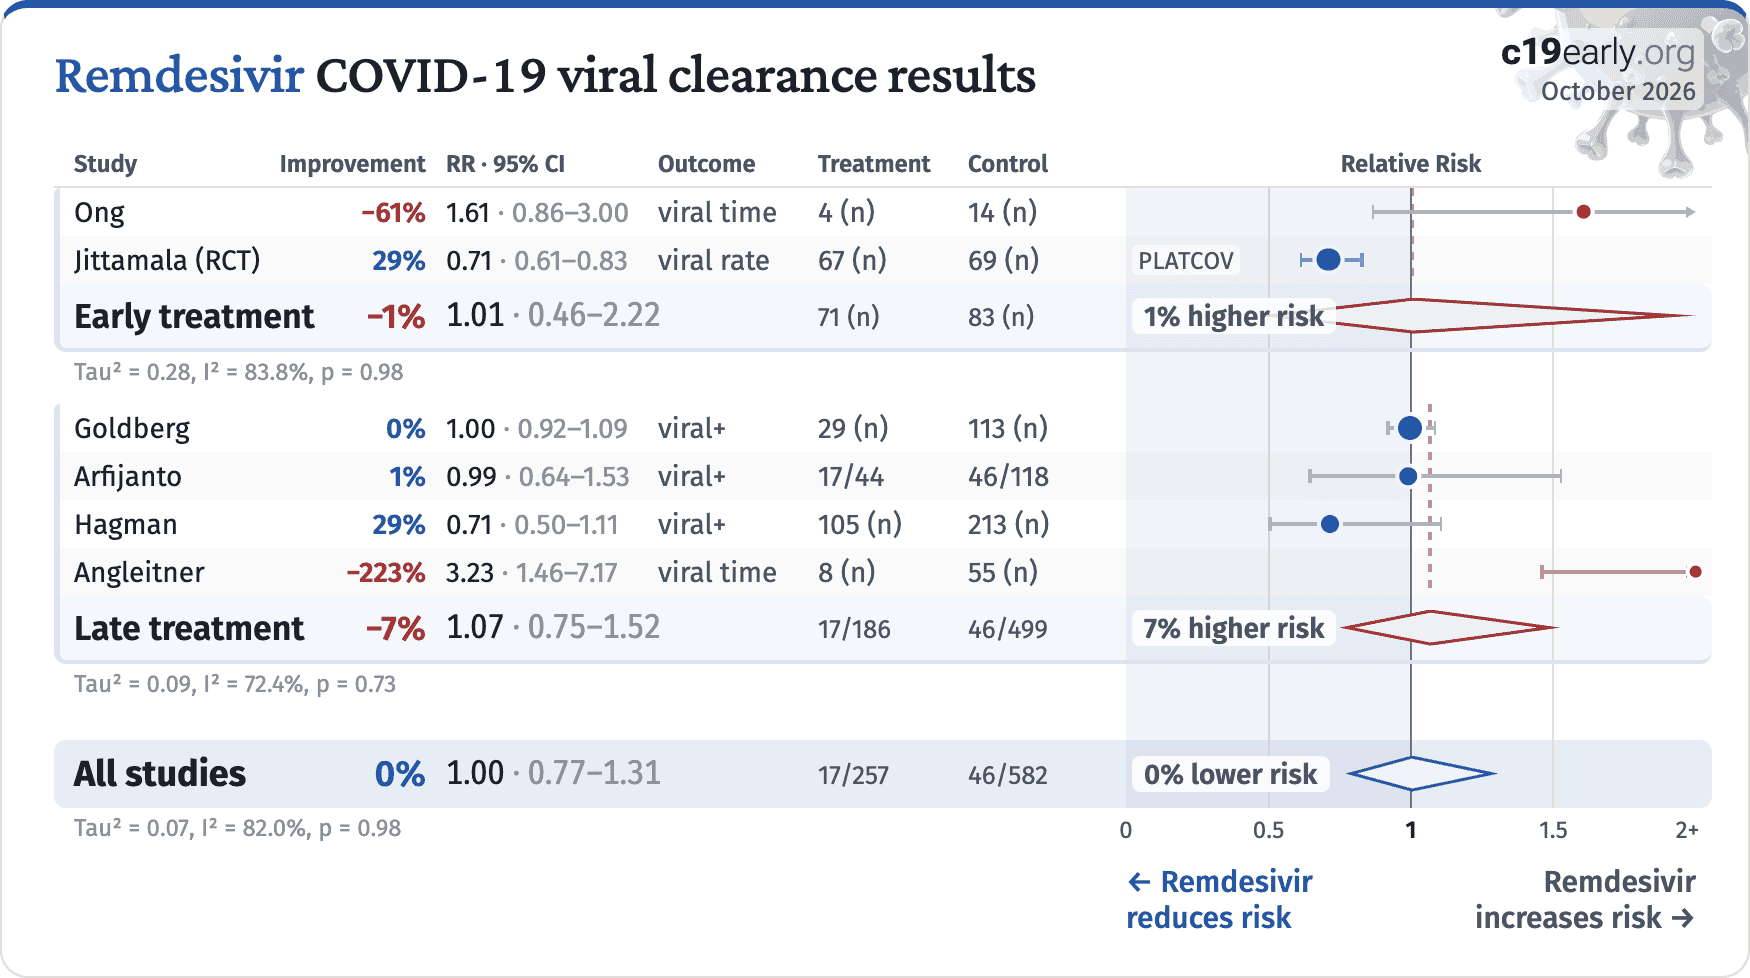
Remdesivir COVID-19 viral clearance results

StudyImprovementRR · 95% CIOutcomeTreatmentControlRelative Risk
Early treatment−1%1.01 · 0.46–2.2271 (n)83 (n)1% higher risk
Tau² = 0.28, I² = 83.8%, p = 0.98
Late treatment−7%1.07 · 0.75–1.5217/18646/4997% higher risk
Tau² = 0.09, I² = 72.4%, p = 0.73
All studies0%1.00 · 0.77–1.3117/25746/5820% lower risk
Tau² = 0.07, I² = 82.0%, p = 0.9800.511.52+
Rotate screen for more detailsIncrease width for more details
← Remdesivir
reduces risk
Remdesivir
increases risk →
Fig. 11. Random-effects meta-analysis for viral clearance.
October 2026

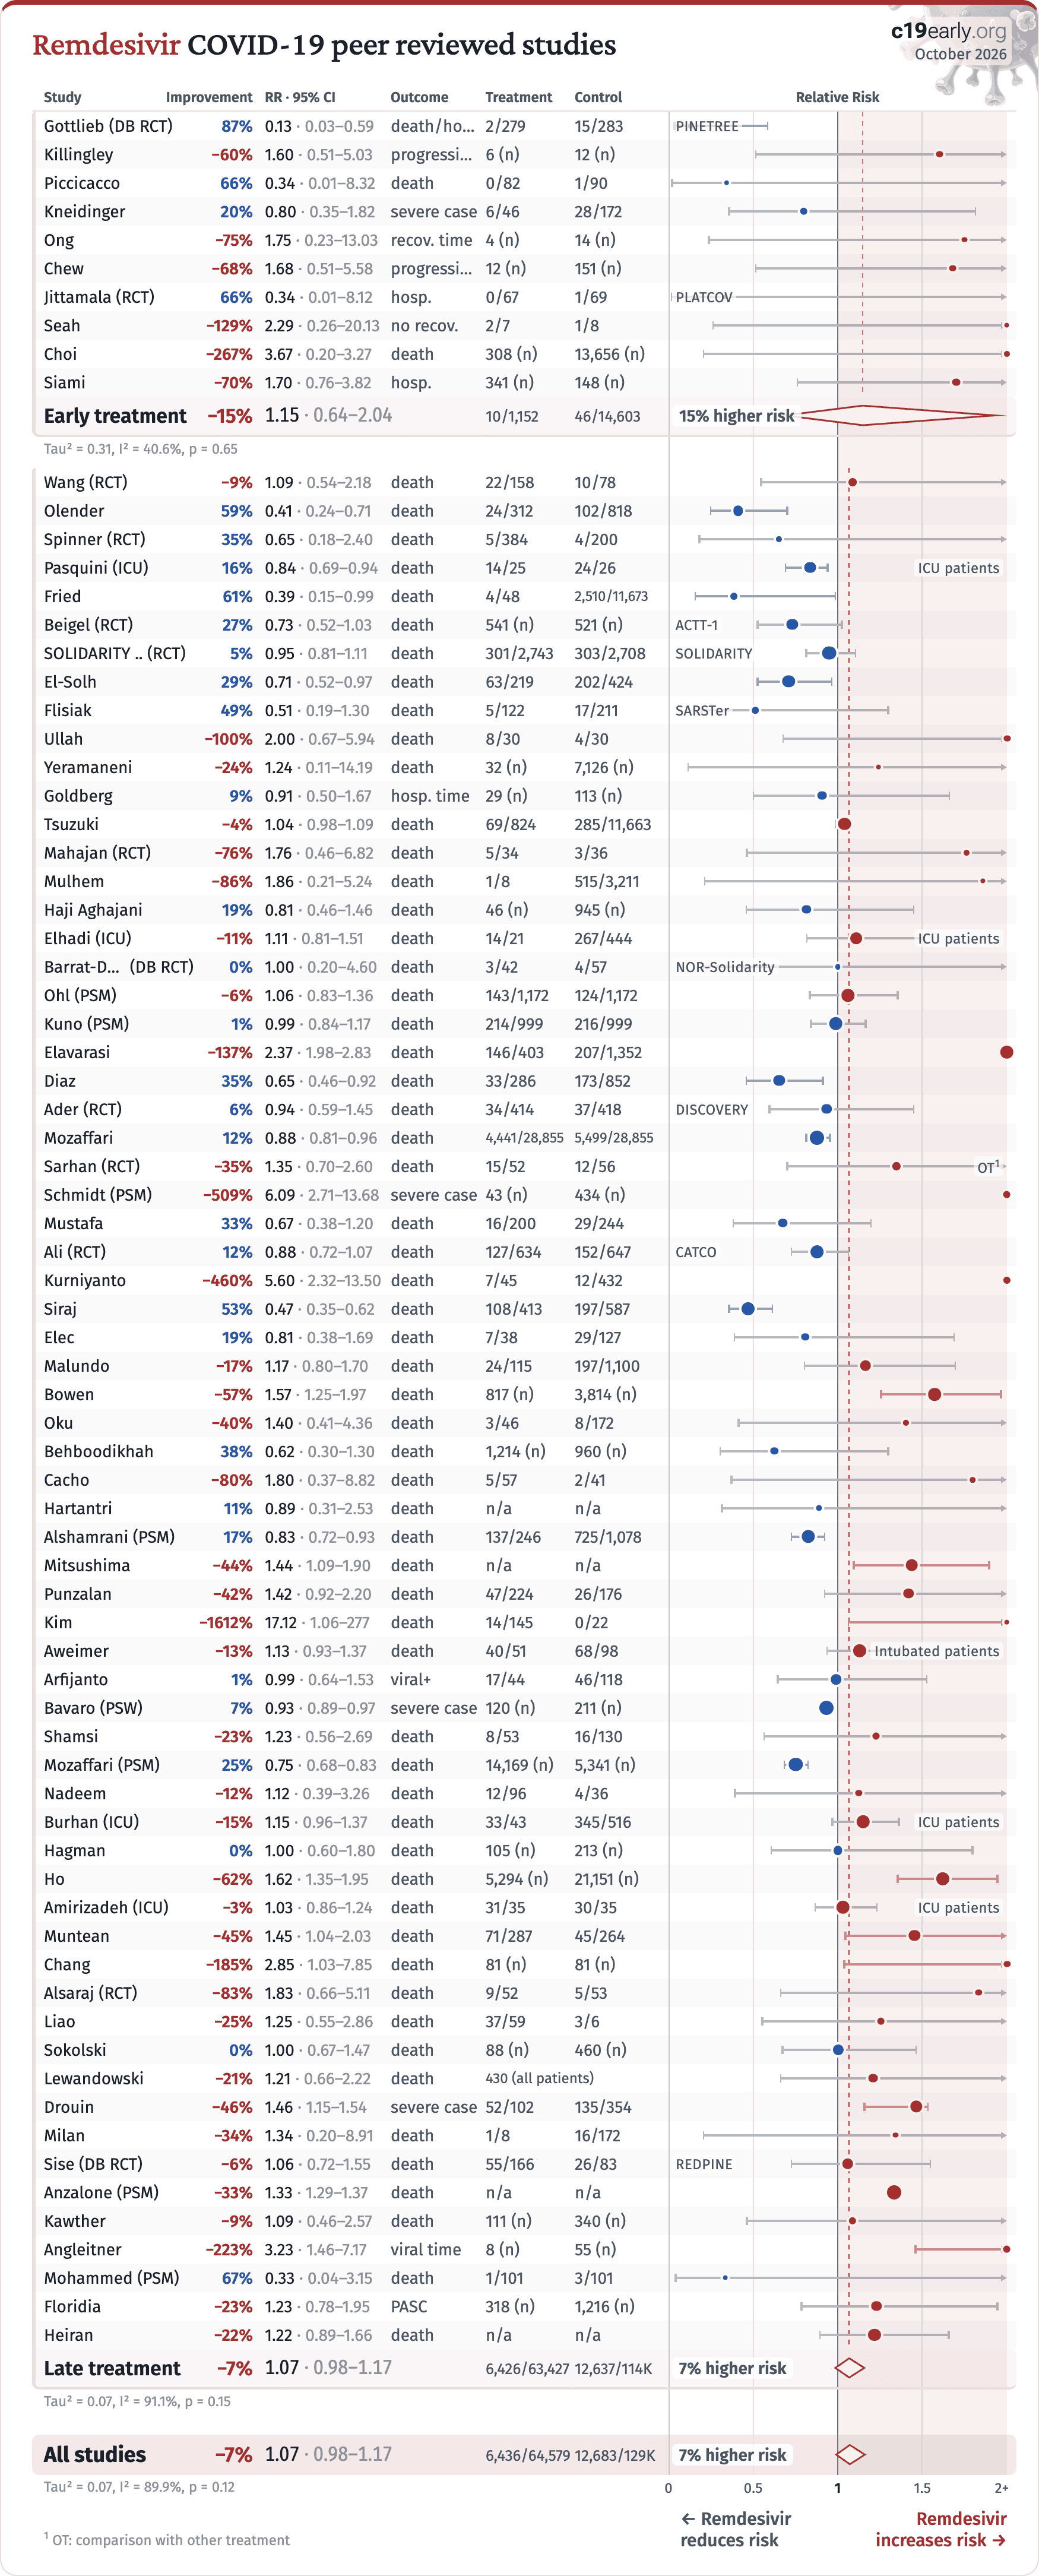
Remdesivir COVID-19 peer reviewed studies

StudyImprovementRR · 95% CIOutcomeTreatmentControlRelative Risk
Early treatment−15%1.15 · 0.64–2.0410/1,15246/14,60315% higher risk
Tau² = 0.31, I² = 40.6%, p = 0.65
Wang (RCT)−9%1.09 · 0.54–2.18death22/15810/78 Olender59%0.41 · 0.24–0.71death24/312102/818 Spinner (RCT)35%0.65 · 0.18–2.40death5/3844/200 Pasquini (ICU)16%0.84 · 0.69–0.94death14/2524/26ICU patients Fried61%0.39 · 0.15–0.99death4/482,510/11,673 Beigel (RCT)27%0.73 · 0.52–1.03death541 (n)521 (n)ACTT-1 SOLIDARITY .. (RCT)5%0.95 · 0.81–1.11death301/2,743303/2,708SOLIDARITY El-Solh29%0.71 · 0.52–0.97death63/219202/424 Flisiak49%0.51 · 0.19–1.30death5/12217/211SARSTer Ullah−100%2.00 · 0.67–5.94death8/304/30 Yeramaneni−24%1.24 · 0.11–14.19death32 (n)7,126 (n) Goldberg9%0.91 · 0.50–1.67hosp. time29 (n)113 (n) Tsuzuki−4%1.04 · 0.98–1.09death69/824285/11,663 Mahajan (RCT)−76%1.76 · 0.46–6.82death5/343/36 Mulhem−86%1.86 · 0.21–5.24death1/8515/3,211 Haji Aghajani19%0.81 · 0.46–1.46death46 (n)945 (n) Elhadi (ICU)−11%1.11 · 0.81–1.51death14/21267/444ICU patients Barrat-Due (DB RCT)0%1.00 · 0.20–4.60death3/424/57NOR-Solidarity Ohl (PSM)−6%1.06 · 0.83–1.36death143/1,172124/1,172 Kuno (PSM)1%0.99 · 0.84–1.17death214/999216/999 Elavarasi−137%2.37 · 1.98–2.83death146/403207/1,352 Diaz35%0.65 · 0.46–0.92death33/286173/852 Ader (RCT)6%0.94 · 0.59–1.45death34/41437/418DISCOVERY Mozaffari12%0.88 · 0.81–0.96death4,441/28,8555,499/28,855 Sarhan (RCT)−35%1.35 · 0.70–2.60death15/5212/56OT1 Schmidt (PSM)−509%6.09 · 2.71–13.68severe case43 (n)434 (n) Mustafa33%0.67 · 0.38–1.20death16/20029/244 Ali (RCT)12%0.88 · 0.72–1.07death127/634152/647CATCO Kurniyanto−460%5.60 · 2.32–13.50death7/4512/432 Siraj53%0.47 · 0.35–0.62death108/413197/587 Elec19%0.81 · 0.38–1.69death7/3829/127 Malundo−17%1.17 · 0.80–1.70death24/115197/1,100 Bowen−57%1.57 · 1.25–1.97death817 (n)3,814 (n) Oku−40%1.40 · 0.41–4.36death3/468/172 Behboodikhah38%0.62 · 0.30–1.30death1,214 (n)960 (n) Cacho−80%1.80 · 0.37–8.82death5/572/41 Hartantri11%0.89 · 0.31–2.53deathn/an/a Alshamrani (PSM)17%0.83 · 0.72–0.93death137/246725/1,078 Mitsushima−44%1.44 · 1.09–1.90deathn/an/a Punzalan−42%1.42 · 0.92–2.20death47/22426/176 Kim−1612%17.12 · 1.06–277death14/1450/22 Aweimer−13%1.13 · 0.93–1.37death40/5168/98Intubated patients Arfijanto1%0.99 · 0.64–1.53viral+17/4446/118 Bavaro (PSW)7%0.93 · 0.89–0.97severe case120 (n)211 (n) Shamsi−23%1.23 · 0.56–2.69death8/5316/130 Mozaffari (PSM)25%0.75 · 0.68–0.83death14,169 (n)5,341 (n) Nadeem−12%1.12 · 0.39–3.26death12/964/36 Burhan (ICU)−15%1.15 · 0.96–1.37death33/43345/516ICU patients Hagman0%1.00 · 0.60–1.80death105 (n)213 (n) Ho−62%1.62 · 1.35–1.95death5,294 (n)21,151 (n) Amirizadeh (ICU)−3%1.03 · 0.86–1.24death31/3530/35ICU patients Muntean−45%1.45 · 1.04–2.03death71/28745/264 Chang−185%2.85 · 1.03–7.85death81 (n)81 (n) Alsaraj (RCT)−83%1.83 · 0.66–5.11death9/525/53 Liao−25%1.25 · 0.55–2.86death37/593/6 Sokolski0%1.00 · 0.67–1.47death88 (n)460 (n) Lewandowski−21%1.21 · 0.66–2.22death430 (all patients) Drouin−46%1.46 · 1.15–1.54severe case52/102135/354 Milan−34%1.34 · 0.20–8.91death1/816/172 Sise (DB RCT)−6%1.06 · 0.72–1.55death55/16626/83REDPINE Anzalone (PSM)−33%1.33 · 1.29–1.37deathn/an/a Kawther−9%1.09 · 0.46–2.57death111 (n)340 (n) Angleitner−223%3.23 · 1.46–7.17viral time8 (n)55 (n) Mohammed (PSM)67%0.33 · 0.04–3.15death1/1013/101 Floridia−23%1.23 · 0.78–1.95PASC318 (n)1,216 (n) Heiran−22%1.22 · 0.89–1.66deathn/an/a
Late treatment−7%1.07 · 0.98–1.176,426/63,42712,637/114K7% higher risk
Tau² = 0.07, I² = 91.1%, p = 0.15
All studies−7%1.07 · 0.98–1.176,436/64,57912,683/129K7% higher risk
Tau² = 0.07, I² = 89.9%, p = 0.1200.511.52+
1 OT: comparison with other treatment
Rotate screen for more detailsIncrease width for more details
← Remdesivir
reduces risk
Remdesivir
increases risk →
Fig. 12. Random-effects meta-analysis for peer reviewed studies. Zeraatkar et al. analyze 356 COVID-19 trials, finding no significant evidence that preprint results are inconsistent with peer-reviewed studies. They also show extremely long peer-review delays, with a median of 6 months to journal publication. A six month delay was equivalent to around 1.5 million deaths during the first two years of the pandemic. Authors recommend using preprint evidence, with appropriate checks for potential falsified data, which provides higher certainty much earlier. Davidson et al. also showed no important difference between meta-analysis results of preprints and peer-reviewed publications for COVID-19, based on 37 meta-analyses including 114 trials. Effect extraction is pre-specified, using the most serious outcome reported, see the appendix for details. Analysis validating pooled outcomes for COVID-19 can be found below.
October 2026

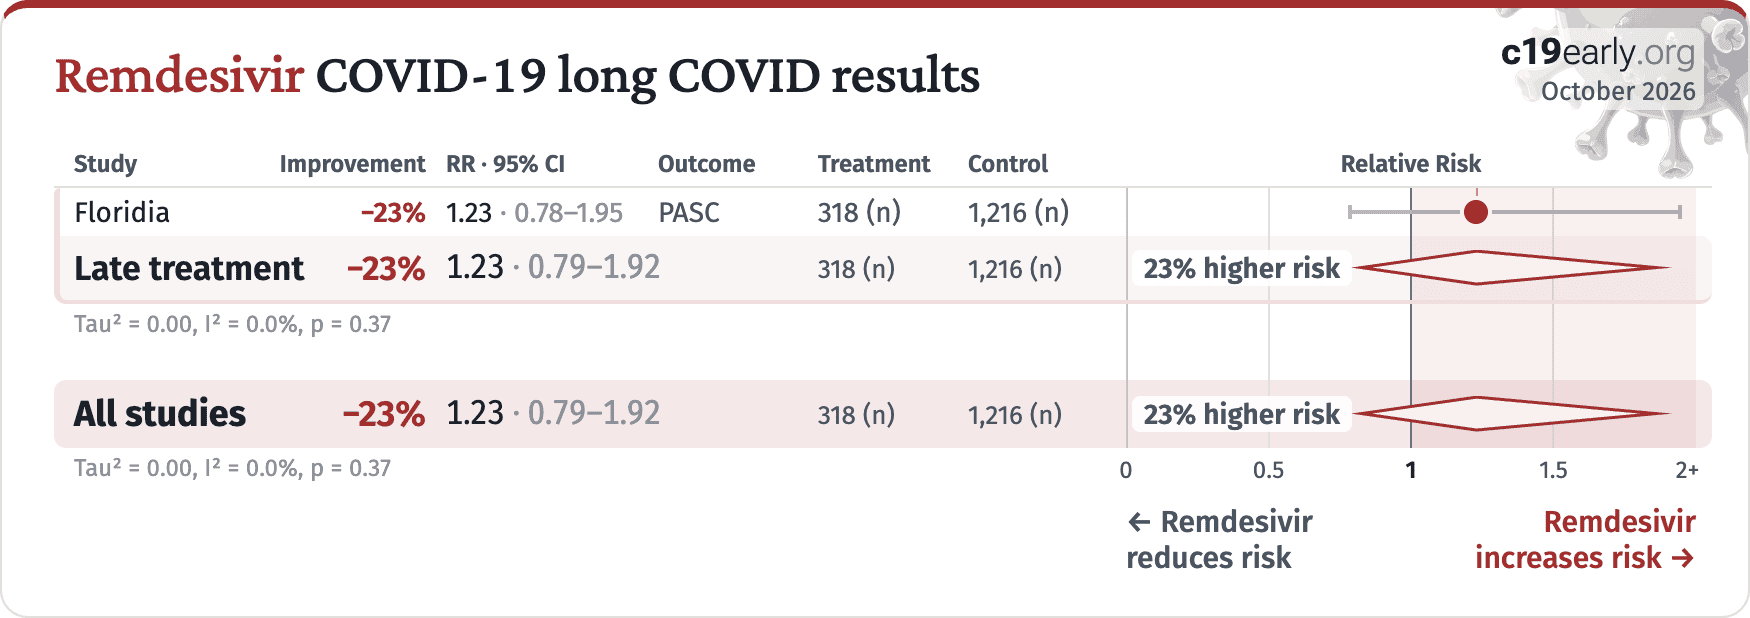
Remdesivir COVID-19 long COVID results

StudyImprovementRR · 95% CIOutcomeTreatmentControlRelative Risk
Late treatment−23%1.23 · 0.79–1.92318 (n)1,216 (n)23% higher risk
Tau² = 0.00, I² = 0.0%, p = 0.37
All studies−23%1.23 · 0.79–1.92318 (n)1,216 (n)23% higher risk
Tau² = 0.00, I² = 0.0%, p = 0.3700.511.52+
Rotate screen for more detailsIncrease width for more details
← Remdesivir
reduces risk
Remdesivir
increases risk →
Fig. 13. Random-effects meta-analysis for long COVID. Effect extraction is pre-specified, using the most serious outcome reported, see the appendix for details. Analysis validating pooled outcomes for COVID-19 can be found below.
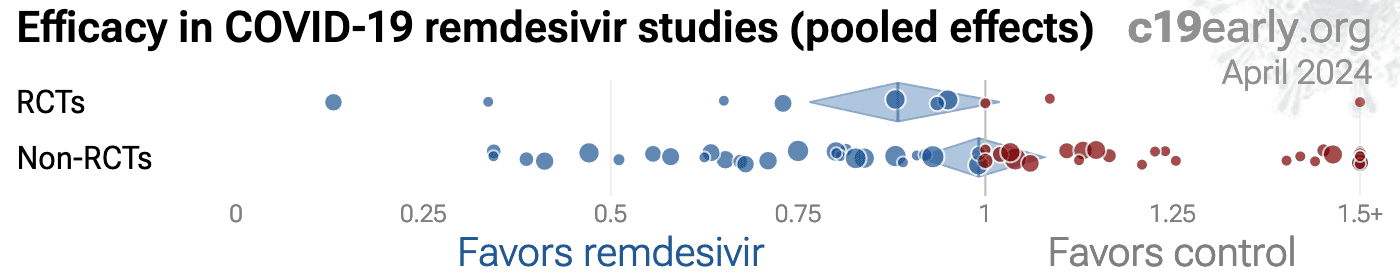
Fig. 14 shows a comparison of results for RCTs and observational studies. Fig. 15, 16, 17, and 18 show forest plots for random-effects meta-analysis of all Randomized Controlled Trials, RCT mortality results, RCT hospitalization results, and RCT manufacturer vs. other trials. RCT results are included in Table 1 and Table 2.
Loading..
Fig. 14. Results for RCTs and observational studies.
RCTs help to make study groups more similar and can provide a higher level of evidence, however they are subject to many biases67, and analysis of double-blind RCTs has identified extreme levels of bias68. For COVID-19, the overhead may delay treatment, dramatically compromising efficacy; they may encourage monotherapy for simplicity at the cost of efficacy which may rely on combined or synergistic effects; the participants that sign up may not reflect real world usage or the population that benefits most in terms of age, comorbidities, severity of illness, or other factors; standard of care may be compromised and unable to evolve quickly based on emerging research for new diseases; errors may be made in randomization and medication delivery; and investigators may have hidden agendas or vested interests influencing design, operation, analysis, reporting, and the potential for fraud. All of these biases have been observed with COVID-19 RCTs. There is no guarantee that a specific RCT provides a higher level of evidence.
RCTs are expensive and many RCTs are funded by pharmaceutical companies or other organizations with conflicts of interest, for example governments that previously denied treatment with the study drug. For COVID-19, this creates an incentive to show efficacy for patented commercial products, and an incentive to show a lack of efficacy for inexpensive treatments. The bias is expected to be significant, for example Als-Nielsen et al. analyzed 370 RCTs from Cochrane reviews, showing that trials funded by for-profit organizations were 5 times more likely to recommend the experimental drug compared with those funded by nonprofit organizations. Bekelman et al. and Lundh et al. show that industry-sponsored studies are more likely to be favorable. For COVID-19, some major philanthropic organizations are largely funded by investments with extreme conflicts of interest for and against specific COVID-19 interventions.
High quality RCTs for novel acute diseases are more challenging, with increased ethical issues due to the urgency of treatment, increased risk due to enrollment delays, and more difficult design with a rapidly evolving evidence base. For COVID-19, the most common site of initial infection is the upper respiratory tract. Immediate treatment is likely to be most successful and may prevent or slow progression to other parts of the body. For a non-prophylaxis RCT, it makes sense to provide treatment in advance and instruct patients to use it immediately on symptoms, just as some governments have done by providing medication kits in advance. Unfortunately, no RCTs have been done in this way. Every treatment RCT to date involves delayed treatment. Among the 227 treatments we have analyzed, 67% of RCTs involve very late treatment 5+ days after onset. No non-prophylaxis COVID-19 RCTs match the potential real-world use of early treatments. They may more accurately represent results for treatments that require visiting a medical facility, e.g., those requiring intravenous administration.
Concato et al. report a paradoxical finding—RCT results had higher variability, and only RCTs were found to sometimes report significant results the opposite of the overall result. The same trend is seen for the most popular (most politicized) COVID-19 treatments—considering all statistically significant results reported in studies, RCTs are slightly more likely to report a result in the opposite direction. In other words, for these COVID-19 treatments and for the topics covered by Concato et al., assuming causality from a single study is more likely to result in an incorrect conclusion for RCTs.
Increased risk of inconsistent results for RCTs suggests higher prevalence of bias, which may arise due to many issues including design bias, conflicts of interest, treatment differences by physicians aware of allocation, attrition bias, ascertainment bias, randomization failures, errors, or fraud.
Currently, 59 of the treatments we analyze show statistically significant efficacy or harm, defined as ≥10% decreased risk or >0% increased risk from ≥3 studies. Of these, 54% have been confirmed in RCTs, with a mean delay of 7.8 months (62% with 8.7 months delay for low-cost treatments). The remaining treatments either have no RCTs, or the point estimate is consistent.
Neither observational studies nor RCTs prove causation—any study can be flawed or fraudulent. We need much more, for example a combination of results from many independent teams, detailed understanding of each study, knowledge of conflicts/team reliability, dose-response relationships, delay-response relationships, logical results across outcomes, or details consistent with preclinical expectations.
All studies must be evaluated individually. RCTs for a given medication and disease may be more reliable, however they may also be less reliable. For off-patent medications, very high conflict of interest trials may be more likely to be RCTs, and more likely to be large trials that dominate meta-analyses.
October 2026

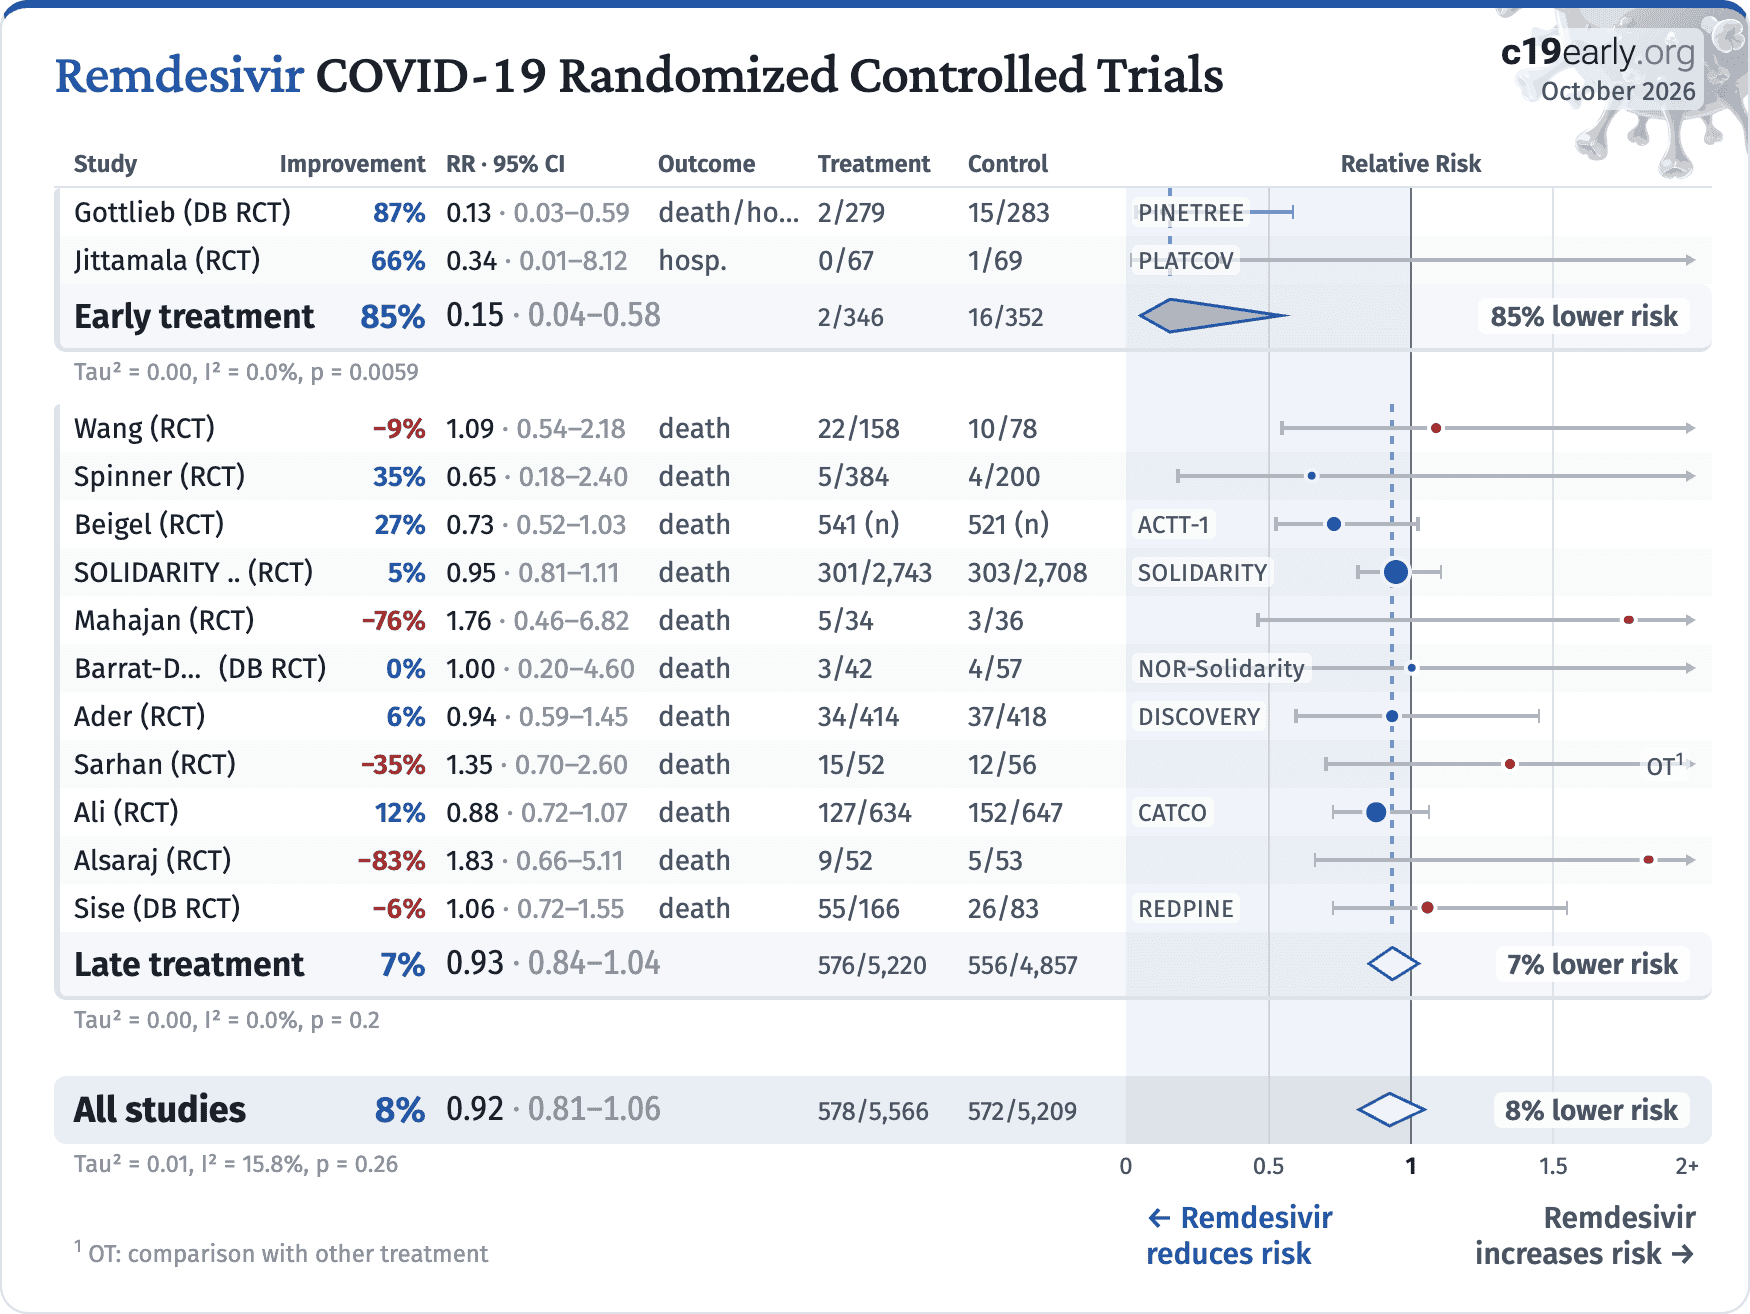
Remdesivir COVID-19 Randomized Controlled Trials

StudyImprovementRR · 95% CIOutcomeTreatmentControlRelative Risk
Early treatment85%0.15 · 0.04–0.582/34616/35285% lower risk
Tau² = 0.00, I² = 0.0%, p = 0.0059
Late treatment7%0.93 · 0.84–1.04576/5,220556/4,8577% lower risk
Tau² = 0.00, I² = 0.0%, p = 0.2
All studies8%0.92 · 0.81–1.06578/5,566572/5,2098% lower risk
Tau² = 0.01, I² = 15.8%, p = 0.2600.511.52+
1 OT: comparison with other treatment
Rotate screen for more detailsIncrease width for more details
← Remdesivir
reduces risk
Remdesivir
increases risk →
Fig. 15. Random-effects meta-analysis for all Randomized Controlled Trials. This plot shows pooled effects, see the specific outcome analyses for individual outcomes. Analysis validating pooled outcomes for COVID-19 can be found below. Effect extraction is pre-specified, using the most serious outcome reported. For details see the appendix.
October 2026

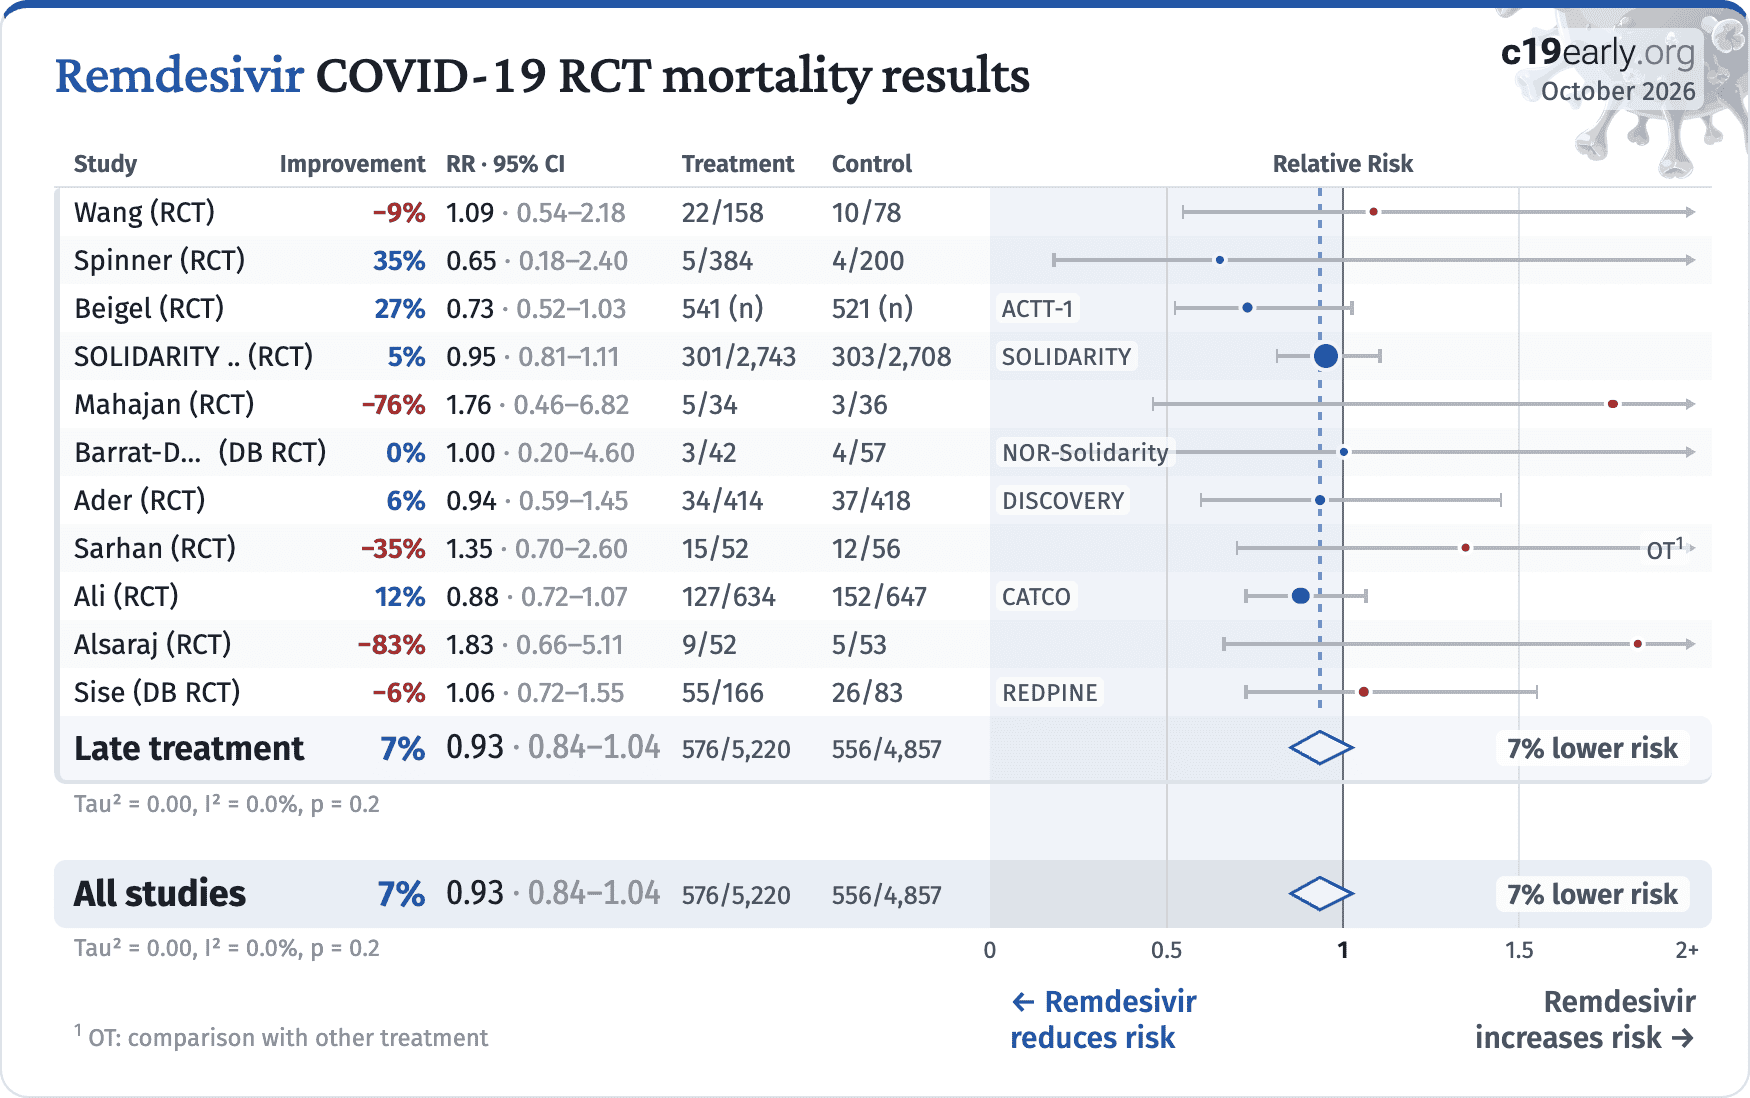
Remdesivir COVID-19 RCT mortality results

StudyImprovementRR · 95% CITreatmentControlRelative Risk
Late treatment7%0.93 · 0.84–1.04576/5,220556/4,8577% lower risk
Tau² = 0.00, I² = 0.0%, p = 0.2
All studies7%0.93 · 0.84–1.04576/5,220556/4,8577% lower risk
Tau² = 0.00, I² = 0.0%, p = 0.200.511.52+
1 OT: comparison with other treatment
Rotate screen for more detailsIncrease width for more details
← Remdesivir
reduces risk
Remdesivir
increases risk →
Fig. 16. Random-effects meta-analysis for RCT mortality results.
October 2026

Remdesivir COVID-19 RCT hospitalization results

StudyImprovementRR · 95% CIOutcomeTreatmentControlRelative Risk
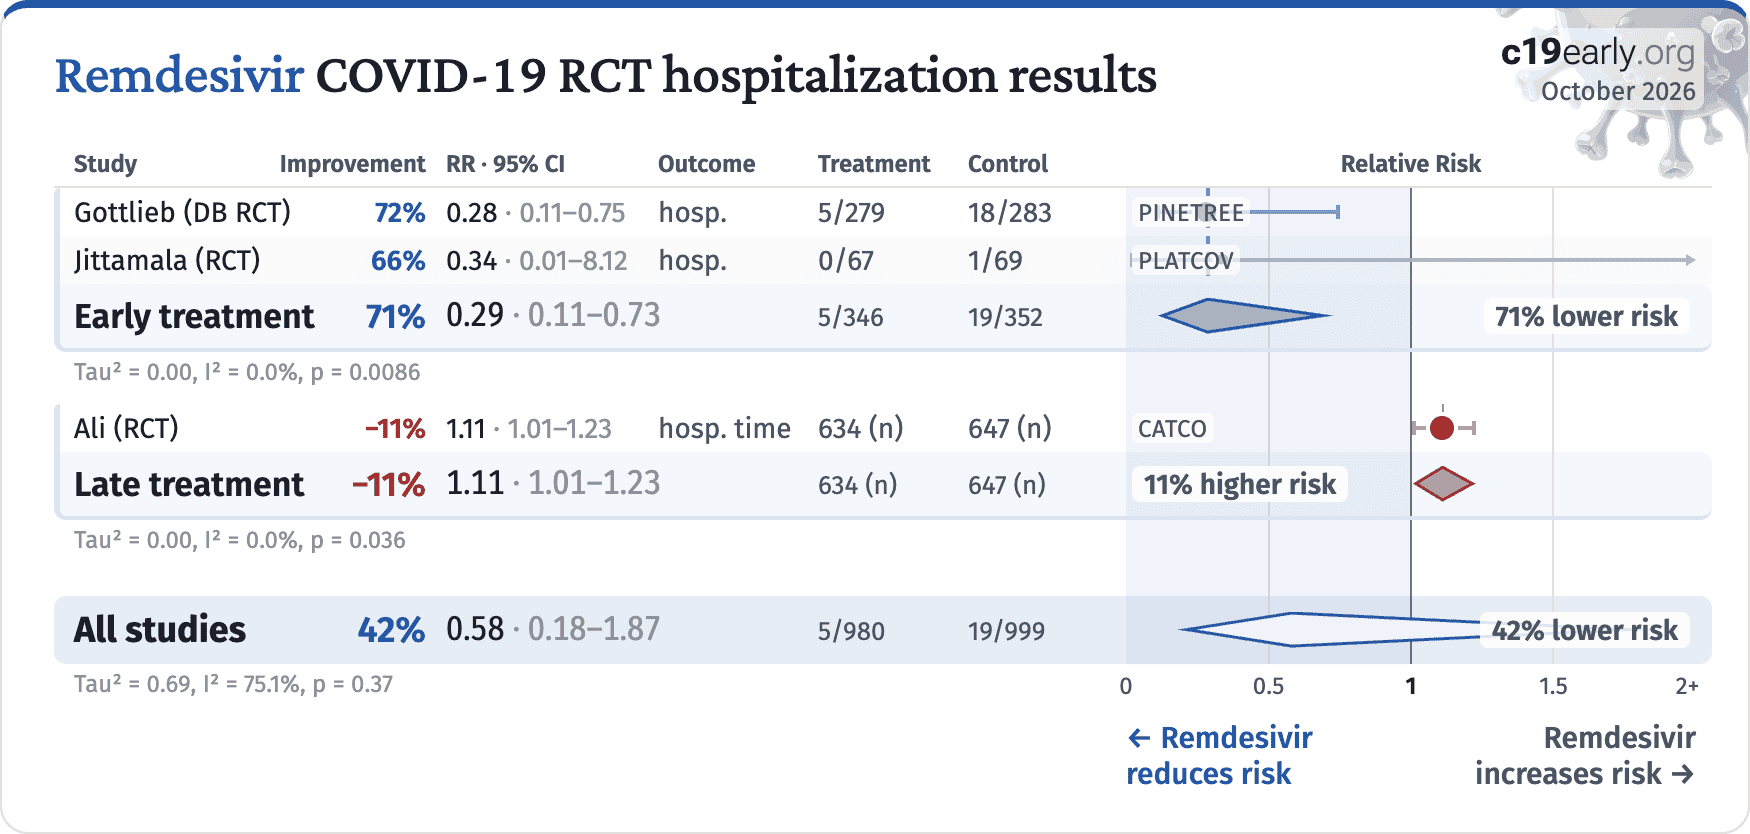
Early treatment71%0.29 · 0.11–0.735/34619/35271% lower risk
Tau² = 0.00, I² = 0.0%, p = 0.0086
Late treatment−11%1.11 · 1.01–1.23634 (n)647 (n)11% higher risk
Tau² = 0.00, I² = 0.0%, p = 0.036
All studies42%0.58 · 0.18–1.875/98019/99942% lower risk
Tau² = 0.69, I² = 75.1%, p = 0.3700.511.52+
Rotate screen for more detailsIncrease width for more details
← Remdesivir
reduces risk
Remdesivir
increases risk →
Fig. 17. Random-effects meta-analysis for RCT hospitalization results.
October 2026

Remdesivir COVID-19 manufacturer vs. other RCTs

StudyImprovementRR · 95% CIOutcomeTreatmentControlRelative Risk
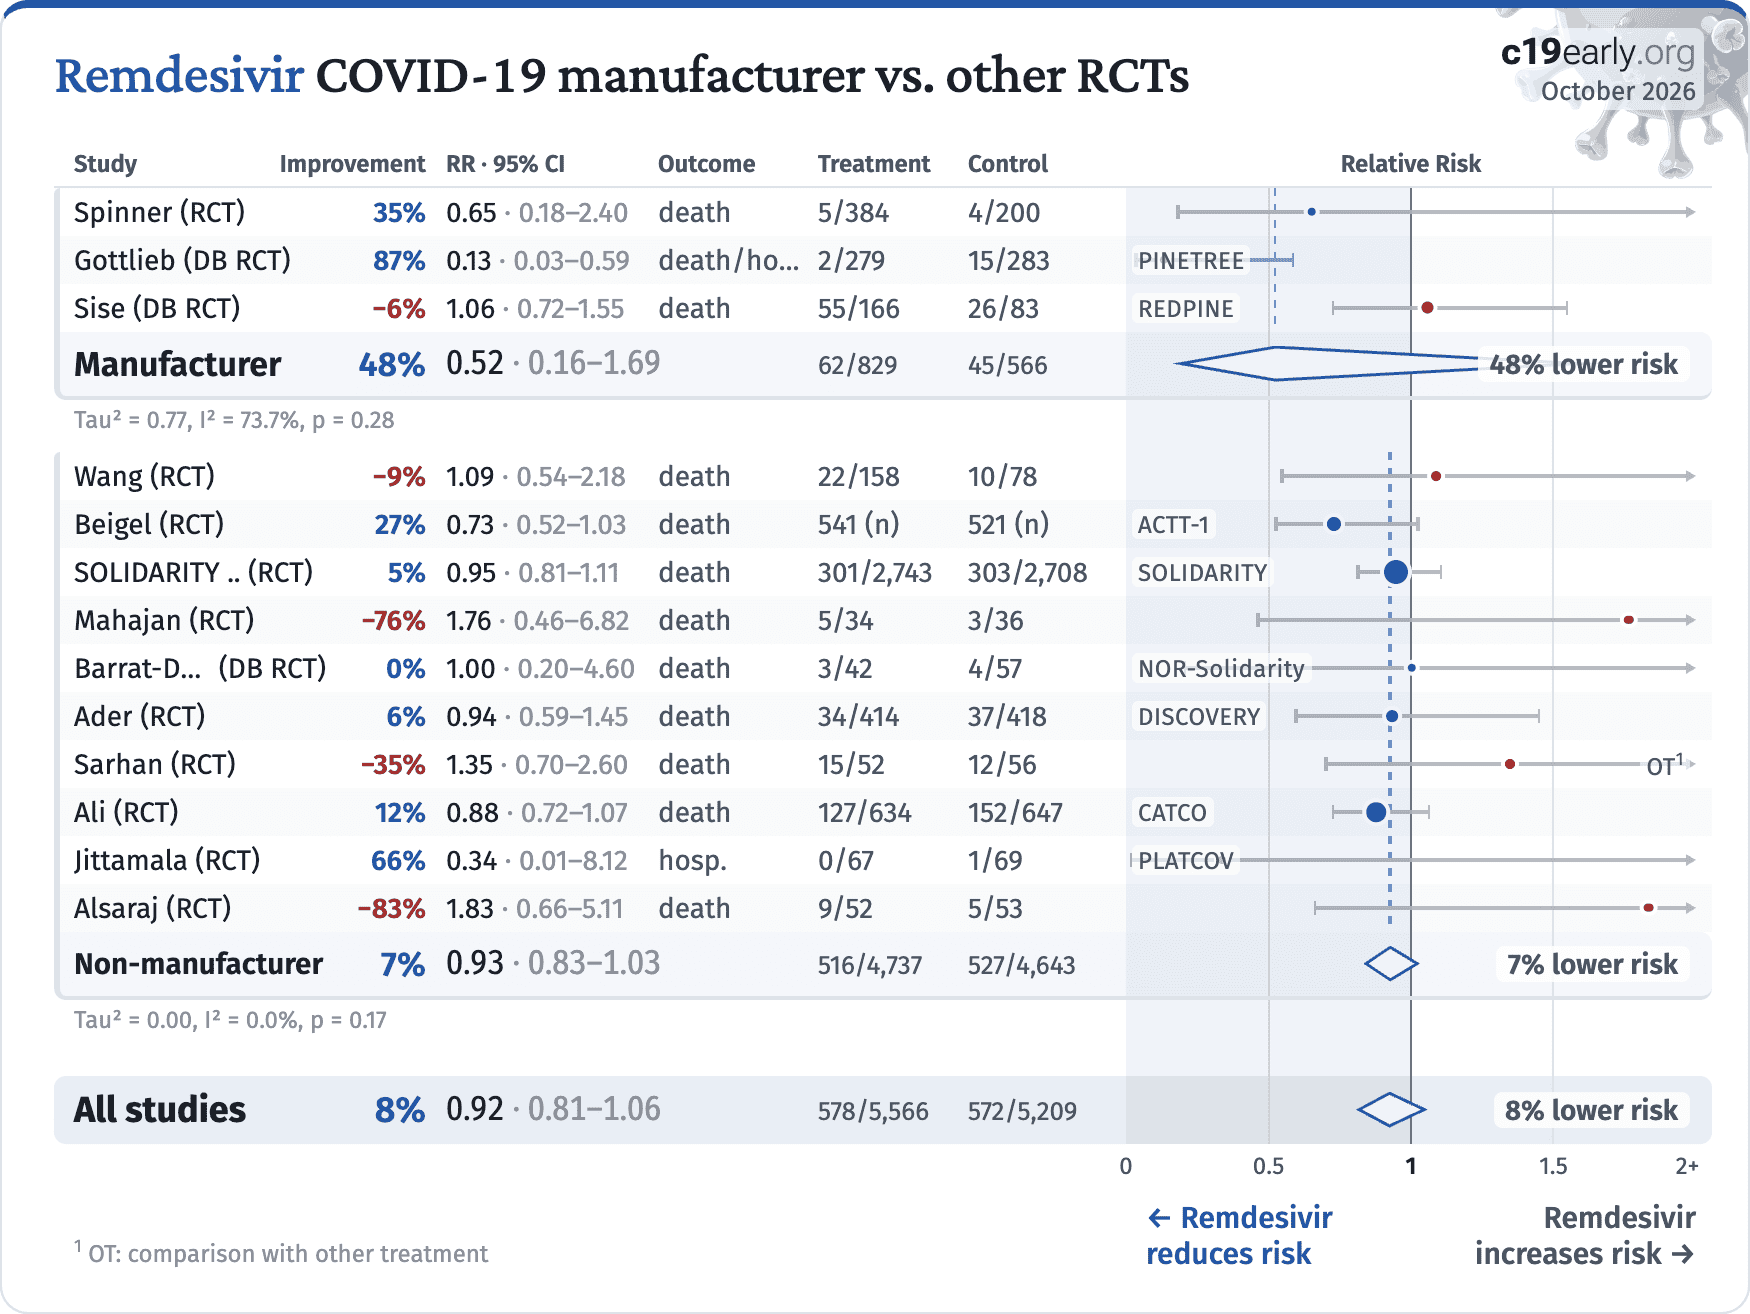
Manufacturer48%0.52 · 0.16–1.6962/82945/56648% lower risk
Tau² = 0.77, I² = 73.7%, p = 0.28
Non-manufacturer7%0.93 · 0.83–1.03516/4,737527/4,6437% lower risk
Tau² = 0.00, I² = 0.0%, p = 0.17
All studies8%0.92 · 0.81–1.06578/5,566572/5,2098% lower risk
00.511.52+
1 OT: comparison with other treatment
Rotate screen for more detailsIncrease width for more details
← Remdesivir
reduces risk
Remdesivir
increases risk →
Fig. 18. Random-effects meta-analysis for RCT manufacturer vs. other trials.
1 remdesivir RCT has not reported results24. The trial reports report an estimated total of 2,200 patients. The result is delayed over 9 months.
To avoid bias in the selection of studies, we analyze all non-retracted studies. Here we show the results after excluding studies with major issues likely to alter results, non-standard studies, and studies where very minimal detail is currently available. Our bias evaluation is based on analysis of each study and identifying when there is a significant chance that limitations will substantially change the outcome of the study. We believe this can be more valuable than checklist-based approaches such as Cochrane GRADE, which can be easily influenced by potential bias, may ignore or underemphasize serious issues not captured in the checklists, and may overemphasize issues unlikely to alter outcomes in specific cases (for example certain specifics of randomization with a very large effect size and well-matched baseline characteristics).
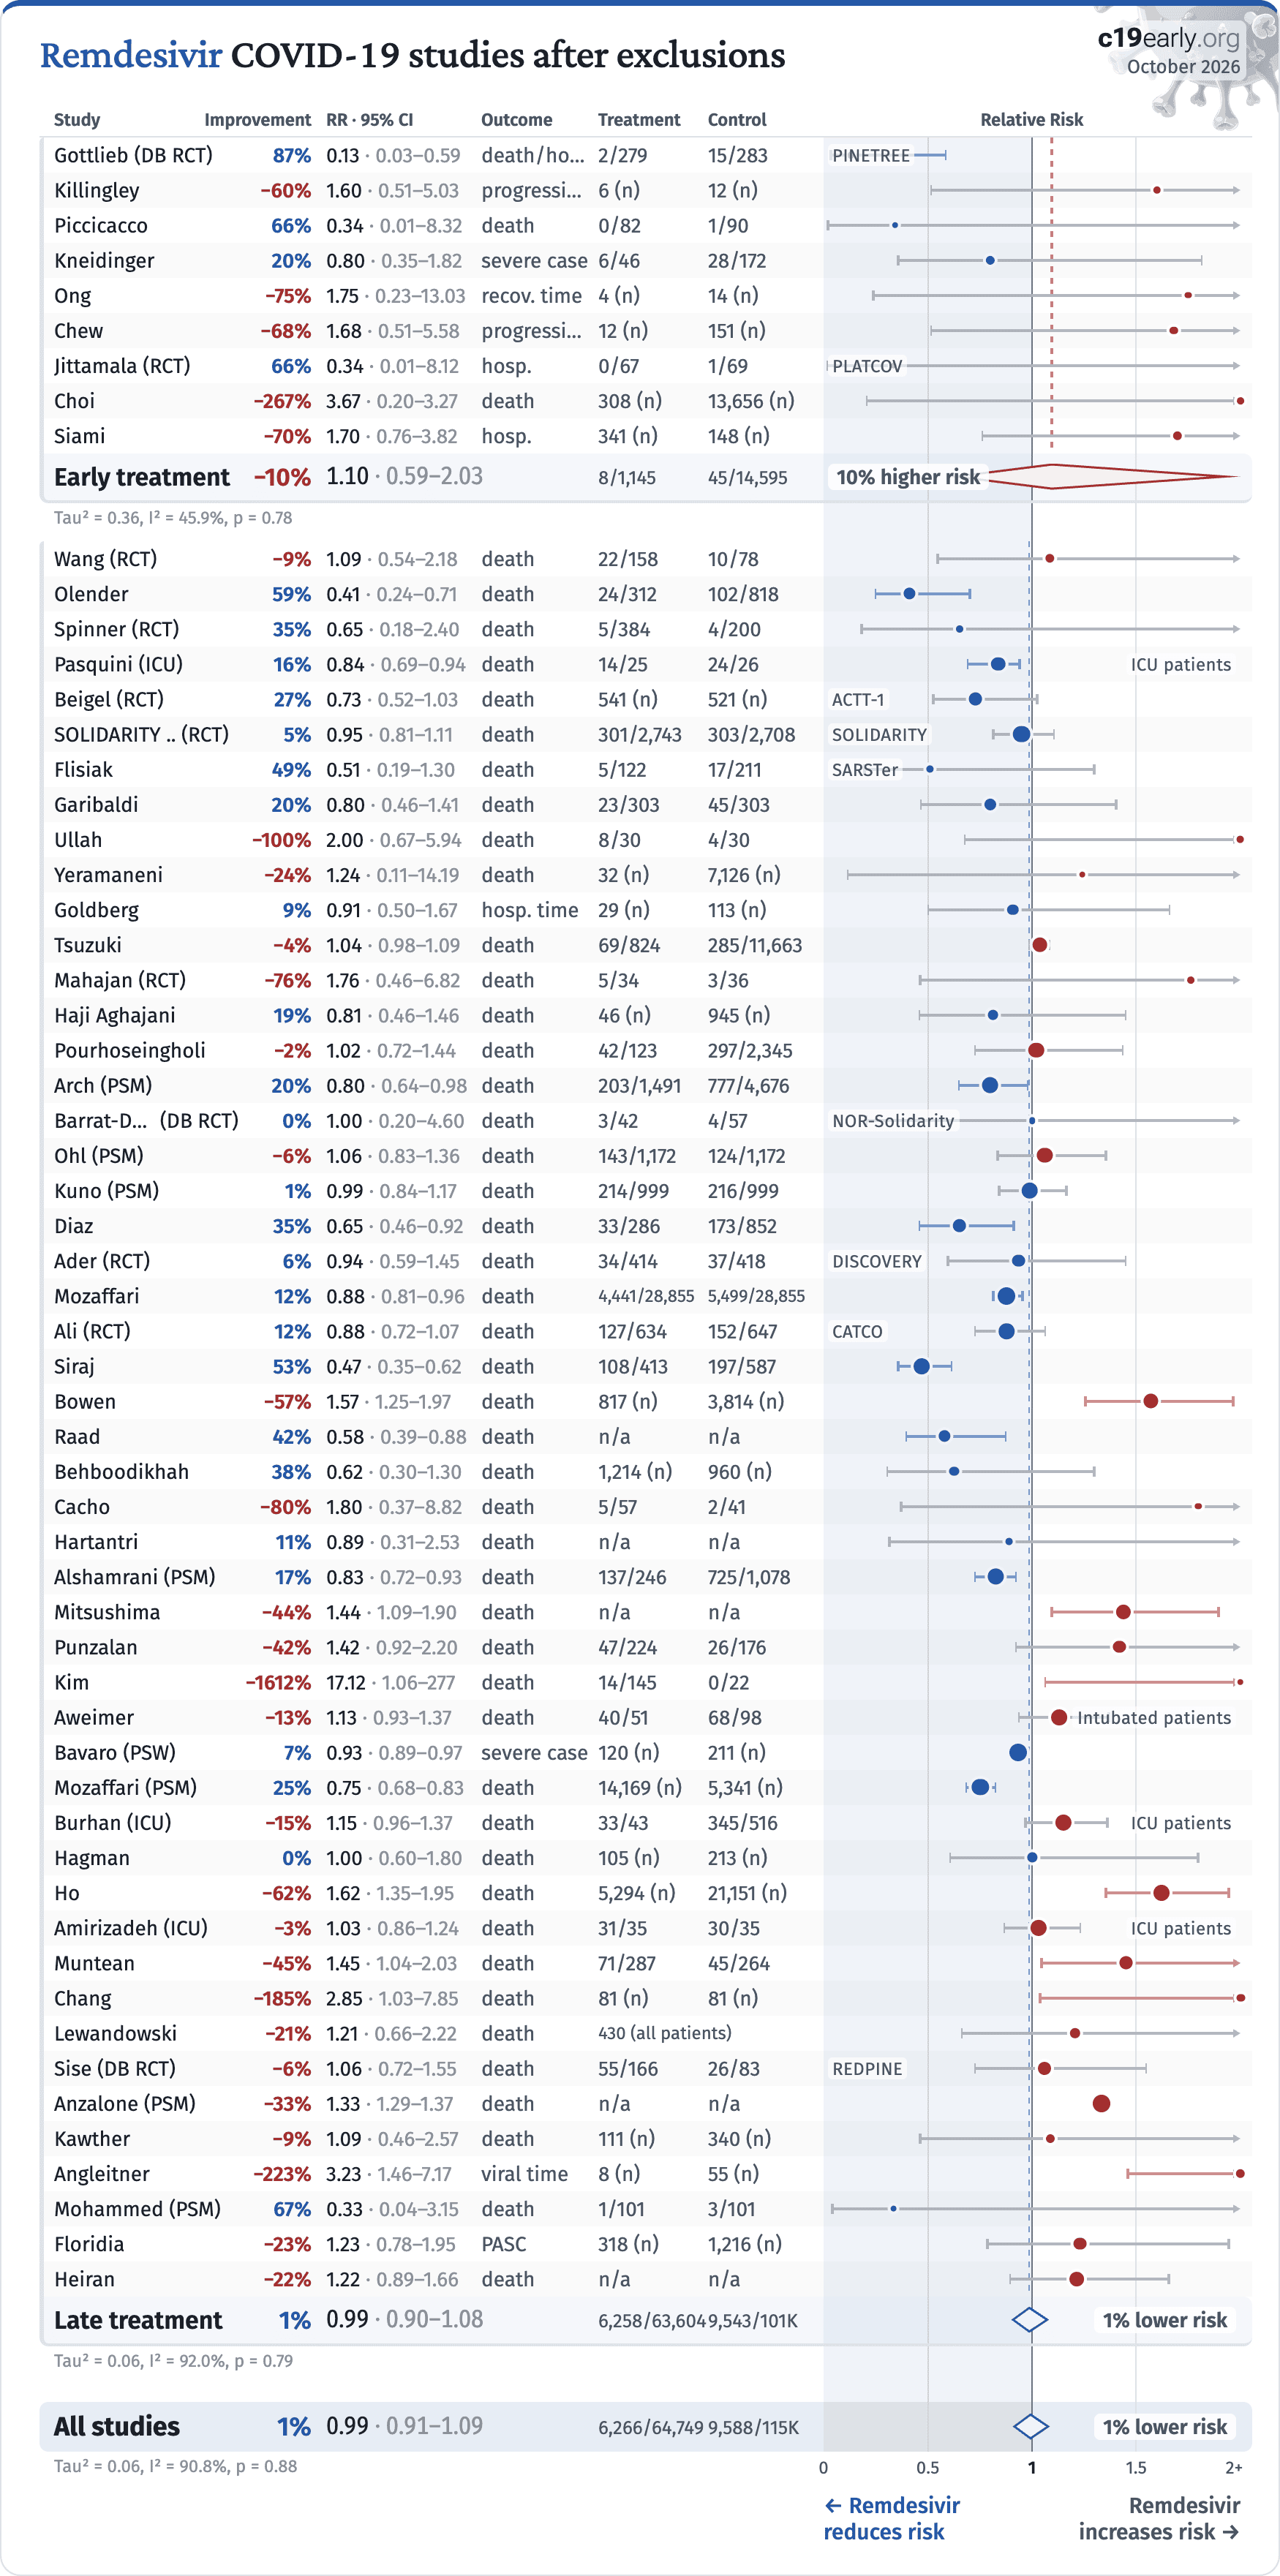
The studies excluded are as below. Fig. 19 shows a forest plot for random-effects meta-analysis of all studies after exclusions.
Alsaraj, potential data issue.
Arfijanto, unadjusted results with no group details.
Drouin, substantial unadjusted confounding by indication likely.
El-Solh, very late stage, >50% on oxygen/ventilation at baseline; substantial unadjusted confounding by indication likely; significant confounding by contraindications possible.
Elavarasi, unadjusted results with no group details; substantial unadjusted confounding by indication likely.
Elec, substantial confounding by time possible due to significant changes in SOC and treatment propensity during the study period.
Elhadi, unadjusted results with no group details.
Fried, excessive unadjusted differences between groups; substantial unadjusted confounding by indication likely.
Kurniyanto, unadjusted results with no group details; substantial unadjusted confounding by indication likely.
Liao, unadjusted results with no group details.
Malundo, unadjusted results with no group details.
Milan, unadjusted results with no group details.
Mulhem, substantial unadjusted confounding by indication likely; substantial confounding by time possible due to significant changes in SOC and treatment propensity during the study period.
Mustafa, unadjusted results with no group details.
Nadeem, unadjusted results with no group details.
Oku, unadjusted results with no group details.
Salehi, unadjusted results with no group details.
Sarhan, very late stage, >50% on oxygen/ventilation at baseline; significant unadjusted differences between groups.
Schmidt, confounding by indication is likely and adjustments do not consider COVID-19 severity at baseline.
Seah, unadjusted results with significant baseline differences.
Shamsi, unadjusted results with no group details.
Sokolski, unadjusted results with no group details.
October 2026

Remdesivir COVID-19 studies after exclusions

StudyImprovementRR · 95% CIOutcomeTreatmentControlRelative Risk
Early treatment−10%1.10 · 0.59–2.038/1,14545/14,59510% higher risk
Tau² = 0.36, I² = 45.9%, p = 0.78
Wang (RCT)−9%1.09 · 0.54–2.18death22/15810/78 Olender59%0.41 · 0.24–0.71death24/312102/818 Spinner (RCT)35%0.65 · 0.18–2.40death5/3844/200 Pasquini (ICU)16%0.84 · 0.69–0.94death14/2524/26ICU patients Beigel (RCT)27%0.73 · 0.52–1.03death541 (n)521 (n)ACTT-1 SOLIDARITY .. (RCT)5%0.95 · 0.81–1.11death301/2,743303/2,708SOLIDARITY Flisiak49%0.51 · 0.19–1.30death5/12217/211SARSTer Garibaldi20%0.80 · 0.46–1.41death23/30345/303 Ullah−100%2.00 · 0.67–5.94death8/304/30 Yeramaneni−24%1.24 · 0.11–14.19death32 (n)7,126 (n) Goldberg9%0.91 · 0.50–1.67hosp. time29 (n)113 (n) Tsuzuki−4%1.04 · 0.98–1.09death69/824285/11,663 Mahajan (RCT)−76%1.76 · 0.46–6.82death5/343/36 Haji Aghajani19%0.81 · 0.46–1.46death46 (n)945 (n) Pourhoseingholi−2%1.02 · 0.72–1.44death42/123297/2,345 Arch (PSM)20%0.80 · 0.64–0.98death203/1,491777/4,676 Barrat-Due (DB RCT)0%1.00 · 0.20–4.60death3/424/57NOR-Solidarity Ohl (PSM)−6%1.06 · 0.83–1.36death143/1,172124/1,172 Kuno (PSM)1%0.99 · 0.84–1.17death214/999216/999 Diaz35%0.65 · 0.46–0.92death33/286173/852 Ader (RCT)6%0.94 · 0.59–1.45death34/41437/418DISCOVERY Mozaffari12%0.88 · 0.81–0.96death4,441/28,8555,499/28,855 Ali (RCT)12%0.88 · 0.72–1.07death127/634152/647CATCO Siraj53%0.47 · 0.35–0.62death108/413197/587 Bowen−57%1.57 · 1.25–1.97death817 (n)3,814 (n) Raad42%0.58 · 0.39–0.88deathn/an/a Behboodikhah38%0.62 · 0.30–1.30death1,214 (n)960 (n) Cacho−80%1.80 · 0.37–8.82death5/572/41 Hartantri11%0.89 · 0.31–2.53deathn/an/a Alshamrani (PSM)17%0.83 · 0.72–0.93death137/246725/1,078 Mitsushima−44%1.44 · 1.09–1.90deathn/an/a Punzalan−42%1.42 · 0.92–2.20death47/22426/176 Kim−1612%17.12 · 1.06–277death14/1450/22 Aweimer−13%1.13 · 0.93–1.37death40/5168/98Intubated patients Bavaro (PSW)7%0.93 · 0.89–0.97severe case120 (n)211 (n) Mozaffari (PSM)25%0.75 · 0.68–0.83death14,169 (n)5,341 (n) Burhan (ICU)−15%1.15 · 0.96–1.37death33/43345/516ICU patients Hagman0%1.00 · 0.60–1.80death105 (n)213 (n) Ho−62%1.62 · 1.35–1.95death5,294 (n)21,151 (n) Amirizadeh (ICU)−3%1.03 · 0.86–1.24death31/3530/35ICU patients Muntean−45%1.45 · 1.04–2.03death71/28745/264 Chang−185%2.85 · 1.03–7.85death81 (n)81 (n) Lewandowski−21%1.21 · 0.66–2.22death430 (all patients) Sise (DB RCT)−6%1.06 · 0.72–1.55death55/16626/83REDPINE Anzalone (PSM)−33%1.33 · 1.29–1.37deathn/an/a Kawther−9%1.09 · 0.46–2.57death111 (n)340 (n) Angleitner−223%3.23 · 1.46–7.17viral time8 (n)55 (n) Mohammed (PSM)67%0.33 · 0.04–3.15death1/1013/101 Floridia−23%1.23 · 0.78–1.95PASC318 (n)1,216 (n) Heiran−22%1.22 · 0.89–1.66deathn/an/a
Late treatment1%0.99 · 0.90–1.086,258/63,6049,543/101K1% lower risk
Tau² = 0.06, I² = 92.0%, p = 0.79
All studies1%0.99 · 0.91–1.096,266/64,7499,588/115K1% lower risk
Tau² = 0.06, I² = 90.8%, p = 0.8800.511.52+
Rotate screen for more detailsIncrease width for more details
← Remdesivir
reduces risk
Remdesivir
increases risk →
Fig. 19. Random-effects meta-analysis for all studies after exclusions. This plot shows pooled effects, see the specific outcome analyses for individual outcomes. Analysis validating pooled outcomes for COVID-19 can be found below. Effect extraction is pre-specified, using the most serious outcome reported. For details see the appendix.
Low-cost treatments were subject to bias and censorship during the pandemic. Scientific bias is seen in the design, analysis, presentation, and selective reporting of studies, which favored negative results. A similar bias is seen in the media coverage for low-cost treatments. However, the opposite is seen for high-profit treatments.
We analyze media coverage for the 227 treatments we cover using Altmetric95 and PlumX Metrics96. Altmetric covers ~14,000 news outlets97 and PlumX covers ~55,000 news sources98. The two services are complementary with coverage of different news sources and different methods for identifying articles not containing a DOI. We consider studies to have received significant media coverage if they were covered by at least 100 articles in either Altmetric of PlumX98,99. The most widespread study was covered by 1,047 outlets. Studies covered by major syndicated sources shows hundreds of news articles, while studies covered by few outlets typically appear in niche medical news sources or press releases. Fig. 20 and 21 show bias towards positive results for high-profit treatments, in contrast to the opposite bias for low-cost treatments.
Fig. 22 shows bias towards coverage of positive results for remdesivir.
The media bias may result in widespread incorrect perceptions on the relative efficacy of high-profit and low-cost treatments. The impact is significant—increased cost limits the use of high-profit treatments and treatment equity. High-profit treatments were also more difficult to access, especially for earlier treatment which improves efficacy and minimizes community transmission.
October 2026

Media coverage of high-profit COVID‑19 treatments

Media was 3.8× more likely to cover positive studies

19 positive studies were covered

11%

Only 6 negative studies were covered

3%
3.8×
Positive bias for high-profit treatments
positive studies were 3.8 times more likely to be covered
Fig. 20. For high-profit treatments, mainstream media coverage was biased towards positive results. When restricting to RCTs, the bias was even larger, with positive RCTs 12.0× more likely to be covered.
October 2026

Media coverage of low-cost COVID‑19 treatments

Media covered only 0.8% of studies showing significantly lower COVID-19 risk

Only 5 positive studies were covered

0.8%

34 negative studies were covered

4%
5.4×
Negative bias for low-cost treatments
negative studies were 5.4 times more likely to be covered
Fig. 21. For low-cost treatments, mainstream media coverage was biased against positive results. When restricting to RCTs, the bias was even larger, with negative RCTs 6.9× more likely to be covered.
October 2026

Media coverage of remdesivir for COVID‑19

Media covered only 5% of negative studies

3 positive remdesivir studies were covered

14%

Only 3 negative studies were covered

5%
2.9×
Positive bias
positive studies were 2.9 times more likely to be covered
Fig. 22. Mainstream media coverage was biased towards positive results for remdesivir.
A combination of factors may have led to the very low media coverage of low-cost treatments:
•
Politicization
led to a media environment where coverage was often framed to support a political narrative rather than to provide objective scientific information. As Scott Alexander said:
"if you say anything in favor of ivermectin you will be cast out of civilization and thrown into the circle of social hell reserved for Klan members and 1/6 insurrectionists. All the health officials in the world will shout 'horse dewormer!' at you and compare you to Josef Mengele."
There was strong social pressure to discredit low-cost treatments.
•
Censorship
of information conflicting with selected authorities. For example, individuals and organizations presenting conflicting science were often shadowbanned or completely banned on Twitter and YouTube if the science they were reporting conflicted with the opinions of specific authorities selected by those companies, including when the authorities had not even reviewed the scientific results in question.
•
FDA requires "no adequate, approved, and available alternatives"
in order to grant an EUA for novel high-profit interventions, creating an incentive for authorities to ignore or downplay existing low-cost treatments.
•
Regulatory capture
biases authorities towards high-profit interventions.
•
Authorities ignored most evidence for low-cost treatments
, for example the NIH references only 2% of studies in delayed, rarely-updated, biased commentaries with no quantitive analysis.
•
Media coverage of science is often not very accurate
, e.g., misunderstanding confounding issues. For example the media widely considered the RECOVERY HCQ RCT to be conclusive on efficacy, but very late treatment of late-stage patients (mostly on oxygen already) with an excessive toxic dose (shown dangerous in a dose comparison RCT) provides no information on the recommended early/prophylactic treatment. With difficulting in understanding basic confounders like treatment delay and dose, the media may favor deferring to authorities. Many studies for low-cost treatments require greater expertise to analyze.
•
Substantial funding from pharmaceutical advertising
biases editorial decisions towards high-profit interventions.
•
PR power
- companies/teams with strong PR presence are favored in the media, which correlates with high-profit and high conflict of interest studies.
•
The media was very negative in general
, inflating risk, and elevating fear and anxiety. A negative bias may improve ratings and revenue, increasing motivation to continue watching coverage.
Heterogeneity in COVID-19 studies arises from many factors including:
The time between infection or the onset of symptoms and treatment may critically affect how well a treatment works. For example an antiviral may be very effective when used early but may not be effective in late stage disease, and may even be harmful. Oseltamivir, for example, is generally only considered effective for influenza when used within 0-36 or 0-48 hours100,101. Baloxavir marboxil studies for influenza also show that treatment delay is critical — Ikematsu et al. report an 86% reduction in cases for post-exposure prophylaxis, Hayden et al. show a 33 hour reduction in the time to alleviation of symptoms for treatment within 24 hours and a reduction of 13 hours for treatment within 24-48 hours, and Kumar et al. report only 2.5 hours improvement for inpatient treatment.
Table 3. Studies of baloxavir marboxil for influenza show that early treatment is more effective.
Treatment delayResult
Post-exposure prophylaxis86% fewer cases102
<24 hours-33 hours symptoms103
24-48 hours-13 hours symptoms103
Inpatients-2.5 hours to improvement104
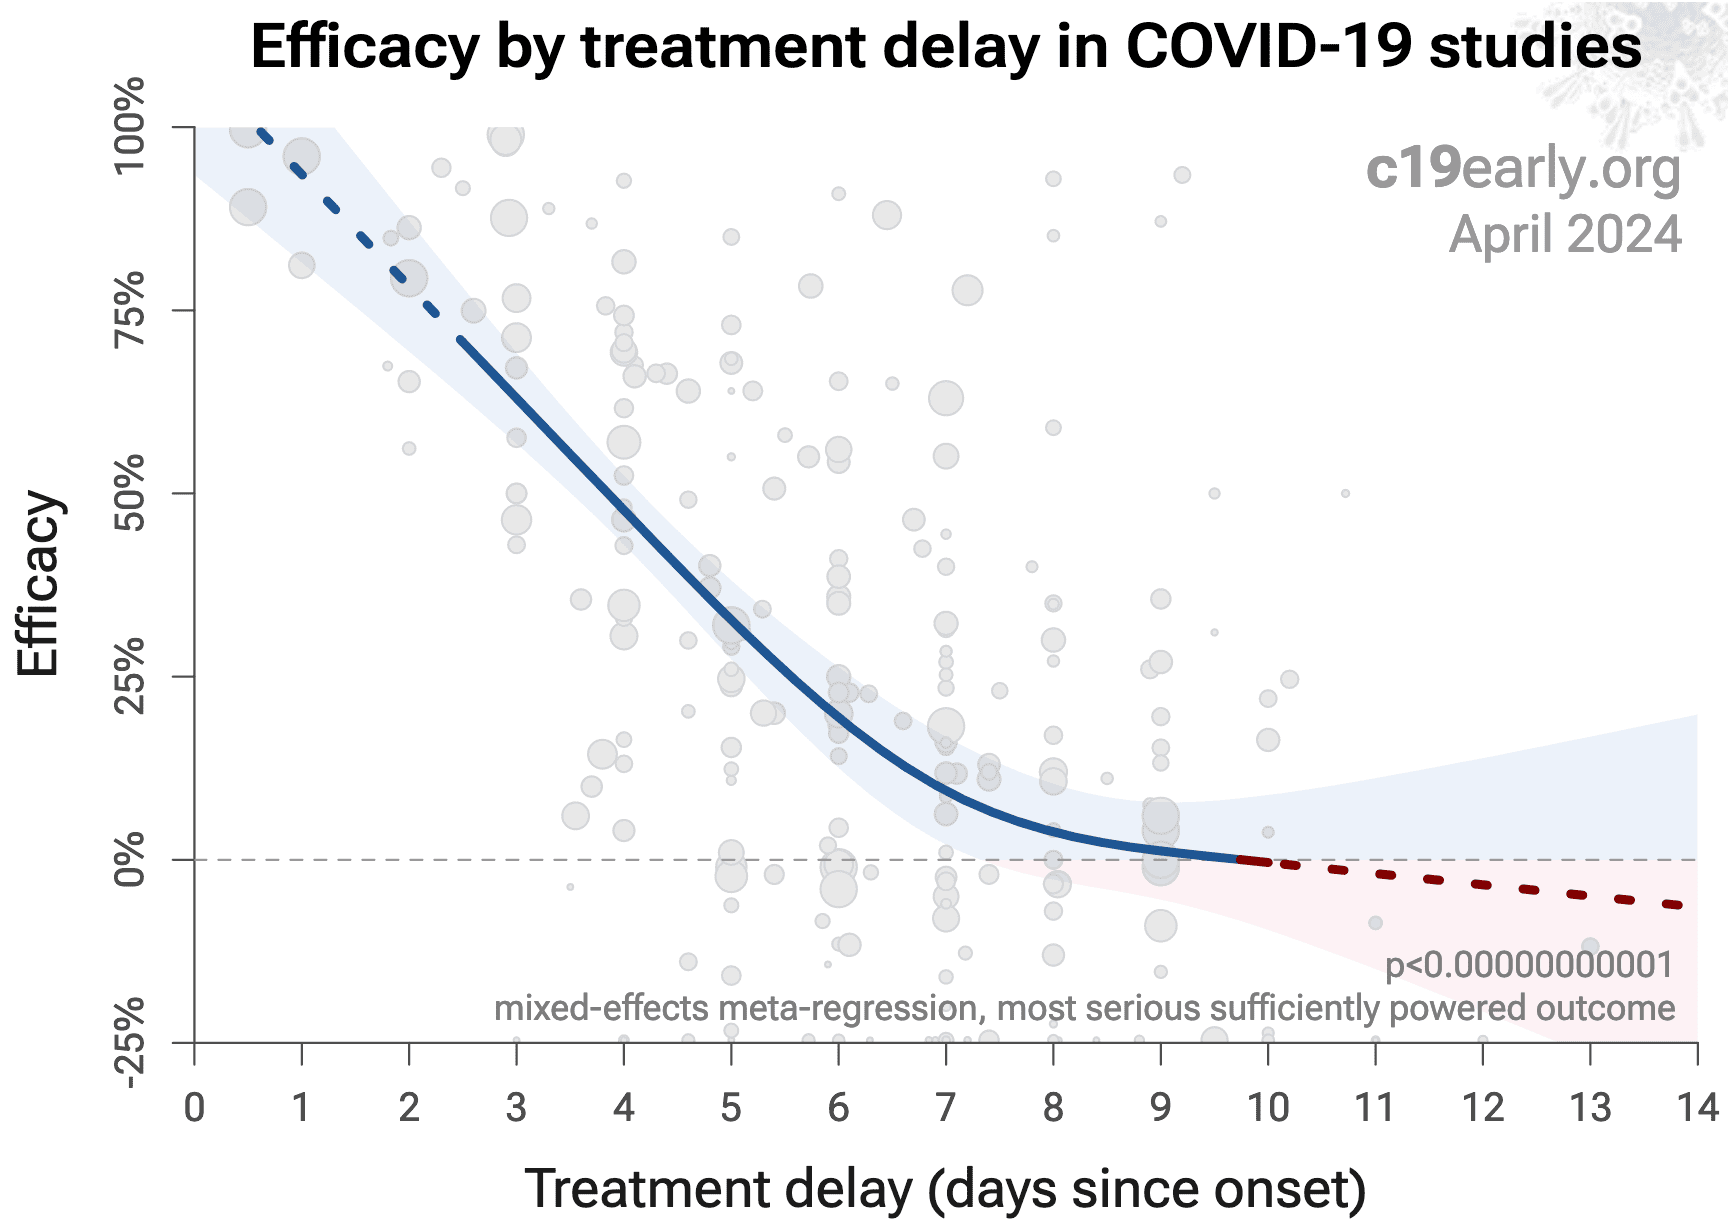
Fig. 23 shows a mixed-effects meta-regression for efficacy as a function of treatment delay in COVID-19 studies from 227 treatments, showing that efficacy declines rapidly with treatment delay. Early treatment is critical for COVID-19.
Loading..
Fig. 23. Early treatment is more effective. Meta-regression showing efficacy as a function of treatment delay in COVID-19 studies from 227 treatments.
Details of the patient population including age and comorbidities may critically affect how well a treatment works. For example, many COVID-19 studies with relatively young low-comorbidity patients show all patients recovering quickly with or without treatment. In such cases, there is little room for an effective treatment to improve results, for example as in López-Medina et al.
Efficacy may depend critically on the distribution of SARS-CoV-2 variants encountered by patients. Risk varies significantly across variants106, for example the Gamma variant shows significantly different characteristics107-110. Different mechanisms of action may be more or less effective depending on variants, for example the degree to which TMPRSS2 contributes to viral entry can differ across variants111,112.
Effectiveness may depend strongly on the dosage and treatment regimen.
The quality of medications may vary significantly between manufacturers and production batches, which may significantly affect efficacy and safety. Williams et al. analyze ivermectin from 11 different sources, showing highly variable antiparasitic efficacy across different manufacturers. Xu et al. analyze a treatment from two different manufacturers, showing 9 different impurities, with significantly different concentrations for each manufacturer.
The use of other treatments may significantly affect outcomes, including supplements, other medications, or other interventions such as prone positioning. Treatments may be synergistic115-139, therefore efficacy may depend strongly on combined treatments.
Across all studies there is a strong association between different outcomes, for example improved recovery is strongly associated with lower mortality. However, efficacy may differ depending on the effect measured, for example a treatment may be more effective against secondary complications and have minimal effect on viral clearance.
The distribution of studies will alter the outcome of a meta-analysis. Consider a simplified example where everything is equal except for the treatment delay, and effectiveness decreases to zero or below with increasing delay. If there are many studies using very late treatment, the outcome may be negative, even though early treatment is very effective. All meta-analyses combine heterogeneous studies, varying in population, variants, and potentially all factors above, and therefore may obscure efficacy by including studies where treatment is less effective. Generally, we expect the estimated effect size from meta-analysis to be less than that for the optimal case. Looking at all studies is valuable for providing an overview of all research, important to avoid cherry-picking, and informative when a positive result is found despite combining less-optimal situations. However, the resulting estimate does not apply to specific cases such as early treatment in high-risk populations. While we present results for all studies, we also present treatment time and individual outcome analyses, which may be more informative for specific use cases.
For COVID-19, delay in clinical results translates into additional death and morbidity, as well as additional economic and societal damage. Combining the results of studies reporting different outcomes is required. There may be no mortality in a trial with low-risk patients, however a reduction in severity or improved viral clearance may translate into lower mortality in a high-risk population. Different studies may report lower severity, improved recovery, and lower mortality, and the significance may be very high when combining the results. "The studies reported different outcomes" is not a good reason for disregarding results. Pooling the results of studies reporting different outcomes allows us to use more of the available information. Logically we should, and do, use additional information when evaluating treatments—for example dose-response and treatment delay-response relationships provide additional evidence of efficacy that is considered when reviewing the evidence for a treatment.
We present both specific outcome and pooled analyses. In order to combine the results of studies reporting different outcomes we use the most serious outcome reported in each study, based on the thesis that improvement in the most serious outcome provides comparable measures of efficacy for a treatment. A critical advantage of this approach is simplicity and transparency. There are many other ways to combine evidence for different outcomes, along with additional evidence such as dose-response relationships, however these increase complexity.
Trials with high-risk patients may be restricted due to ethics for treatments that are known or expected to be effective, and they increase difficulty for recruiting. Using less severe outcomes as a proxy for more serious outcomes allows faster and safer collection of evidence.
For many COVID-19 treatments, a reduction in mortality logically follows from a reduction in hospitalization, which follows from a reduction in symptomatic cases, which follows from a reduction in PCR positivity. We can directly test this for COVID-19.
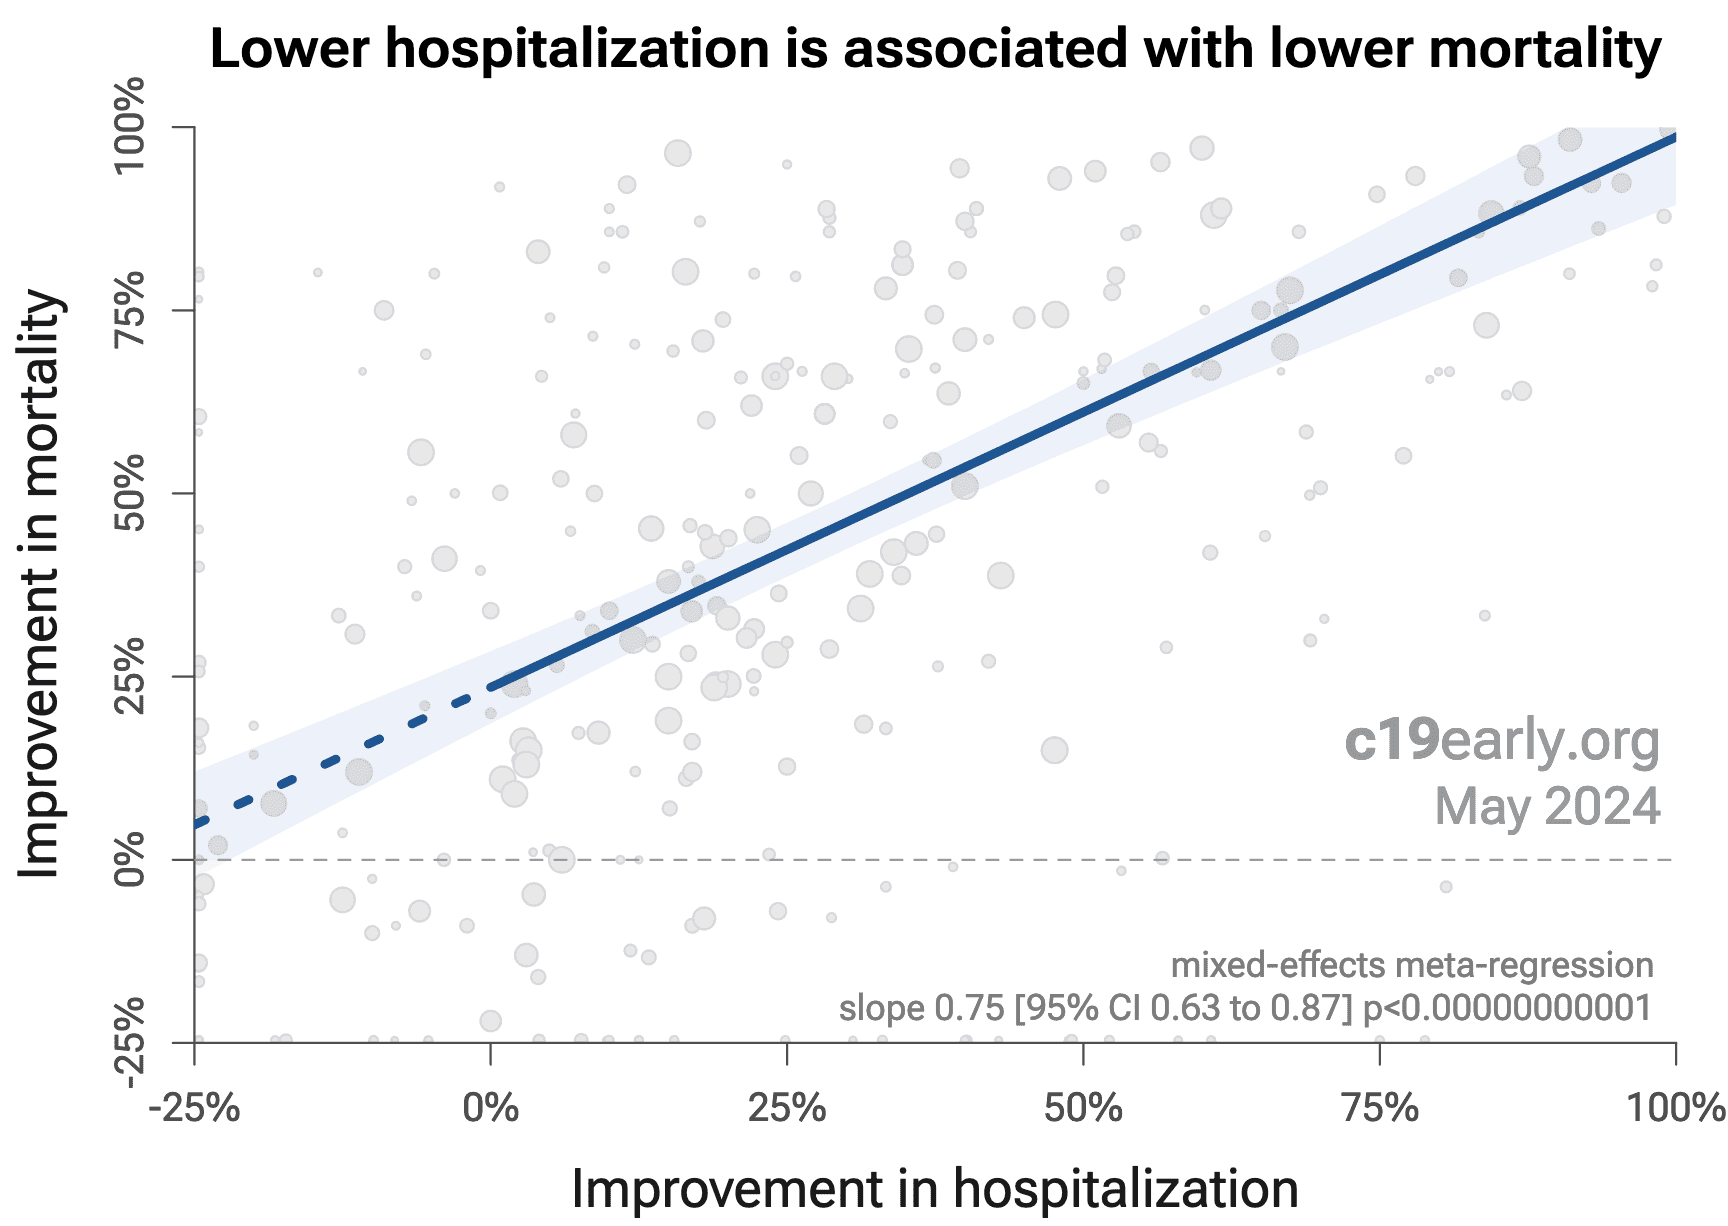
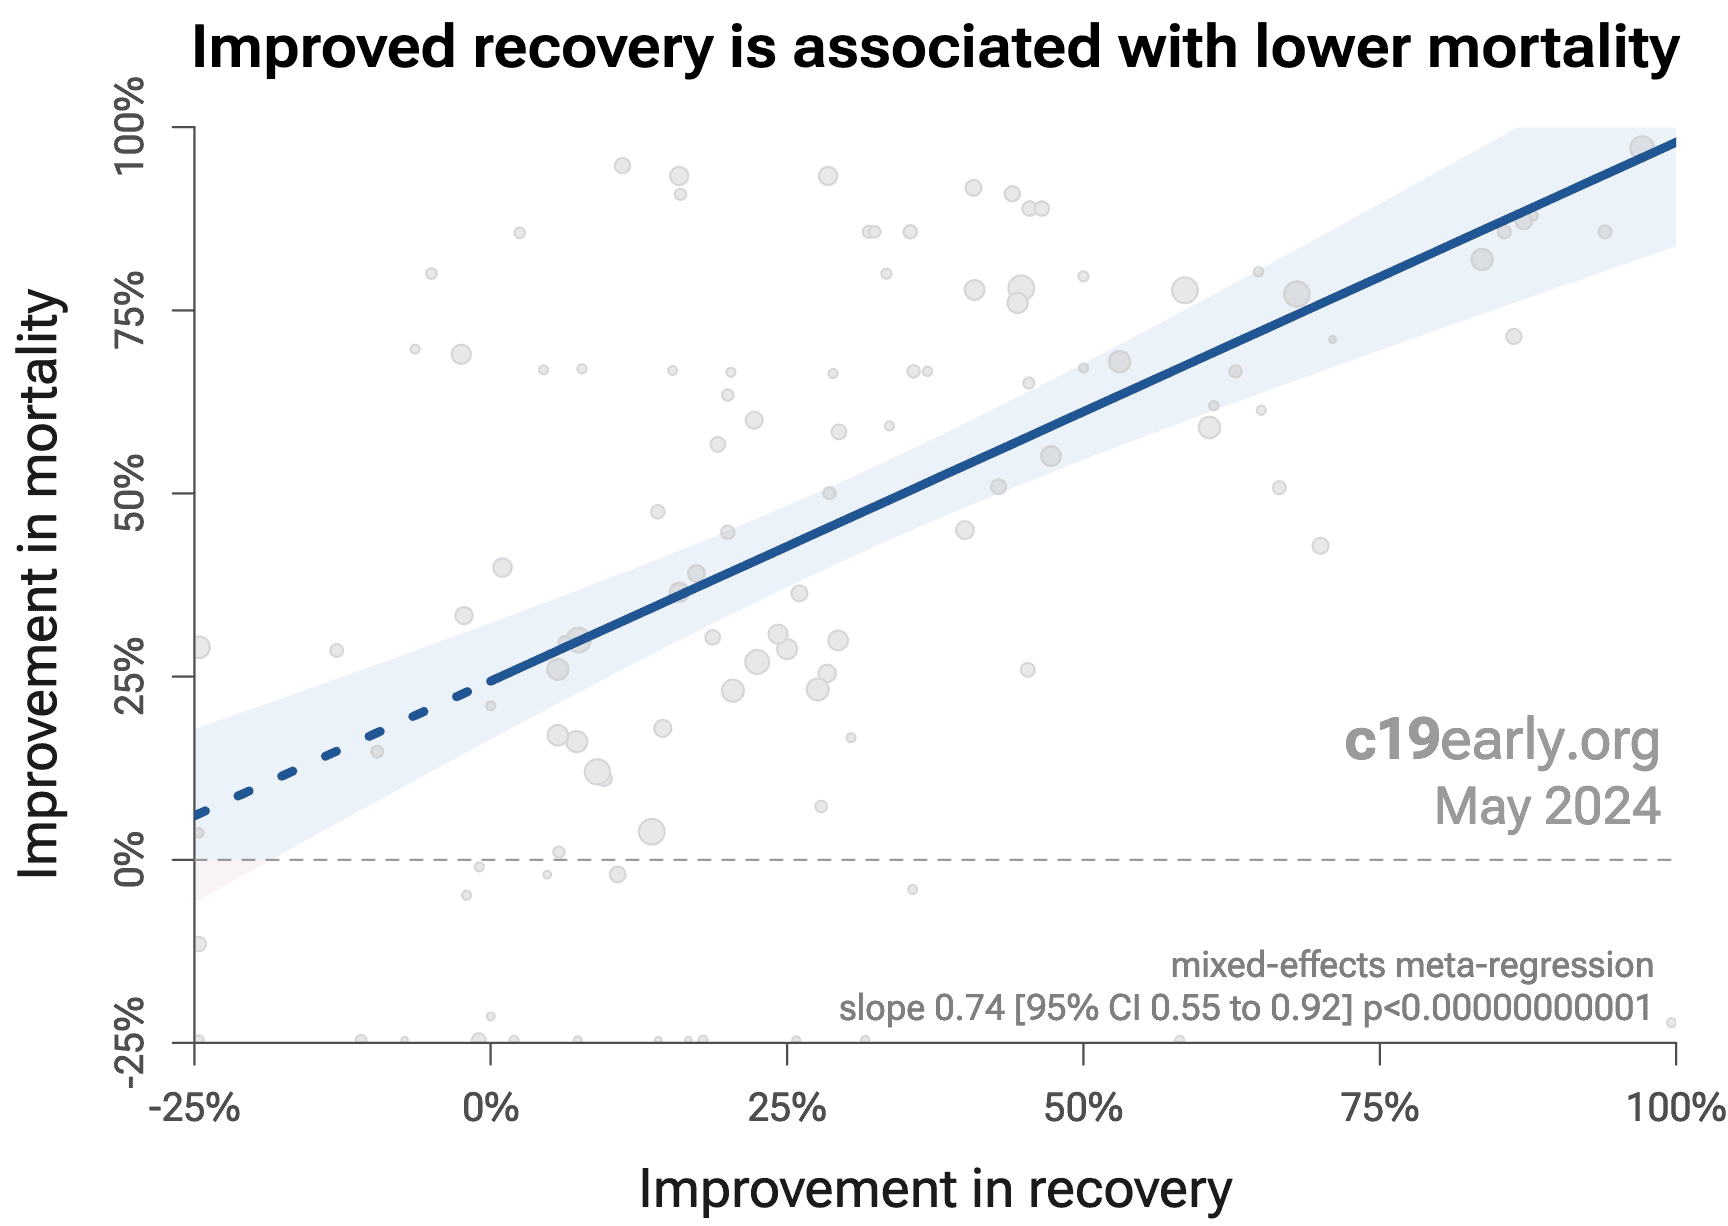
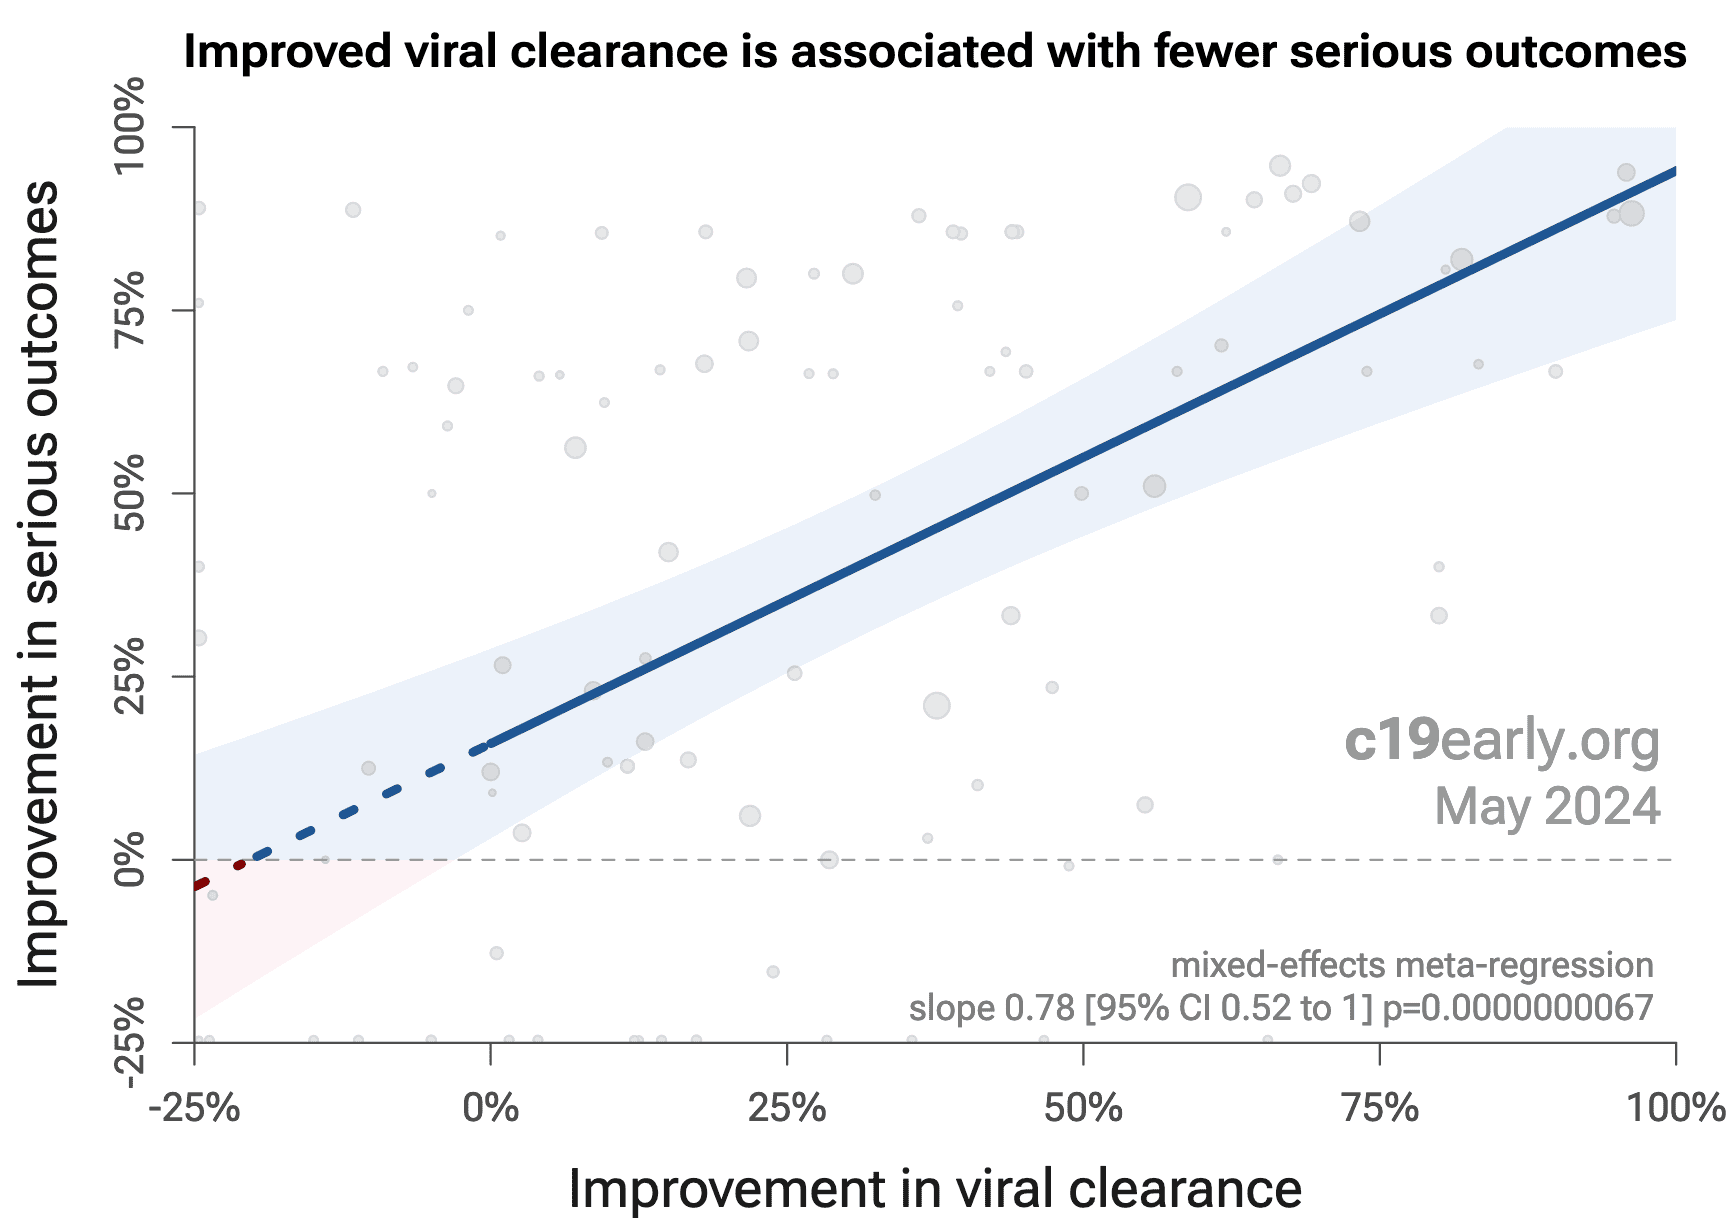
Analysis of the the association between different outcomes across studies from all 227 treatments we cover confirms the validity of pooled outcome analysis for COVID-19. Fig. 24 shows that lower hospitalization is very strongly associated with lower mortality (p < 0.0000000001). Similarly, Fig. 25 shows that improved recovery is very strongly associated with lower mortality (p < 0.0000000001). Considering the extremes, Singh et al. show an association between viral clearance and hospitalization or death, with p = 0.003 after excluding one large outlier from a mutagenic treatment, and based on 44 RCTs including 52,384 patients. Fig. 26 shows that improved viral clearance is strongly associated with fewer serious outcomes. The association is very similar to Singh et al., with higher confidence due to the larger number of studies. As with Singh et al., the confidence increases when excluding the outlier treatment, from p = 0.0000000074 to p = 0.00000000015.
Loading..
Fig. 24. Lower hospitalization is associated with lower mortality, supporting pooled outcome analysis.
Loading..
Fig. 25. Improved recovery is associated with lower mortality, supporting pooled outcome analysis.
Loading..
Fig. 24. Improved viral clearance is associated with fewer serious outcomes, supporting pooled outcome analysis.
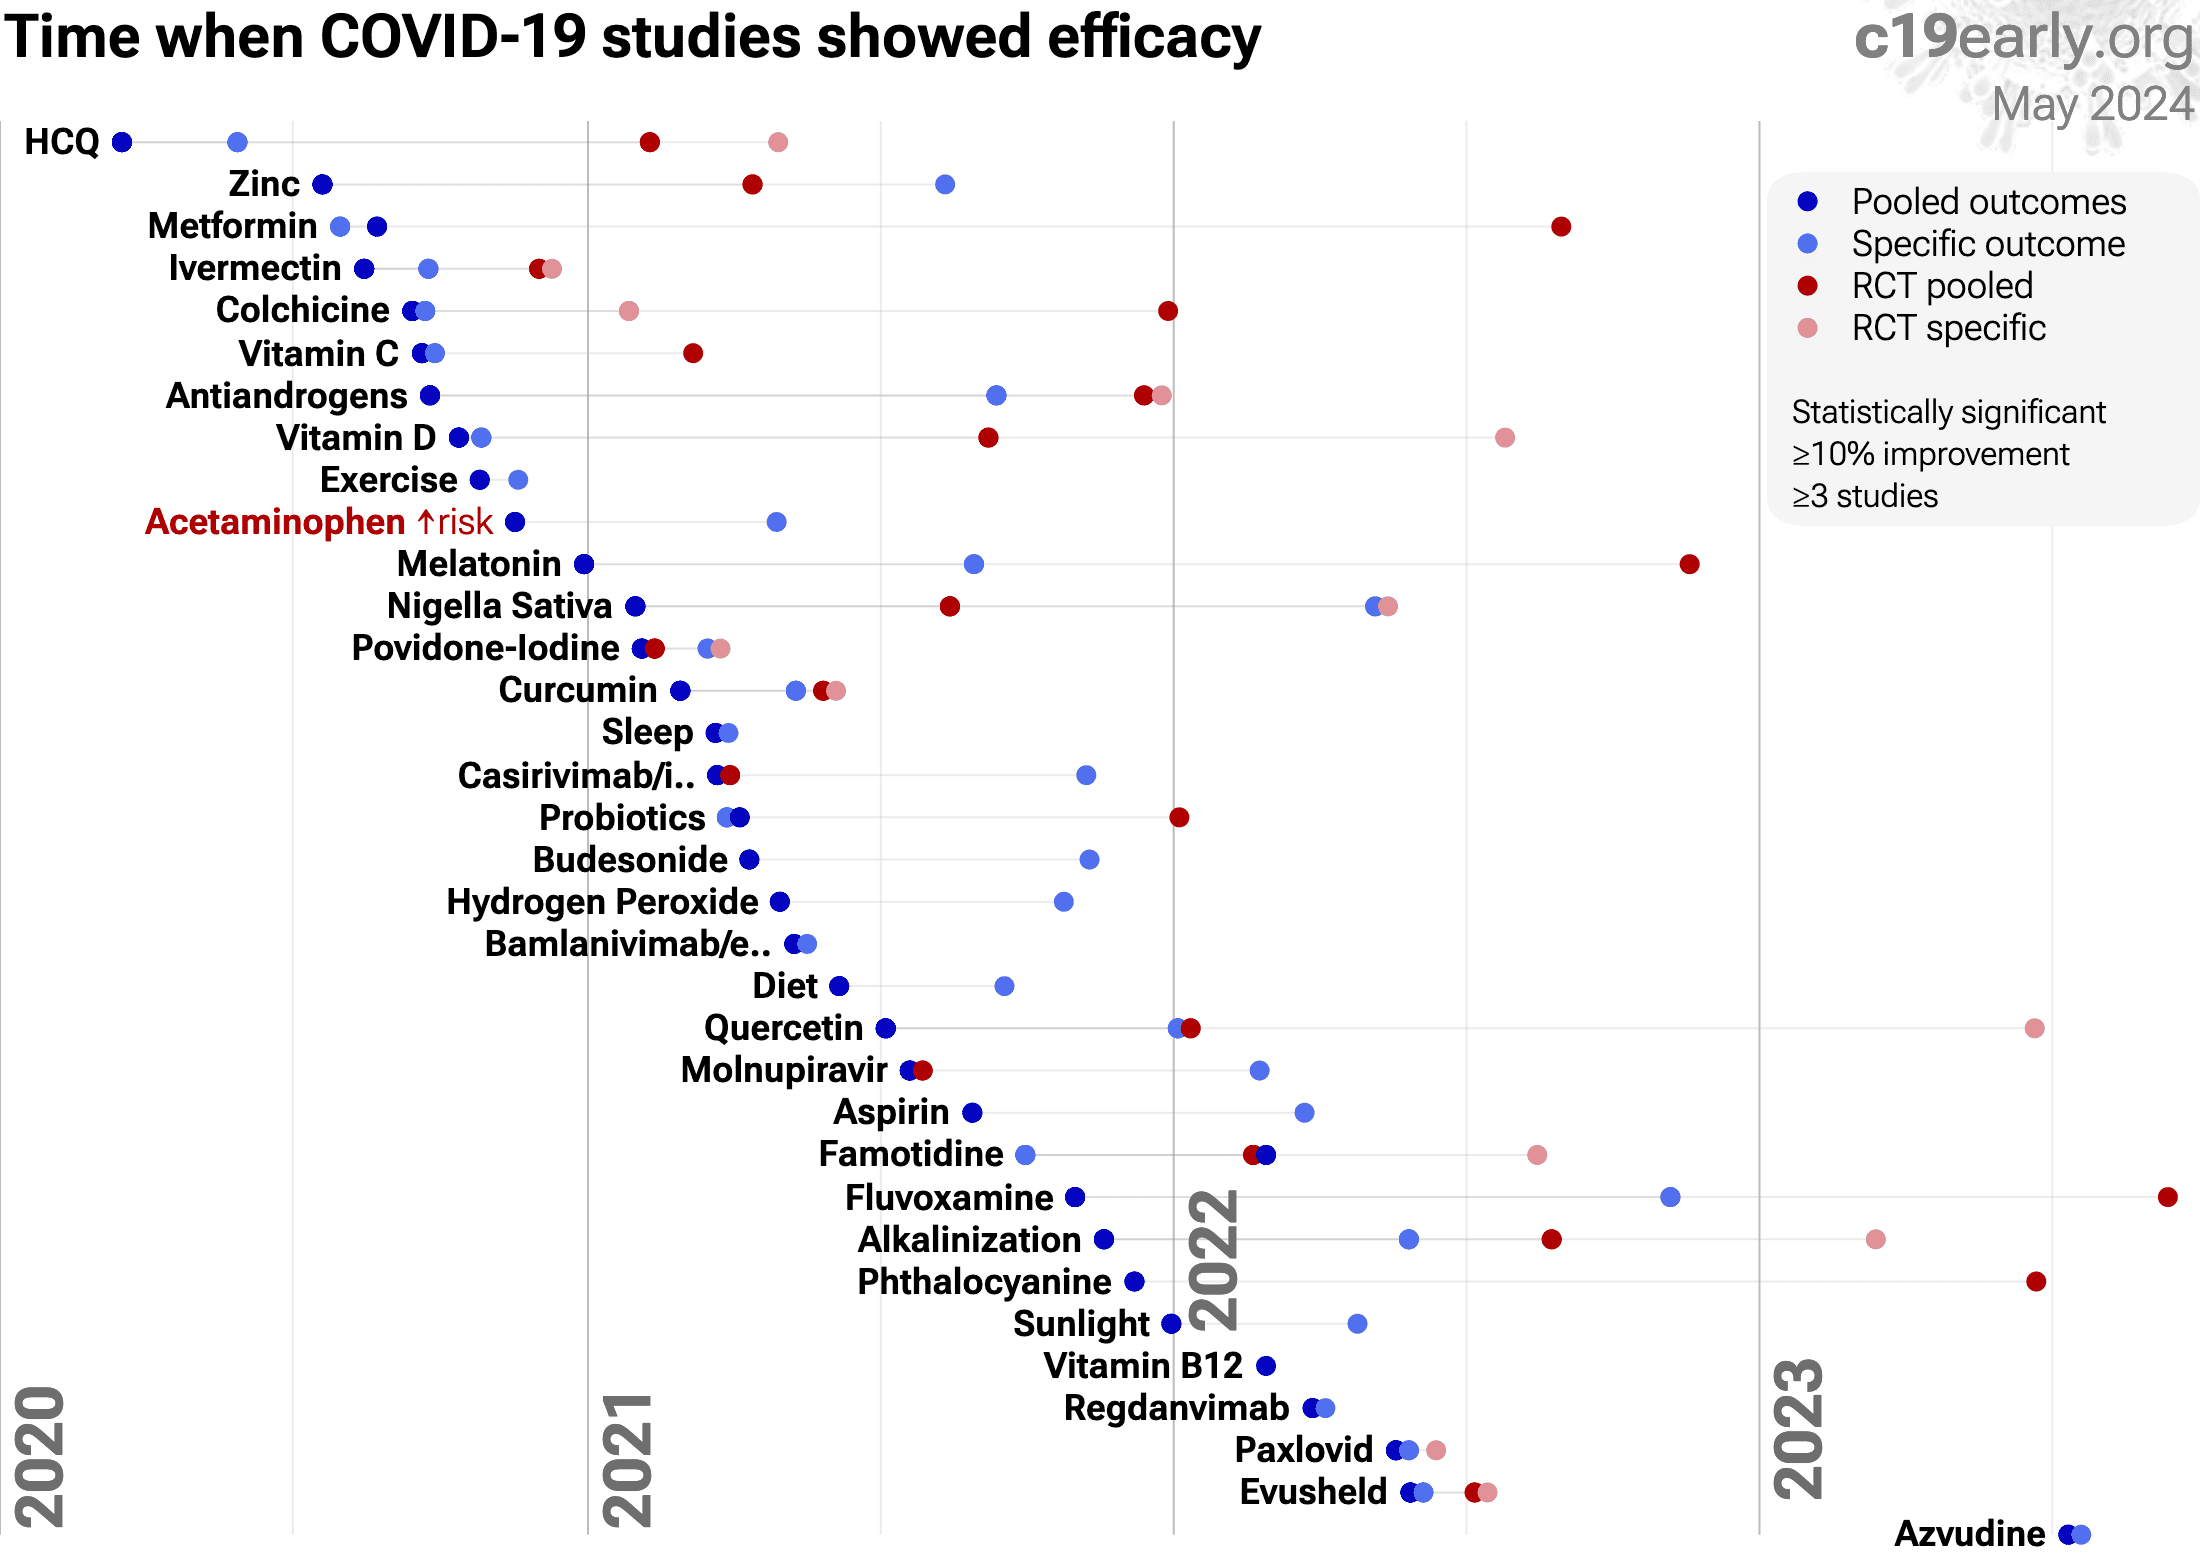
Currently, 59 of the treatments we analyze show statistically significant efficacy or harm, defined as ≥10% decreased risk or >0% increased risk from ≥3 studies. 85% of these have been confirmed with one or more specific outcomes, with a mean delay of 4.6 months. When restricting to RCTs only, 53% of treatments showing statistically significant efficacy/harm with pooled effects have been confirmed with one or more specific outcomes, with a mean delay of 7.5 months. Fig. 27 shows when treatments were found effective during the pandemic. Pooled outcomes often resulted in earlier detection of efficacy.
Loading..
Loading..
Fig. 27. The time when studies showed that treatments were effective, defined as statistically significant improvement of ≥10% from ≥3 studies. Pooled results typically show efficacy earlier than specific outcome results. Results from all studies often shows efficacy much earlier than when restricting to RCTs. Results reflect conditions as used in trials to date, these depend on the population treated, treatment delay, and treatment regimen.
Pooled analysis could hide efficacy, for example a treatment that is beneficial for late stage patients but has no effect on viral clearance may show no efficacy if most studies only examine viral clearance. In practice, it is rare for a non-antiviral treatment to report viral clearance and to not report clinical outcomes; and in practice other sources of heterogeneity such as differences in treatment delay are more likely to hide efficacy.
Analysis validates the use of pooled effects and shows significantly faster detection of efficacy on average. However, as with all meta-analyses, it is important to review the different studies included. We also present individual outcome analyses, which may be more informative for specific use cases.
Fig. 28 shows a mixed-effects meta-regression of mortality efficacy as a function of follow-up duration, which shows decreasing efficacy with longer follow-up. For example, the REDPINE RCT showed 17% lower mortality at day 29, 0% at day 60, and 6% higher mortality at the final follow-up (not reported in the paper, available only in the registry)141. All RCTs that reported mortality results at multiple time points show worse results with longer follow-up141-145. This relationship is statistically significant in meta-regression across all studies. This may reflect antiviral efficacy being offset by serious side effects of treatment. Remdesivir is a nucleoside analog which disrupts RNA replication and may cause mitochondrial and organ toxicity (liver/kidney/heart). Studies show significantly increased risk of acute kidney injury6-11, liver injury12-16, and cardiac disorders1,17-20. The associated damage may not show up in short-term follow-up with the limited monitoring of some RCTs, but may become apparent in longer-term mortality and morbidity.
An "efficacy-toxicity crossover," where the survival advantage gained by treating a virus is slowly eroded by the physiological cost of the treatment is not new. Other nucleoside analogs are well-known for delayed serious side effects due to mitochondrial toxicity. For example, AZT (Zidovudine), ddI (Didanosine), and ddC (Zalcitabine) showed significant early viral load improvements, but serious side effects appeared later.
Comparing remdesivir and AZT, they both pretend to be natural nucleotides (adenosine or thymidine). The viral enzyme grabs the drug instead of the real building block, halting replication. AZT mimics thymidine, targeting the HIV Reverse Transcriptase, while remdesivir mimics adenosine, targeting the SARS-CoV-2 RNA-dependent RNA Polymerase. AZT inhibits DNA Polymerase γ, preventing cells from replicating their mitochondrial DNA (mtDNA depletion), while remdesivir interacts with Mitochondrial RNA Polymerase (POLRMT) and can stall DNA Polymerase γ, disrupting the production of proteins needed for the Electron Transport Chain. AZT prevents cells from new creating new mitochondria, while for remdesivir the mitochondria become dysfunctional and fragmented, unable to produce energy efficiently.
The toxicity is cumulative and delayed. Cellular damage caused to mitochondria can persist and trigger cell death (apoptosis) well after treatment ends. Cells can survive on "bioenergetic reserve" (energy savings) for some time. Apoptosis may occur weeks after the final dose, triggered when the cell faces a new stressor (like physiological recovery) and its energy reserves finally deplete. For example, Kwok et al. show that remdesivir induces persistent cardiotoxicity in human iPSC-cardiomyocytes at clinically relevant concentrations. These changes persisted after cessation of treatment, resulting in delayed cell death. Consequently, liver, kidney, and heart cells attempting post-COVID repair may lack the energy to divide, leading to apoptosis, organ failure, and late-stage mortality.
Note that trials specifying long-term outcomes chose to selectively not report the results. The DisCoVeRy trial pre-specified long-term outcomes at days 180, 365, and 456146, and the CATCO trial pre-specified long-term outcomes at 12 and 24 months147; however, neither of these trials has reported these long-term outcomes for their remdesivir treatment arms (DisCoVeRy did report long-term outcomes for tixagevimab/cilgavimab).
Loading..
Fig. 28. Efficacy decreases with longer follow-up. Meta-regression showing mortality efficacy as a function of follow-up duration in COVID-19 remdesivir studies.
Wilcock et al. show that COVID-19 prescription treatments have been preferentially used by patients at lower risk. Retrospective studies may overestimate efficacy, and data for accurate adjustment may not be available. For example, patients with greater knowledge of effective treatments may be more likely to access prescription treatments but result in confounding because they are also more likely to use known beneficial non-prescription treatments.
Publishing is often biased towards positive results. Trials with patented drugs may have a financial conflict of interest that results in positive studies being more likely to be published, or bias towards more positive results. For example with molnupiravir, trials with negative results remain unpublished to date (CTRI/2021/05/033864 and CTRI/2021/08/0354242).
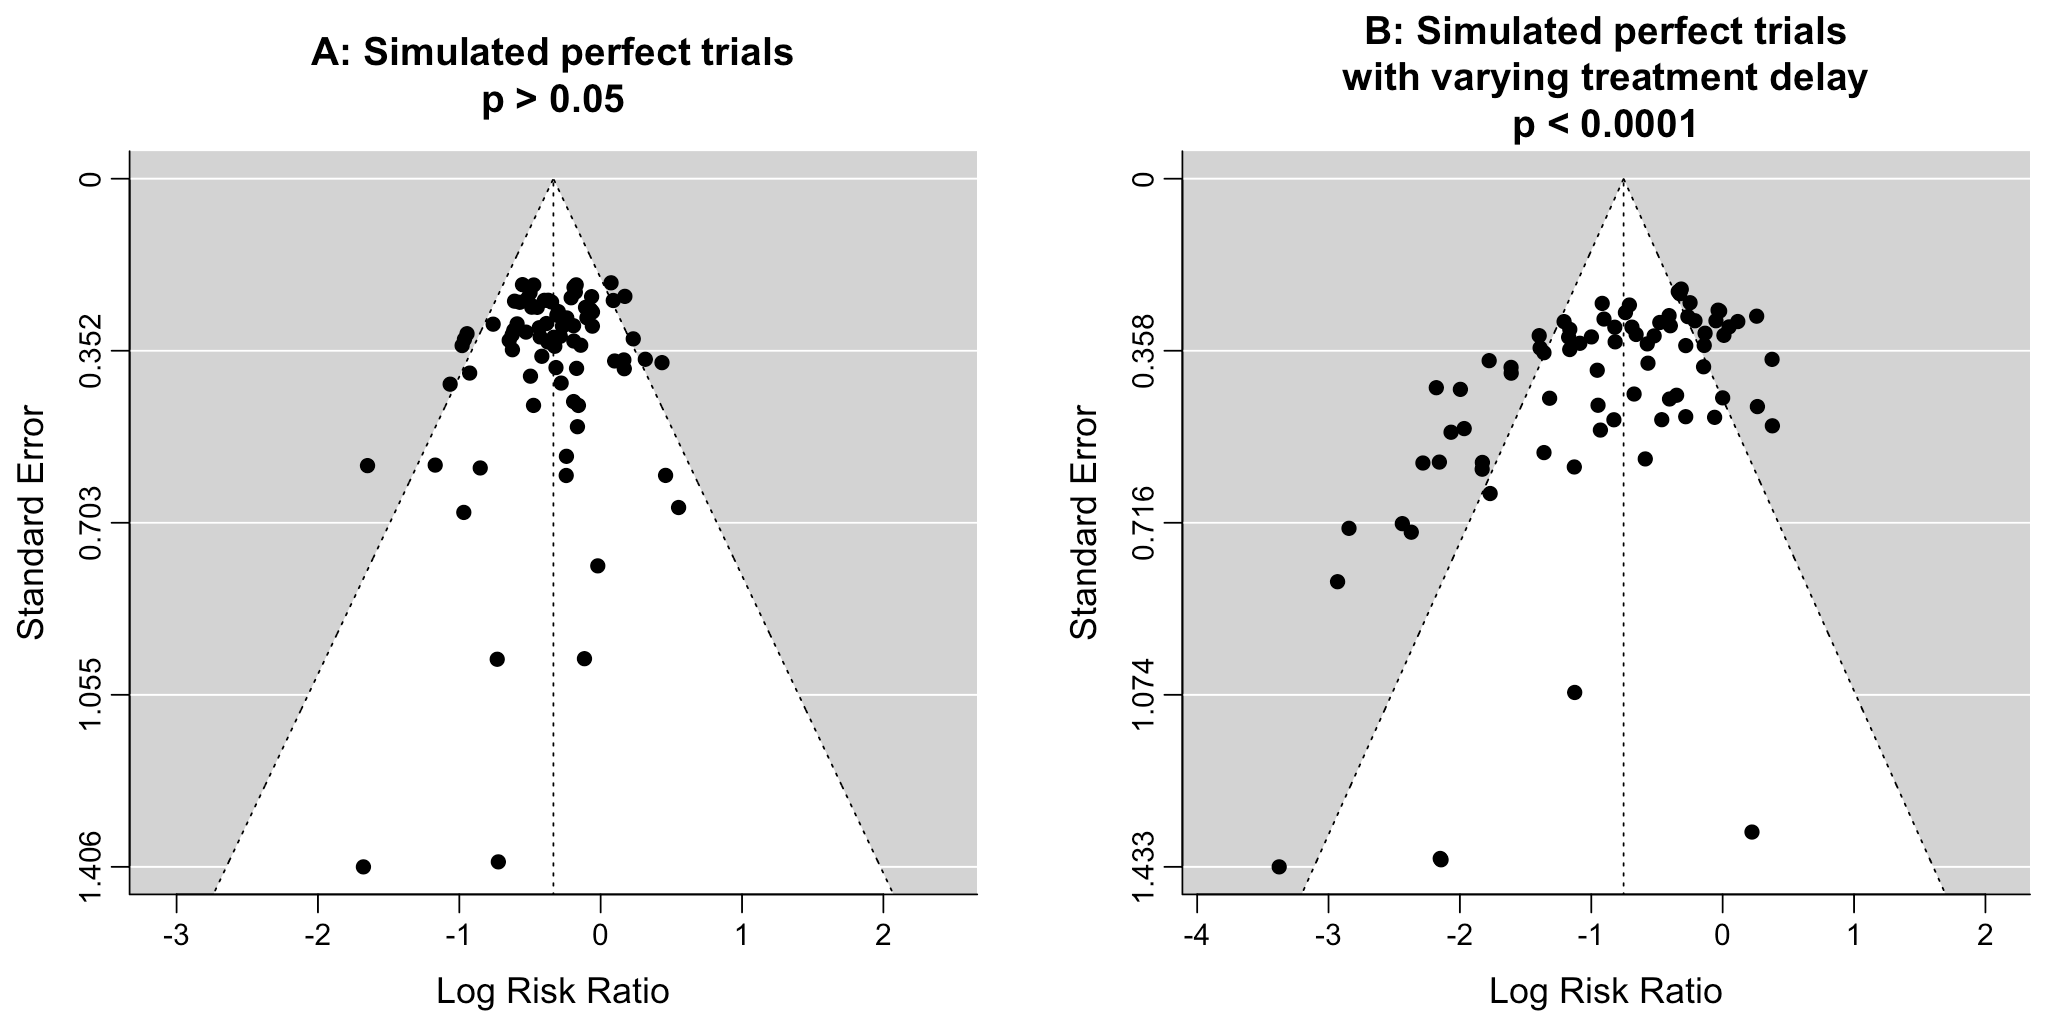
Funnel plots have traditionally been used for analyzing publication bias. This is invalid for COVID-19 acute treatment trials — the underlying assumptions are invalid, which we can demonstrate with a simple example. Consider a set of hypothetical perfect trials with no bias. Fig. 29 plot A shows a funnel plot for a simulation of 80 perfect trials, with random group sizes, and each patient's outcome randomly sampled (10% control event probability, and a 30% effect size for treatment). Analysis shows no asymmetry (p > 0.05). In plot B, we add a single typical variation in COVID-19 treatment trials — treatment delay. Consider that efficacy varies from 90% for treatment within 24 hours, reducing to 10% when treatment is delayed 3 days. In plot B, each trial's treatment delay is randomly selected. Analysis now shows highly significant asymmetry, p < 0.0001, with six variants of Egger's test all showing p < 0.05148-155. Note that these tests fail even though treatment delay is uniformly distributed. In reality treatment delay is more complex — each trial has a different distribution of delays across patients, and the distribution across trials may be biased (e.g., late treatment trials may be more common). Similarly, many other variations in trials may produce asymmetry, including dose, administration, duration of treatment, differences in SOC, comorbidities, age, variants, and bias in design, implementation, analysis, and reporting.
Log Risk Ratio Standard Error 1.406 1.055 0.703 0.352 0 -3 -2 -1 0 1 2 A: Simulated perfect trials p > 0.05 Log Risk Ratio Standard Error 1.433 1.074 0.716 0.358 0 -4 -3 -2 -1 0 1 2 B: Simulated perfect trials with varying treatment delay p < 0.0001
Fig. 29. Example funnel plot analysis for simulated perfect trials.
Summary statistics from meta-analysis necessarily lose information. As with all meta-analyses, studies are heterogeneous, with differences in treatment delay, treatment regimen, patient demographics, variants, conflicts of interest, standard of care, and other factors. We provide analyses for specific outcomes and by treatment delay, and we aim to identify key characteristics in the forest plots and summaries. Results should be viewed in the context of study characteristics.
Some analyses classify treatment based on early or late administration, as done here, while others distinguish between mild, moderate, and severe cases. Viral load does not indicate degree of symptoms — for example patients may have a high viral load while being asymptomatic. With regard to treatments that have antiviral properties, timing of treatment is critical — late administration may be less helpful regardless of severity.
Details of treatment delay per patient is often not available. For example, a study may treat 90% of patients relatively early, but the events driving the outcome may come from 10% of patients treated very late. Our 5 day cutoff for early treatment may be too conservative, 5 days may be too late in many cases.
Comparison across treatments is confounded by differences in the studies performed, for example dose, variants, and conflicts of interest. Trials with conflicts of interest may use designs better suited to the preferred outcome.
In some cases, the most serious outcome has very few events, resulting in lower confidence results being used in pooled analysis, however the method is simpler and more transparent. This is less critical as the number of studies increases. Restriction to outcomes with sufficient power may be beneficial in pooled analysis and improve accuracy when there are few studies, however we maintain our pre-specified method to avoid any retrospective changes.
Studies show that combinations of treatments can be highly synergistic and may result in many times greater efficacy than individual treatments alone115-139. Therefore standard of care may be critical and benefits may diminish or disappear if standard of care does not include certain treatments.
This real-time analysis is constantly updated based on submissions. Accuracy benefits from widespread review and submission of updates and corrections from reviewers. Less popular treatments may receive fewer reviews.
No treatment or intervention is 100% available and effective for all current and future variants. Efficacy may vary significantly with different variants and within different populations. All treatments have potential side effects. Propensity to experience side effects may be predicted in advance by qualified physicians. We do not provide medical advice. Before taking any medication, consult a qualified physician who can compare all options, provide personalized advice, and provide details of risks and benefits based on individual medical history and situations.
1 of the 81 studies compare against other treatments, which may reduce the effect seen.
Multiple reviews cover remdesivir for COVID-19, presenting additional background on mechanisms and related results, including21,22,156-158.
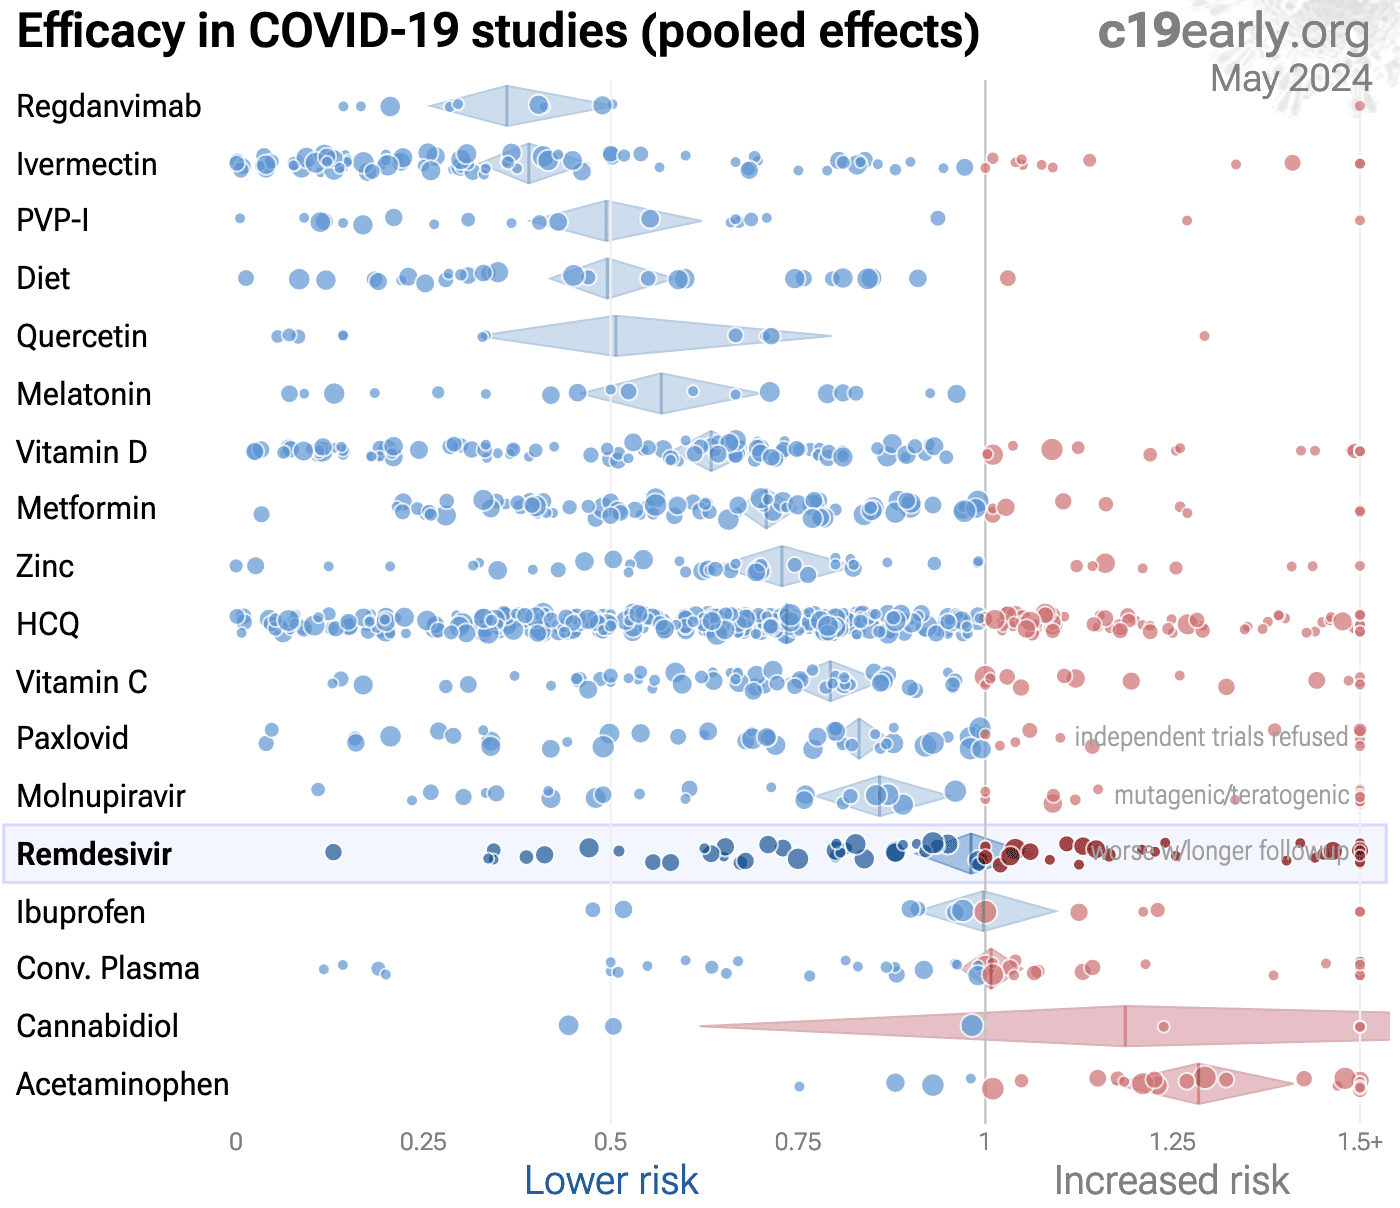
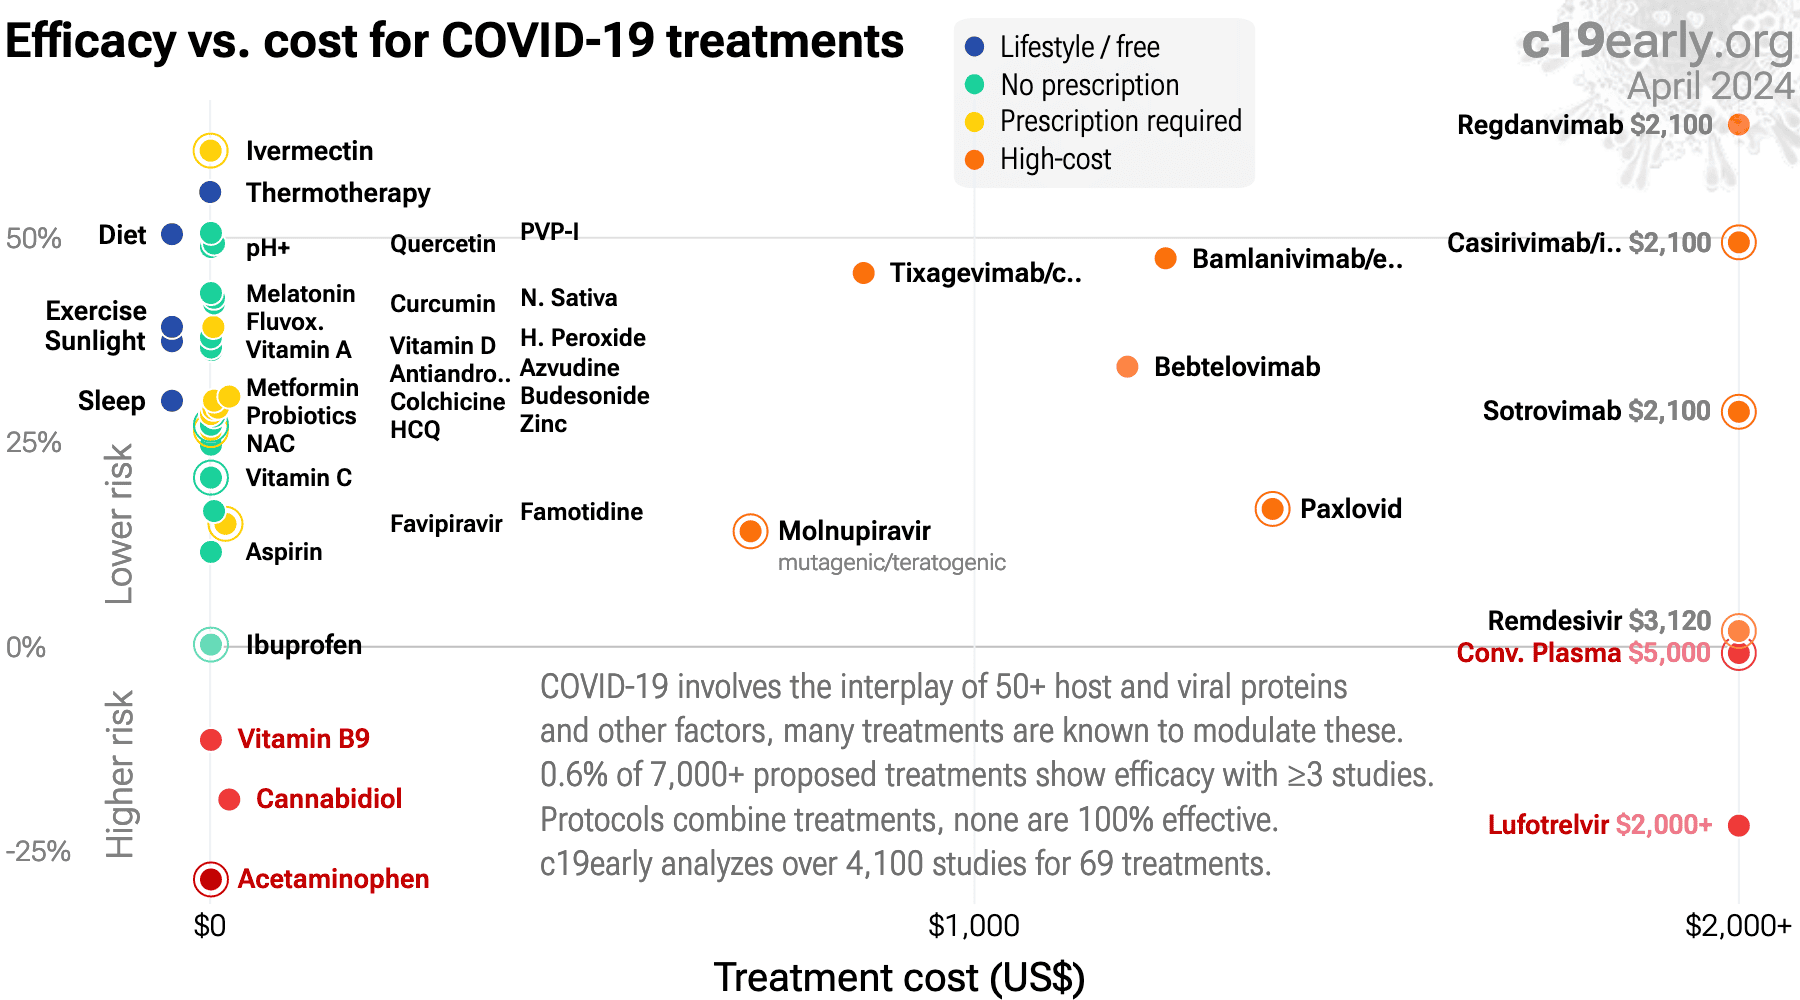
SARS-CoV-2 infection and replication involves a complex interplay of 500+ host and viral proteins and other factors56-63, providing many therapeutic targets. Over 12,000 compounds have been predicted to reduce COVID-19 risk64, either by directly minimizing infection or replication, by supporting immune system function, or by minimizing secondary complications. Fig. 30 shows an overview of the results for remdesivir in the context of multiple COVID-19 treatments, and Fig. 31 shows a plot of efficacy vs. cost for COVID-19 treatments.
Loading..
Fig. 30. Scatter plot showing results within the context of multiple COVID-19 treatments. Diamonds shows the results of random-effects meta-analysis. 0.5% of 12,000+ proposed treatments show efficacy159.
Loading..
Loading..
Fig. 31. Efficacy vs. cost for COVID-19 treatments.
Meta-analysis using the most serious outcome reported shows 4% [-4‑13%] higher risk, without reaching statistical significance. Meta regression with follow-up duration shows that mortality results are worse with longer follow-up. This may reflect antiviral efficacy being offset by side effects of treatment.
Remdesivir is a nucleoside analog that affects RNA replication. Off-target effects include mitochondrial1-5 and organ toxicity. Studies show significantly increased risk of acute kidney injury6-11, liver injury12-16, and cardiac disorders1,17-20. Harms may be greater than suggested from short-term follow-up, with significant long-term morbidity. Variants may be less susceptible to remdesivir21-23.
Prescription treatments have been preferentially used by patients at lower risk25. Retrospective studies may overestimate efficacy, for example patients with greater knowledge of effective treatments may be more likely to access prescription treatments but result in confounding because they are also more likely to use known beneficial non-prescription treatments.
 
Contact.
Contact us on X at @CovidAnalysis.
Funding.
We have received no funding or compensation in any form, and do not accept donations. This is entirely volunteer work.
Conflicts of interest.
We have no conflicts of interest. We have no affiliation with any pharmaceutical companies, supplement companies, governments, political parties, or advocacy organizations.
AI.
We use AI models (Gemini, Grok, Claude, and ChatGPT) tasked with functioning as additional peer-reviewers to check for errors, suggest improvements, and review spelling and grammar. Any corrections are manually verified. Our preference for em dashes is independent of AI.
Updates.
Our COVID-19 meta-analyses involve the extraction of over 229,000 datapoints from thousands of papers for 227 treatments. We thank the thousands of scientists, physicians, and other contributors that have provided updates, suggestions, feedback, and corrections. These are all welcome and can be submitted at https://c19early.org/smeta.html.
Dedication.
This work is dedicated to top evidence-based physicians that worked tirelessly to analyze evidence and greatly reduce mortality and morbidity during the pandemic. In alphabetical order: Dr. Thomas J. Borody, Dr. Mary Talley Bowden, Dr. Flavio Cadegiani, Dr. Shankara Chetty, Dr. Ryan Cole, Dr. George Fareed, Dr. Sabine Hazan, Dr. Pierre Kory, Dr. Tess Lawrie, Dr. Robert Malone, Dr. Paul Marik, Dr. Peter McCullough, Dr. Didier Raoult, Dr. Harvey Risch, Dr. Jackie Stone, Dr. Brian Tyson, Dr. Joseph Varon, and Dr. Vladimir Zelenko.
Public domain.
This is a public domain work distributed in accordance with the Creative Commons CC0 1.0 Universal license, which dedicates the work to the public domain by waiving all rights worldwide under copyright law. You can distribute, remix, adapt, and build upon this work in any medium or format, including for commercial purposes, without asking permission. Referenced material and third-party images retain any original copyrights or restrictions. See: https://creativecommons.org/publicdomain/zero/1.0/.
Late treatmentRCT · 832 patients · multinational · Mar 2020 – Jan 2021
Remdesivir for COVID-19
No significant difference in outcomes seen
RCT 857 hospitalized patients, showing no significant differences with remdesivir treatment. EudraCT2020-000936-23. Submit Corrections or Updates.
Late treatmentRCT · NCT04330690 · 1,281 patients · Canada
Remdesivir for COVID-19
Lower ventilation and longer hospitalization
p = 0.00028 (ventilation) and p = 0.036 (hospitalization)
RCT 1,282 hospitalized patients in Canada showing lower mechanical ventilation with remdesivir treatment, but no significant difference for mortality. Submit Corrections or Updates.
RCT 156 COVID-19 patients showing higher mortality with favipiravir and remdesivir overall. Favipiravir and remdesivir were more effective when started earlier, however note that Table 10 compares earlier favipiravir/remdesivir+standard care with standard care at any time, which will exaggerate the benefits/harms of earlier/later treatment. The confidence intervals for the Cox results are unusually narrow suggesting a possible error in calculation. Submit Corrections or Updates.
Late treatmentPSM retrospective · 1,324 patients · Mar 2020 – Jan 2021
Remdesivir for COVID-19
Outcome
Improvement
Relative Risk · 95% CI
Lower mortality and longer ICU admission
p = 0.0031 (mortality) and p = 0.003 (ICU admission)
PSM retrospective 29 hospitals in Saudi Arabia, showing lower mortality with remdesivir treatment. Submit Corrections or Updates.
ICU patientsRetrospective · 70 patients · Iran
Remdesivir for COVID-19
Outcome
Improvement
Relative Risk · 95% CI
Longer ventilation and ICU admission
Not statistically significant · p = 0.17 (ventilation) and p = 0.23 (ICU admission)
Retrospective 70 COVID-19 ICU patients, 35 receiving remdesivir plus standard treatment and 35 receiving standard treatment only. No significant differences were found for mortality, hospitalization time, ICU time, or ventilation time. Submit Corrections or Updates.
Analysis of 63 hematological malignancy patients showing prolonged SARS-CoV-2 viral shedding (average 47 days) associated with immunosuppression status and with remdesivir use. Submit Corrections or Updates.
Late treatmentPSM retrospective · USA · Jan 2021 – Dec 2022
Remdesivir for COVID-19
Outcome
Improvement
Relative Risk · 95% CI
00.511.52+
← Remdesivir
reduces risk
Remdesivir
increases risk →
Higher mortality and lower ventilation
p < 0.0001 (mortality) and p < 0.0001 (ventilation)
Retrospective 3,018,646 COVID-19 patients in the US showing higher rates of hospitalization, inpatient death, acute kidney injury, major adverse cardiovascular events, and need for mechanical ventilation among rural patients compared to urban patients. The increased risk for rural patients persisted across pre-delta, delta, and omicron variant periods and after adjustments. Submit Corrections or Updates.
Late treatmentPSM prospective · 6,230 patients · UK
Remdesivir for COVID-19
Lower mortality and higher ventilation
p = 0.034 (mortality) and p = 0.003 (ventilation)
PSM analysis of remdesivir use in the UK showing no significant reduction in mortality at 14 days, and significantly higher mechanical ventilation/ECMO and liver dysfunction.

Authors appear to have abandoned this preprint, with no journal publication as of April 2026.

Version 2 of the preprint reframes the results toward a more favorable interpretation of remdesivir - removing the negative conclusion from v1 and emphasizing 28-day results. Version 2 also removed several paragraphs from v1's discussion about propensity score limitations and the omission of variables like oxygen saturation, respiratory rate, GCS, urea, and CRP from the matching model - a section that was self-critical about study weaknesses with authors stating "with hindsight these may have been important to consider..." The acknowledgment that "73% of patients given remdesivir were excluded" was changed to "43% were excluded" in v2 - this reflects a different denominator (v1 counted all remdesivir patients in the database; v2 counts only those eligible after other criteria were applied).

Contradiction regarding equivalent standard of care assumption: in the methods section, authors state regarding corticosteroids that 'remdesivir patients will have received these in the same way as non-remdesivir patients.' However, the results demonstrate a large discrepancy, with 94% of remdesivir patients receiving dexamethasone post-baseline compared to only 62% of matched controls, directly invalidating their methodology assumption.

Adjustment for post-baseline treatment (collider bias): the primary logistic regression model adjusts for 'dexamethasone use during hospitalisation'. Adjusting for a post-baseline variable that may be influenced by patient deterioration or unmeasured disease severity introduces collider bias and distorts the true treatment effect.

Severe imbalance in post-baseline therapies indicating unmeasured severity bias: despite propensity score matching on baseline characteristics, post-baseline non-invasive ventilation (28.8% vs 10.2%) and mechanical ventilation (6.8% vs 3.3%) were much higher in the remdesivir group. This strongly indicates residual confounding, where the remdesivir group either had higher unmeasured baseline severity or was subject to a significantly more aggressive care pathway.

Contradictory sample sizes for the primary outcome across sections: the CONSORT flowchart (Figure 1) and the main text state that 1,507 remdesivir and 4,734 control patients were included in the primary outcome analysis. However, Table 2 lists the incidence denominators as 1,502 for remdesivir and 4,728 for control.

Mismatch in the number of patients included in the logistic regression model: page 8 states '6,202 patients were included in a logistic regression model (Table 2)'. However, Table 2 reports counts summing to 6,192 patients.

Manufacturer involvement in Statistical Analysis Plan: authors note that the manufacturer (Gilead) was given the opportunity to review and comment on the SAP.

Inconsistent control group mortality percentage: the abstract and text report the 14-day mortality for the control group as 11.9% (565/4,734). Table 2 reports it as 12.0%.

Author financial ties to the manufacturer: several authors disclose that they are coordinating or serving as lead statistician for trials fully or partially funded by Gilead, the manufacturer of remdesivir. This is properly disclosed but represents a substantial financial conflict of interest.

Mismatch in categorical sum for comorbidities: in Table 1, under 'Number of key comorbidities' for the matched remdesivir group, the total N is reported as 1,542, but the sum of the constituent categories (0: 470, 1: 470, 2+: 603) mathematically equals 1,543. Submit Corrections or Updates.
Retrospective 162 hospitalized COVID-19 patients in Indonesia, showing no significant difference in delayed viral clearance with remdesivir treatment in unadjusted results. Submit Corrections or Updates.
Retrospective 149 patients under invasive mechanical ventilation in Germany showing no significant difference in mortality with remdesivir in unadjusted results. Submit Corrections or Updates.
Late treatmentDouble-blind RCT · NCT04321616 · 118 patients · Norway
Remdesivir for COVID-19
Small RCT in Norway showing no significant differences with remdesivir treatment. Add-on trial to WHO Solidarity. Longer term recovery results are from Patrick-Brown et al. Submit Corrections or Updates.
Retrospective 331 hospitalized COVID-19 patients in Italy, showing lower progression with remdesivir. Combination therapy with mAbs was more effective, and improved results were seen for immunocompromised patients. Submit Corrections or Updates.
Retrospective 2,174 hospitalized patients showing no significant differences with remdesivir treatment. Submit Corrections or Updates.
RCT 1,062 hospitalized patients showing faster recovery time with treatment, median 10 days vs. 15 days for placebo, rate ratio for recovery 1.29, p<0.001. Day 29 mortality was 11.4% with remdesivir and 15.2% with placebo, hazard ratio HR 0.73 [0.52-1.03]. Submit Corrections or Updates.
Retrospective 4,631 hospitalized patients in New York, showing higher mortality with remdesivir, and lower mortality with HCQ. Authors suggest that increased mortality during the first epidemic wave was partly due to strain on hospital resources. Submit Corrections or Updates.
Retrospective 559 COVID-19 ICU patients in Indonesia, showing higher mortality with remdesivir in unadjusted results, without statistical significance. Note that confounding by indication should be less significant for ICU studies compared to studies of all hospitalized patients, because all patients are in critical condition. Submit Corrections or Updates.
Late treatmentRetrospective · 98 patients · Spain · Nov 2021 – Feb 2022
Remdesivir for COVID-19
Outcome
Improvement
Relative Risk · 95% CI
Higher severe cases and more moderate/severe cases
Not statistically significant · p = 0.58 (severe cases) and p = 0.087 (more moderate/severe cases)
Retrospective 98 kidney transplant recipients with SARS-CoV-2 Omicron infection in Spain, showing no significant difference in mortality with remdesivir treatment. Earlier administration was associated with improved results, although this analysis is subject to survivorship/selection bias. Submit Corrections or Updates.
Retrospective 209 hospitalized COVID-19 patients in Taiwan showing higher mortality with a 5-day course of remdesivir compared to other antivirals or no antiviral treatment in multivariable analysis. Adjustments include qSOFA and CCI, with the adjusted result decreasing risk by 3x, however adjustment may not fully account for confounding by severity. Submit Corrections or Updates.
Retrospective 163 COVID-19 patients in Singapore, showing increased risk of liver injury (abnormal ALT) with acetaminophen in a dose-dependent manner, and with remdesivir, without statistical significance in both cases. Submit Corrections or Updates.
Early treatmentRetrospective · 13,964 patients · China · Mar – Dec 2022
Remdesivir for COVID-19
Outcome
Improvement
Relative Risk · 95% CI
Higher ICU admission and higher oxygen therapy
p < 0.0001 (ICU admission) and p < 0.0001 (oxygen)
Target trial emulation study of 18,196 hospitalized COVID-19 patients in Hong Kong showing significantly higher ICU admission and AKI with remdesivir + paxlovid compared with paxlovid alone, and lower mortality and ventilatory support with remdesivir + paxlovid compared with remdesivir alone. Patients were treated within 5 days of diagnosis, however the time from onset is not known. Submit Corrections or Updates.
Retrospective 1,138 hospitalized patients in the USA, 286 treated with remdesivir, showing lower mortality with treatment. Age was not included in the adjustments (authors excluded variables that contributed to another score, in this case age is in Pneumonia Severity Index). Submit Corrections or Updates.
Retrospective 456 hospitalized patients in the USA showing an association between remdesivir treatment and increased COVID-19 severity in multivariable analysis, for remdesivir treatment within 7 days and when administered before meeting the severe case definition. Authors suggest this is due to remdesivir being preferentially used for more severe cases, citing Bhimraj et al., however that paper is from April 2020 before widespread use of remdesivir. During the period of the current study remdesivir was more widely recommended. However, there could still be significant residual confounding after adjustments. Submit Corrections or Updates.
Retrospective 7,816 Veterans Affairs hospitalized patients showing lower mortality with remdesivir. Submit Corrections or Updates.
Retrospective 2017 hospitalized patients in India, showing higher mortality with remdesivir in unadjusted results, however no group details are provided and this result is subject to confounding by indication, with authors suggesting treatment was more likely for more severe patients. Submit Corrections or Updates.
Late treatmentRetrospective · 165 patients · Romania · Mar 2020 – May 2021
Remdesivir for COVID-19
Outcome
Improvement
Relative Risk · 95% CI
Higher ICU admission with remdesivir
p = 0.01
Retrospective 165 hospitalized COVID-19+ kidney transplant patients, 38 treated with remdesivir, showing no significant difference in mortality, higher ICU admission, and lower ICU mortality. Subject to confounding by time with significant changes to SOC and treatment propensity during the study period. Submit Corrections or Updates.
Prospective study of 465 COVID-19 ICU patients in Libya showing no significant differences with treatment. Submit Corrections or Updates.
Late treatmentRetrospective · 333 patients · Poland · Mar – Aug 2020
Remdesivir for COVID-19
Outcome
Improvement
Relative Risk · 95% CI
Greater improvement with remdesivir
p = 0.01
Retrospective study comparing 122 remdesivir patients and 211 lopinavir/ritonavir patients, showing higher rates of clinical improvement with remdesivir and lower mortality (not statistically significant). Submit Corrections or Updates.
Retrospective 1,534 patients (67% hospitalized) accessing long-COVID centers in Italy showing higher persistent long-COVID symptoms with antiviral treatment (97% remdesivir) after adjustment for confounders, without statistical significance. The mean interval between acute SARS-CoV-2 infection and symptom evaluation was of 338 days. Submit Corrections or Updates.
Database analysis of 11,721 hospitalized patients, 48 treated with remdesivir.

Data inconsistencies have been found in this study, for example 99.4% of patients treated with HCQ were treated in urban hospitals, compared to 65% of untreated patients (Supplemental Table 3), while patients are distributed in a more balanced manner between teaching or not-teaching hospitals, as well as in the most urbanized (Northeast) and less urbanized (Midwest) regions of the United States161. Submit Corrections or Updates.
Retrospective 303 remdesivir patients and 303 matched controls showing significantly faster clinical improvement, and lower (but not statistically significant) mortality. Submit Corrections or Updates.
Late treatmentRetrospective · 142 patients · Israel
Remdesivir for COVID-19
Outcome
Improvement
Relative Risk · 95% CI
No significant difference in outcomes seen
Retrospective 29 remdesivir patients and 113 controls, not finding a significant difference in nasopharyngeal viral load or hospitalization time. Hospitalization time was lower with treatment, with a larger reduction for non-intubated patients, although not statistically significant in both cases. Submit Corrections or Updates.
Early treatmentRCT · 562 patients · multinational · Sep 2020 – Apr 2021
Remdesivir for COVID-19
Outcome
Improvement
Relative Risk · 95% CI
Lower death/hosp. and hospitalization
p = 0.008 (death/hosp.) and p = 0.0092 (hospitalization)
RCT high-risk outpatients, 279 treated with remdesivir and 283 control patients, median 5 days from symptoms, showing significantly lower hospitalization with treatment. Submit Corrections or Updates.
Late treatmentRetrospective · 318 patients · Sweden
Remdesivir for COVID-19
Higher progression and improved viral clearance
Not statistically significant · p = 0.31 (progression) and p = 0.11 (viral clearance)
Retrospective 318 hospitalized COVID-19 patients in Sweden, showing improvements in viral clearance but no improvement for mortality with remdesivir treatment. Submit Corrections or Updates.
Retrospective 991 hospitalized patients in Iran focusing on aspirin use but also showing results for HCQ, remdesivir, and favipiravir. Submit Corrections or Updates.
Late treatmentRetrospective · Indonesia · Mar – Dec 2020
Remdesivir for COVID-19
Outcome
Improvement
Relative Risk · 95% CI
00.511.52+
← Remdesivir
reduces risk
Remdesivir
increases risk →
No significant difference in mortality
Retrospective 689 hospitalized patients in Indonesia, showing no significant difference in mortality with remdesivir treatment. Submit Corrections or Updates.
Retrospective 845 COVID-19 patients who died from cardiovascular causes after hospital discharge. In multivariable analysis, remdesivir treatment showed a non-significant trend toward increased hazard of death (aHR: 1.217, 95% CI: 0.891-1.663, p=0.195). Submit Corrections or Updates.
Retrospective 26,445 hospitalized COVID-19 patients in the USA, showing higher mortality with remdesivir. Submit Corrections or Updates.
Early treatmentRCT · 136 patients · multinational · Sep 2021 – Jun 2022
Remdesivir for COVID-19
Outcome
Improvement
Relative Risk · 95% CI
primary
00.511.52+
← Remdesivir
reduces risk
Remdesivir
increases risk →
Improved viral clearance with remdesivir
p = 0.000024
High conflict of interest RCT with very low risk patients with high existing immunity, showing faster viral clearance with remdesivir. The viral clearance half-life was very short in both arms. With rapid viral clearance and very low risk patients, the trial favors detecting an effect with intravenous treatments that have rapid onset of action. Submit Corrections or Updates.
Retrospective 451 hospitalized COVID-19 patients in Iraq showing no significant difference in mortality with remdesivir treatment. Submit Corrections or Updates.
SARS-CoV-2 challenge study in 36 low-risk young adults. Infected participants had high viral loads peaking around 5 days post-exposure, mild-to-moderate upper respiratory symptoms, and anosmia, but no severe disease. Remdesivir had no significant effect on viral kinetics or symptoms. There was a 1-2 day delay before significant viral spread. A majority of patients reported symptoms prior to significant viral spread, supporting the use of early treatment targeted at the upper respiratory tract as a promising approach to limit progression of SARS-CoV-2. Submit Corrections or Updates.
Retrospective 167 nosocomial COVID-19 patients in South Korea, showing higher mortality with remdesivir treatment, without statistical significance. Submit Corrections or Updates.
Retrospective 218 COVID+ lung transplant patients in Germany, showing no significant difference in severe cases with early remdesivir use. Submit Corrections or Updates.
Late treatmentPSM retrospective · 1,998 patients · USA
Remdesivir for COVID-19
Outcome
Improvement
Relative Risk · 95% CI
Higher ICU admission with remdesivir
Not statistically significant · p = 0.053
PSM retrospective 3,372 hospitalized patients in the USA treated with steroids, showing no significant difference in mortality with remdesivir, but a lower risk of acute kidney injury. Submit Corrections or Updates.
Retrospective 477 hospitalized patients in Indonesia, showing higher mortality with remdesivir in unadjusted results. Submit Corrections or Updates.
Retrospective 430 hospitalized COVID-19 patients with type 2 diabetes in Poland showing lower mortality with metformin and higher mortality with remdesivir, convalescent plasma, and aspirin in univariable analysis. These results were not statistically significant except for aspirin, and no baseline information per treatment is provided to assess confounding. Submit Corrections or Updates.
Retrospective study of 215 critically ill COVID-19 patients with respiratory failure showing higher mortality for cancer patients. Remdesivir was used more for non-survivors, without statistical significance. Most patients received remdesivir, suggesting standard use for critically ill patients at the time, however it is not clear why some patients did not receive treatment, and baseline details per group are not provided. Submit Corrections or Updates.
Late treatmentRCT · 70 patients · India · Jun – Dec 2020
Remdesivir for COVID-19
Outcome
Improvement
Relative Risk · 95% CI
00.511.52+
← Remdesivir
reduces risk
Remdesivir
increases risk →
Higher mortality and ventilation
Not statistically significant · p = 0.47 (mortality) and p = 0.42 (ventilation)
Small RCT with 34 remdesivir patients and 36 controls finding no significant difference in clinical outcomes. Submit Corrections or Updates.
Retrospective 1,215 hospitalized patients in the Phillipines, showing no significant difference in outcomes with remdesivir or HCQ use in unadjusted results subject to confounding by indication. Submit Corrections or Updates.
Late treatmentRetrospective · 180 patients · Apr 2020 – Aug 2021
Remdesivir for COVID-19
Outcome
Improvement
Relative Risk · 95% CI
Higher ICU admission with remdesivir
p = 0.000053
Retrospective 180 hospitalized pediatric COVID-19 patients in the Philippines showing lower mortality with vitamin D and zinc, and higher mortality with remdesivir, all without statistical significance. Remdesivir was given to few patients and authors do not provide information on the timing of treatment - confounding by indication may be significant.

Table 6 presents an adjusted Cox proportional hazards regression model that includes 14 categorical variables (accounting for ~15 degrees of freedom), suggesting significant risk of overfitting.

The study concludes that corticosteroid use is independently associated with an 8.21 times increased hazard of mortality. However, corticosteroids are routinely administered as a standard of care to patients who are clinically deteriorating. Attempting to adjust for this using an overfitted baseline 'severity' variable is likely to be inadequate. The observed association is more likely to be driven by confounding by indication (sicker patients receive steroids). The adjusted Cox model includes variables that are inherently collinear and lie on the same causal pathway, such as 'COVID-19 severity', multiple individual respiratory symptoms (retractions, cyanosis, difficulty of breathing, alar flaring), and treatments prescribed for severe illness (corticosteroids, IVIG). This collinearity may explain the drastic shifts between crude and adjusted hazard ratios. Submit Corrections or Updates.
Retrospective 18,566 hospitalized patients in Japan, showing higher mortality with remdesivir treatment. Submit Corrections or Updates.
Late treatmentPSM retrospective · 645 patients · USA · Mar 2020 – Mar 2021
Remdesivir for COVID-19
Outcome
Improvement
Relative Risk · 95% CI
Longer hospitalization with remdesivir
p < 0.000001
Retrospective 645 hospitalized COVID-19 patients in the USA showing higher incidence of bradycardia and longer hospital stay with remdesivir treatment. Mortality was lower, however the reported p-value of <0.001 is not plausible.

With 1 death in the remdesivir group and 3 in the control group across 101 matched pairs, McNemar’s two-sided p (with continuity correction, as specified) ranges from ~0.48 (if the single remdesivir death is paired with a control death; b = 2, c = 0) to ~0.62 (if there is no overlap; b = 3, c = 1).

Moreover, the PSM excluded 63 of 64 deaths in the treatment group - the matched group is not representative of the population.

We also note that the bradycardia and hospitalization time results are similar in the unmatched and matched groups, however the mortality result changes from ~3x higher to ~3x lower. Submit Corrections or Updates.
Retrospective 19,184 immunocompromised patients treated with remdesivir and matched controls, showing lower mortality with treatment. Several authors work at Gilead and the study was funded by Gilead.

The majority of patients were treated with remdesivir. A significant fraction of non-remdesivir patients may have contraindications that also increase risk. Authors provide serum creatine for 26% of the cohort, but notably provide only median and IQR, not allowing comparison of the number of patients with high values. Authors state that "renal function was not significantly different" between remdesivir and non-remdesivir patients, but this does not seem realistic given the prevalence of renal impairment and the contraindictions for remdesivir. Submit Corrections or Updates.
Retrospective 28,855 remdesivir patients with PSM matched controls, showing lower mortality with treatment. Submit Corrections or Updates.
Retrospective database analysis of 3,219 hospitalized patients in the USA. Very different results in the time period analysis (Table S2), and results significantly different to other studies for the same medications (e.g., heparin OR 3.06 [2.44-3.83]) suggest significant confounding by indication and confounding by time. Submit Corrections or Updates.
Retrospective 551 severe/critical COVID-19 patients showing higher mortality and higher risk of drug induced liver injury with remdesivir. Authors appear to have reversed the OR for remdesivir - use was more common in non-survivors (61% vs. 50%). Authors report 116 patients treated with HCQ but provide no results for HCQ. Submit Corrections or Updates.
Retrospective 444 hospitalized patients in Pakistan, showing lower mortality with remdesivir treatment in unadjusted results, not reaching statistical significance. Submit Corrections or Updates.
Retrospective 132 hospitalized COVID-19 patients in the USA, showing no significant difference in mortality with remdesivir in unadjusted results. Submit Corrections or Updates.
Retrospective 5,898 hospitalized patients in the USA, 2,374 receiving remdesivir treatment, showing no significant difference in mortality, and a longer time to hospital discharge with treatment. Submit Corrections or Updates.
Retrospective 220 COVID-19 patients with rheumatic disease in Japan, showing no significant difference in mortality with remdesivir treatment. Submit Corrections or Updates.
Comparative analysis between remdesivir trial GS-US-540-5773 and a retrospective SOC cohort with similar inclusion criteria, showing lower mortality and higher recovery at day 14 with remdesivir. Submit Corrections or Updates.
Early treatmentRetrospective · 18 patients · Singapore
Remdesivir for COVID-19
Outcome
Improvement
Relative Risk · 95% CI
Slower recovery and longer hospitalization
Not statistically significant · p = 0.6 (Slower recovery) and p = 0.31 (hospitalization)
Retrospective 18 immunocompromised pediatric COVID-19 patients in Singapore, showing slower viral clearance with remdesivir, without statistical significance. Submit Corrections or Updates.
Retrospective 51 ICU patients under mechanical ventilation, 25 treated with remdesivir, showing lower mortality with treatment. Submit Corrections or Updates.
Early treatmentRetrospective · 172 patients · USA · Dec 2021 – Feb 2022
Remdesivir for COVID-19
Fewer hosp./ER visits and lower progression
Statistically significant only for progression · p = 0.05 (Fewer hosp./ER visits) and p = 0.034 (progression)
Retrospective high-risk outpatients in the USA, 82 treated with remdesivir, 88 with sotrovimab, and 90 control patients, showing significantly lower combined hospitalization/ER visits with both treatments in unadjusted results. The dominant variant was omicron B.1.1.529. Submit Corrections or Updates.
Prospective study of 2,468 hospitalized COVID-19 patients in Iran, showing no significant difference with remdesivir treatment. IR.MUQ.REC.1399.013. Submit Corrections or Updates.
Prospective study of 400 hospitalized patients in the Philippines, showing higher progression with remdesivir in unadjusted results, without statistical significance. Submit Corrections or Updates.
Retrospective 3,966 COVID-19 patients, 1,115 with cancer, showing lower mortality with remdesivir and higher mortality with convalescent plasma. Submit Corrections or Updates.
Retrospective 125 mechanically ventilated ICU patients in Iran, showing lower mortality with remdesivir treatment in unadjusted results. Submit Corrections or Updates.
Late treatmentRCT · 108 patients · Egypt · Oct 2020 – Mar 2021
Remdesivir for COVID-19
Outcome
Improvement
Relative Risk · 95% CI
00.511.52+
← Remdesivir
reduces risk
Remdesivir
increases risk →
Higher mortality and lower discharge
Not statistically significant · p = 0.39 (mortality) and p = 0.39 (discharge) Trial compares with HCQ, results vs. placebo may differ
Small 108 patient RCT comparing HCQ vs. remdesivir in very late stage treatment. All patients received tocilizumab. There were significant unadjusted baseline differences in ventilation and ICU admission. REC-H-PhBSU-21011. Submit Corrections or Updates.
Retrospective 1,106 prostate cancer patients, showing higher mortality with remdesivir treatment. Submit Corrections or Updates.
Retrospective 15 pediatric patients hospitalized for severe COVID-19 requiring oxygen and high dependency/intensive care unit (HD/ICU) admission in Singapore, showing no improvement in deescalation from HD/ICU care with remdesivir, however the remdesivir group had higher disease severity. Submit Corrections or Updates.
Retrospective 183 hospitalized pediatric COVID-19 patients in Iran, showing no significant difference in mortality with remdesivir in unadjusted results. Submit Corrections or Updates.
Retrospective 514 COVID-19 outpatients showing no significant benefit with remdesivir therapy. Submit Corrections or Updates.
Retrospective 1,000 COVID+ hospitalized patients in India, showing lower mortality with famotidine and remdesivir in multivariable logistic regression. Submit Corrections or Updates.
Late treatmentRCT · 249 patients · multinational · Mar 2021 – Mar 2022
Remdesivir for COVID-19
No significant difference in outcomes seen
RCT 243 hospitalized COVID-19 patients with acute kidney injury, chronic kidney disease, or kidney failure showing no significant difference in all-cause mortality or invasive mechanical ventilation with remdesivir. The lower mortality at day 29 (without statistical significance) disappeared at day 60, consistent with remdesivir studies overall. Submit Corrections or Updates.
Retrospective 2,170 hospitalized COVID-19 patients showing no difference in mortality with remdesivir in unadjusted results. Submit Corrections or Updates.
WHO SOLIDARITY open-label RCT with 2,750 very late stage (76% on oxygen/ventilation) remdesivir patients, mortality relative risk RR 0.95 [0.81-1.11], p=0.50. Non-ventilated patients show a greater benefit, RR 0.86 [0.72-1.04], p = 0.13. Submit Corrections or Updates.
Late treatmentRCT · 584 patients · multinational · Mar – Apr 2020
Remdesivir for COVID-19
Outcome
Improvement
Relative Risk · 95% CI
00.511.52+
← Remdesivir
reduces risk
Remdesivir
increases risk →
Lower mortality with remdesivir
Not statistically significant · p = 0.5
Late stage (median 8 days from symptom onset) RCT 584 patients with moderate COVID-19 showing (non-statistically significant) lower mortality.

5-day remdesivir had significantly higher odds of a better clinical status distribution on the 7-point ordinal scale, odds ratio OR 1.65, p=0.02. The difference for 10-day remdesivir was not statistically significant, p=0.18. Submit Corrections or Updates.
Estimated 2,200 patient remdesivir late treatment RCT with results not reported over 9 months after estimated completion. Submit Corrections or Updates.
Late treatmentRetrospective · 12,487 patients · Japan
Remdesivir for COVID-19
Outcome
Improvement
Relative Risk · 95% CI
No significant difference in outcomes seen
Retrospective database analysis of 12,487 hospitalized patients in Japan, showing lower risk of oxygen requirement, but no significant difference in mortality or ventilation/ECMO. Submit Corrections or Updates.
Late treatmentRetrospective · 60 patients · Pakistan
Remdesivir for COVID-19
Outcome
Improvement
Relative Risk · 95% CI
00.511.52+
← Remdesivir
reduces risk
Remdesivir
increases risk →
Higher mortality and ventilation
Not statistically significant · p = 0.33 (mortality) and p = 0.15 (ventilation)
Small late stage (hospitalized, <12 days symptoms) remdesivir study showing non-statistically significant higher mortality with treatment.

No adjustments were made for differences in the groups. Remdesivir mean age was 49 vs. control 57. Baseline oxygen requirement was 13.4 liters treatment vs. 10.8 control. Potential confounding by indication. Submit Corrections or Updates.
Late treatmentRCT · 236 patients · China · Feb – Mar 2020
Remdesivir for COVID-19
Outcome
Improvement
Relative Risk · 95% CI
No significant difference in mortality
Small RCT with 237 hospitalized patients in China with severe COVID-19, not showing statistically significant benefits. 158 treatment patients and 79 control patients.

While too small for significance, the subgroup treated within 10 days showed reduced mortality RR 0.76, p = 0.58, and reduced median time to clinical improvement of 18 days vs. 23 days, hazard ratio 1.52 [0.95-2.43]. Submit Corrections or Updates.
Retrospective 7,158 hospitalized COVID-19 patients in the USA analyzing famotidine treatment, showing no significant difference in mortality with associated remdesivir treatment. Submit Corrections or Updates.
We perform ongoing searches of PubMed, medRxiv, Europe PMC, ClinicalTrials.gov, The Cochrane Library, Google Scholar, Research Square, ScienceDirect, Oxford University Press, the reference lists of other studies and meta-analyses, and submissions to the site c19early.org, which regularly receives notification of studies upon publication. Search terms are remdesivir and COVID-19 or SARS-CoV-2. Automated searches are performed twice daily, with all matches reviewed for inclusion. All studies regarding the use of remdesivir for COVID-19 that report a comparison with a control group are included in the main analysis. Sensitivity analysis is performed, excluding studies with major issues, epidemiological studies, and studies with minimal available information. Studies with major unexplained data issues, for example major outcome data that is impossible to be correct with no response from the authors, are excluded.
Fig. 32. Mid-recovery results can more accurately reflect efficacy when almost all patients recover. Mateja et al. confirm that intermediate viral load results more accurately reflect hospitalization/death.
We extracted effect sizes and associated data from all studies. If studies report multiple kinds of effects then the most serious outcome is used in pooled analysis, while other outcomes are included in the outcome-specific analyses. For example, if effects for mortality and cases are reported then they are both used in specific outcome analyses, while mortality is used for pooled analysis. If symptomatic results are reported at multiple times, we use the latest time, for example if mortality results are provided at 14 days and 28 days, the results at 28 days have preference. Mortality alone is preferred over combined outcomes. Outcomes with zero events in both arms are not used, the next most serious outcome with one or more events is used. For example, in low-risk populations with no mortality, a reduction in mortality with treatment is not possible, however a reduction in hospitalization, for example, is still valuable. Clinical outcomes are considered more important than viral outcomes. When basically all patients recover in both treatment and control groups, preference for viral clearance and recovery is given to results mid-recovery where available. After most or all patients have recovered there is little or no room for an effective treatment to do better, however faster recovery is valuable. An IPD meta-analysis confirms that intermediate viral load reduction is more closely associated with hospitalization/death than later viral load reduction162. If only individual symptom data is available, the most serious symptom has priority, for example difficulty breathing or low SpO2 is more important than cough.
Forest plots are computed using PythonMeta163 with the DerSimonian and Laird random-effects model (the fixed effect assumption is not plausible in this case) and inverse variance weighting. Results are presented with 95% confidence intervals. Heterogeneity among studies was assessed using the I2 statistic. When results provide an odds ratio, we compute the relative risk when possible, or convert to a relative risk according to Zhang et al. Reported confidence intervals and p-values are used when available, and adjusted values are used when provided. If multiple types of adjustments are reported propensity score matching and multivariable regression has preference over propensity score matching or weighting, which has preference over multivariable regression. Adjusted results have preference over unadjusted results for a more serious outcome when the adjustments significantly alter results. When needed, conversion between reported p-values and confidence intervals followed Altman, Altman (B), and Fisher's exact test was used to calculate p-values for event data. If continuity correction for zero values is required, we use the reciprocal of the opposite arm with the sum of the correction factors equal to 1167. Results are expressed with RR < 1.0 favoring treatment, and using the risk of a negative outcome when applicable (for example, the risk of death rather than the risk of survival). If studies only report relative continuous values such as relative times, the ratio of the time for the treatment group versus the time for the control group is used. Calculations are done in Python (3.14.8) with scipy (1.18.1), pythonmeta (1.26), numpy (2.5.4), statsmodels (0.15.0), and plotly (6.9.0). Mixed-effects meta-regression results are computed with R (4.4.0) using the metafor (4.6-0) and rms (6.8-0) packages, and using the most serious sufficiently powered outcome. For all statistical tests, a p-value less than 0.05 was considered statistically significant. Grobid 0.8.2 is used to parse PDF documents.
When evaluating potential effect modification across groups, we use an interaction test as described by Altman (C) et al. We compared the log-transformed relative risks using a z-test, deriving the standard error of the difference from the 95% confidence intervals. A two-sided interaction p-value of < 0.05 was considered a statistically significant difference in treatment effect between the groups.
Cochrane RoB 2/ROBINS-I are often used to evaluate studies, and have the advantage of providing standardized rules that can be applied with minimal understanding of the domain and study. However, the rules do not account for many real-world issues, often overemphasize or underemphasize others, and studies show low inter-rater reliability175. Certain domains are more applicable for these tools, however the time-sensitive nature of a pandemic, with significant mortality for every day of delay in evidence assessment, and the characteristics of COVID-19 make them inappropriate for this domain. This can be demonstrated with examples where expert RoB 2/ROBINS-I ratings do not match reality for COVID-19. Popp et al. use RoB 2 to classify Reis et al. as low risk of bias, however this is the opposite of reality—the trial not only has very high risk of bias, but has very high actual known bias, refusing to release data despite pledging to, reporting multiple impossible numbers, having blinding and randomization failure, and many other issues177. Axfors et al. use RoB 2 to classify Horby et al. as low risk of bias, however this is the opposite of reality—the very late treatment and excessive dosage used produces results with no relevance to recommended usage. HCQ shows poor results with late treatment and excessive dosage, and the combination shows harmB. Hempenius et al. use ROBINS-I to classify 33 studies for HCQ. The two rated as having the lowest risk of bias173,174 are far from the most informative. Both involve very late treatment, providing no information on recommended usage, and ROBINS-I does a very poor job of accounting for the impact of confounding factorsC.
Our quality evaluation focuses on known issues and bias, and the potential impact on outcomes, rather than just the risk of bias. The estimated potential impact of each confounding factor, and the direction of the impact is considered. For example, consider a study that shows significantly lower risk, the value of the study varies significantly if confounding points to an underestimate or an overestimate of efficacy. In one case, the real effect may be null, while the other case provides stronger evidence of efficacy (which may be greater than the study shows). Analysis focusing on the risk of bias, while simpler, may penalize studies for theoretical or technical issues that have no or minimal impact on outcomes. Analysis also depends on the outcome, for example certain issues are less relevant for objective outcomes such as mortality. Inaccurate penalization, and inaccurate high-quality evaluation in the face of known major issues affecting outcomes, increases in significance during a pandemic when immediate recognition of new evidence is critical, and when considering all global studies, as required during a pandemic. Investigators in other countries may have different customs for design, analysis, and reporting, and different English language skills, however they may not be less diligent or have greater bias. Investigators in lower-pharmaceutical-profit countries may have lower bias towards profitable interventions.
We have classified studies as early treatment if most patients are not already at a severe stage at the time of treatment (for example based on oxygen status or lung involvement), and treatment started within 5 days of the onset of symptoms. If studies contain a mix of early treatment and late treatment patients, we consider the treatment time of patients contributing most to the events (for example, consider a study where most patients are treated early but late treatment patients are included, and all mortality events were observed with late treatment patients). We note that a shorter time may be preferable. Antivirals are typically only considered effective when used within a shorter timeframe, for example 0-36 or 0-48 hours for oseltamivir, with longer delays not being effective100,101.
This is a living analysis and is updated regularly. Submit updates or corrections with the form below. We received no funding, this research is done in our spare time. We have no affiliation with any pharmaceutical companies, supplement companies, governments, political parties, or advocacy organizations.
A summary of study results is below. Please submit updates and corrections at the bottom of this page.
A summary of study results is below. Please submit updates and corrections at https://c19early.org/smeta.html.
Effect extraction follows pre-specified rules as detailed above and gives priority to more serious outcomes. For pooled analyses, the first (most serious) outcome is used, which may differ from the effect a paper focuses on. Other outcomes are used in outcome specific analyses.
Chew, 3/16/2023, retrospective, Singapore, peer-reviewed, median age 56.0, 7 authors, study period 23 January, 2020 - 15 April, 2020, average treatment delay 4.0 days. abnormal ALT, 68.0% higher, OR 1.68, p = 0.40, treatment 12, control 151, adjusted per study, multivariable, RR approximated with OR.
Choi, 7/15/2024, retrospective, China, peer-reviewed, mean age 74.0, 8 authors, study period 16 March, 2022 - 31 December, 2022. risk of death, 266.7% higher, HR 3.67, p = 0.07, treatment 308, control 13,656, remdesivir+paxlovid vs. paxlovid, day 90.
risk of ICU admission, 600.0% higher, HR 7.00, p < 0.001, treatment 308, control 13,656, remdesivir+paxlovid vs. paxlovid, day 90.
ventilatory support, 685.7% higher, HR 7.86, p < 0.001, treatment 308, control 13,656, remdesivir+paxlovid vs. paxlovid, day 90.
AKI, 181.6% higher, HR 2.82, p < 0.001, treatment 308, control 13,656, remdesivir+paxlovid vs. paxlovid, day 90.
Gottlieb, 12/22/2021, Double Blind Randomized Controlled Trial, multiple countries, peer-reviewed, 30 authors, study period 18 September, 2020 - 8 April, 2021, average treatment delay 5.0 days, trial NCT04501952 (history) (PINETREE). risk of death/hospitalization, 87.0% lower, RR 0.13, p = 0.008, treatment 2 of 279 (0.7%), control 15 of 283 (5.3%), NNT 22, adjusted per study, COVID-19 related hospitalization or death from any cause @day 28, primary outcome.
risk of hospitalization, 71.8% lower, RR 0.28, p = 0.009, treatment 5 of 279 (1.8%), control 18 of 283 (6.4%), NNT 22.
risk of no recovery, 29.1% lower, RR 0.71, p = 0.31, treatment 43 of 66 (65.2%), control 45 of 60 (75.0%), adjusted per study, inverted to make RR<1 favor treatment, alleviation of symptoms @day 14.
risk of no recovery, 47.9% lower, RR 0.52, p = 0.003, treatment 108 of 169 (63.9%), control 132 of 165 (80.0%), NNT 6.2, adjusted per study, inverted to make RR<1 favor treatment, post-hoc alleviation of symptoms @day 14.
Jittamala, 7/20/2023, Randomized Controlled Trial, multiple countries, peer-reviewed, median age 30.1, 42 authors, study period 30 September, 2021 - 10 June, 2022, average treatment delay 2.4 days, trial NCT05041907 (history) (PLATCOV). risk of hospitalization, 66.3% lower, RR 0.34, p = 1.00, treatment 0 of 67 (0.0%), control 1 of 69 (1.4%), NNT 69, relative risk is not 0 because of continuity correction due to zero events (with reciprocal of the contrasting arm).
relative clearance half-life, 28.9% better, RR 0.71, p < 0.001, treatment median 12.8 IQR 8.0 n=67, control median 18.0 IQR 10.5 n=69, primary outcome.
Killingley, 3/31/2022, prospective, United Kingdom, peer-reviewed, mean age 21.8, 31 authors, study period March 2021 - July 2021, trial NCT04865237 (history). peak symptom score, 60.1% higher, RR 1.60, p = 0.43, treatment mean 8.48 (±8.1) n=6, control mean 5.3 (±7.7) n=12, relative peak symptom score.
Kneidinger, 9/9/2022, retrospective, Germany, peer-reviewed, 11 authors, study period 1 January, 2022 - 20 March, 2022, lung transplant patients. risk of severe case, 19.9% lower, RR 0.80, p = 0.71, treatment 6 of 46 (13.0%), control 28 of 172 (16.3%), NNT 31.
Ong, 1/20/2023, retrospective, Singapore, peer-reviewed, 12 authors, average treatment delay 3.5 days. recovery time, 75.0% higher, relative time 1.75, p = 0.60, treatment 4, control 14, defervescence.
hospitalization time, 55.6% higher, relative time 1.56, p = 0.31, treatment 4, control 14.
time to viral-, 60.7% higher, relative time 1.61, p = 0.14, treatment 4, control 14.
Piccicacco, 8/1/2022, retrospective, USA, peer-reviewed, 7 authors, study period 27 December, 2021 - 4 February, 2022, average treatment delay 4.0 days, ER visit. risk of death, 65.6% lower, RR 0.34, p = 1.00, treatment 0 of 82 (0.0%), control 1 of 90 (1.1%), NNT 90, relative risk is not 0 because of continuity correction due to zero events (with reciprocal of the contrasting arm), day 29.
risk of hospitalization, 30.2% lower, RR 0.70, p = 0.47, treatment 7 of 82 (8.5%), control 11 of 90 (12.2%), NNT 27, day 29.
risk of hospitalization/ER, 52.5% lower, RR 0.48, p = 0.05, treatment 9 of 82 (11.0%), control 21 of 90 (23.3%), NNT 8.1, odds ratio converted to relative risk, day 29.
risk of progression, 78.0% lower, RR 0.22, p = 0.03, treatment 2 of 82 (2.4%), control 10 of 90 (11.1%), NNT 12, day 29.
Seah, 12/14/2023, retrospective, Singapore, peer-reviewed, median age 2.5, 9 authors, study period 1 January, 2020 - 18 March, 2022, excluded in exclusion analyses: unadjusted results with significant baseline differences. no deescalation, 128.6% higher, RR 2.29, p = 0.57, treatment 2 of 7 (28.6%), control 1 of 8 (12.5%), day 5.
Siami, 7/22/2024, retrospective, Iran, peer-reviewed, 5 authors, study period May 2021 - September 2021. risk of hospitalization, 70.0% higher, OR 1.70, p = 0.20, treatment 341, control 148, adjusted per study, multivariable, RR approximated with OR.
Effect extraction follows pre-specified rules as detailed above and gives priority to more serious outcomes. For pooled analyses, the first (most serious) outcome is used, which may differ from the effect a paper focuses on. Other outcomes are used in outcome specific analyses.
Ader, 9/14/2021, Randomized Controlled Trial, multiple countries, peer-reviewed, 17 authors, study period 22 March, 2020 - 21 January, 2021, average treatment delay 9.0 days, trial NCT04315948 (history) (DISCOVERY). risk of death, 6.4% lower, RR 0.94, p = 0.77, treatment 34 of 414 (8.2%), control 37 of 418 (8.9%), NNT 156, adjusted per study, odds ratio converted to relative risk, day 28.
risk of death, 11.7% lower, RR 0.88, p = 0.76, treatment 21 of 414 (5.1%), control 24 of 418 (5.7%), NNT 149, day 15.
risk of 7-point scale, 9.9% lower, OR 0.90, p = 0.39, treatment 414, control 418, inverted to make OR<1 favor treatment, 28 days, RR approximated with OR.
risk of 7-point scale, 2.0% higher, OR 1.02, p = 0.85, treatment 414, control 418, inverted to make OR<1 favor treatment, 15 days, RR approximated with OR.
Ali (B), 1/19/2022, Randomized Controlled Trial, Canada, peer-reviewed, 85 authors, average treatment delay 8.0 days, trial NCT04330690 (history) (CATCO). risk of death, 12.0% lower, RR 0.88, p = 0.21, treatment 127 of 634 (20.0%), control 152 of 647 (23.5%), NNT 29, day 60.
risk of death, 17.0% lower, RR 0.83, p = 0.09, treatment 117 of 634 (18.5%), control 145 of 647 (22.4%), NNT 25, in hospital.
risk of death, 20.6% lower, RR 0.79, p = 0.59, treatment 14 of 634 (2.2%), control 18 of 647 (2.8%), NNT 174, day 15.
risk of mechanical ventilation, 47.0% lower, RR 0.53, p < 0.001, treatment 46 of 634 (7.3%), control 89 of 647 (13.8%), NNT 15, day 60.
risk of no recovery, 9.0% lower, RR 0.91, p = 0.41, treatment 634, control 647, clinical status, day 60.
hospitalization time, 11.1% higher, relative time 1.11, p = 0.04, treatment median 10.0 IQR 12.0 n=634, control median 9.0 IQR 11.0 n=647.
Alsaraj, 1/8/2024, Randomized Controlled Trial, Iraq, peer-reviewed, 6 authors, study period September 2021 - February 2022, excluded in exclusion analyses: potential data issue. risk of death, 83.5% higher, HR 1.83, p = 0.26, treatment 9 of 52 (17.3%), control 5 of 53 (9.4%), adjusted per study, multivariable, Cox proportional hazards, day 30.
Alshamrani, 2/15/2023, retrospective, Saudi Arabia, peer-reviewed, 3 authors, study period March 2020 - January 2021. risk of death, 17.3% lower, RR 0.83, p = 0.003, treatment 137 of 246 (55.7%), control 725 of 1,078 (67.3%), NNT 8.6, adjusted per study, odds ratio converted to relative risk, propensity score matching, multivariable.
risk of progression, 4.3% lower, RR 0.96, p = 0.12, treatment 215 of 246 (87.4%), control 984 of 1,078 (91.3%), NNT 26, adjusted per study, odds ratio converted to relative risk, AKI, ARDS, multi-organ failure, or mortality, propensity score matching, multivariable.
ICU time, 42.6% higher, relative time 1.43, p = 0.003, treatment 245, control 995, propensity score matching.
hospitalization time, 7.4% lower, relative time 0.93, p = 0.25, treatment 246, control 1,078, propensity score matching.
Amirizadeh, 11/1/2023, retrospective, Iran, peer-reviewed, 5 authors, average treatment delay 8.04 (treatment) 7.45 (control) days. risk of death, 3.3% higher, RR 1.03, p = 1.00, treatment 31 of 35 (88.6%), control 30 of 35 (85.7%).
ventilation time, 52.2% higher, relative time 1.52, p = 0.17, treatment mean 7.03 (±8.92) n=35, control mean 4.62 (±5.24) n=35.
ICU time, 27.0% higher, relative time 1.27, p = 0.23, treatment mean 14.03 (±11.55) n=35, control mean 11.05 (±9.1) n=35.
hospitalization time, 24.2% higher, relative time 1.24, p = 0.22, treatment mean 16.11 (±11.52) n=35, control mean 12.97 (±9.65) n=35.
Angleitner, 2/26/2025, retrospective, Germany, peer-reviewed, mean age 60.0, 3 authors. time to viral-, 223.0% higher, relative time 3.23, p = 0.004, treatment 8, control 55, Kaplan-Meier.
Anzalone, 7/2/2024, retrospective, USA, peer-reviewed, 18 authors, study period 1 January, 2021 - 31 December, 2022. risk of death, 33.0% higher, HR 1.33, p < 0.001, adjusted per study, propensity score matching, multivariable, day 45.
risk of mechanical ventilation, 8.0% lower, HR 0.92, p < 0.001, adjusted per study, propensity score matching, multivariable, day 45.
Arch, 6/21/2021, prospective, propensity score matching, United Kingdom, preprint, 10 authors, average treatment delay 6.0 days. risk of death, 19.9% lower, RR 0.80, p = 0.03, treatment 203 of 1,491 (13.6%), control 777 of 4,676 (16.6%), NNT 33, odds ratio converted to relative risk, PSM, day 28.
risk of death, 18.0% lower, RR 0.82, p = 0.12, treatment 140 of 1,502 (9.3%), control 565 of 4,728 (12.0%), NNT 38, odds ratio converted to relative risk, PSM, day 14.
risk of mechanical ventilation, 68.0% higher, RR 1.68, p = 0.003, treatment 106 of 1,498 (7.1%), control 153 of 4,602 (3.3%), odds ratio converted to relative risk, PSM, day 28.
Liver dysfunction, 47.0% higher, RR 1.47, p < 0.001, treatment 124 of 1,443 (8.6%), control 241 of 4,483 (5.4%), odds ratio converted to relative risk, PSM, day 28.
Arfijanto, 5/4/2023, retrospective, Indonesia, peer-reviewed, 8 authors, study period June 2021 - December 2021, excluded in exclusion analyses: unadjusted results with no group details. delayed viral clearance, 0.9% lower, RR 0.99, p = 1.00, treatment 17 of 44 (38.6%), control 46 of 118 (39.0%), NNT 288.
Aweimer, 3/29/2023, retrospective, Germany, peer-reviewed, median age 67.0, 19 authors, study period 1 March, 2020 - 31 August, 2021. risk of death, 13.0% higher, RR 1.13, p = 0.33, treatment 40 of 51 (78.4%), control 68 of 98 (69.4%), day 100.
Barrat-Due, 7/13/2021, Double Blind Randomized Controlled Trial, Norway, peer-reviewed, 43 authors, average treatment delay 8.0 days, trial NCT04321616 (history) (NOR-Solidarity). risk of death, no change, RR 1.00, p = 1.00, treatment 3 of 42 (7.1%), control 4 of 57 (7.0%), adjusted per study.
risk of death, 35.7% higher, RR 1.36, p = 0.70, treatment 3 of 42 (7.1%), control 3 of 57 (5.3%), day 60.
risk of death, 54.8% lower, RR 0.45, p = 0.63, treatment 1 of 42 (2.4%), control 3 of 57 (5.3%), NNT 35, day 28.
risk of no recovery, 47.4% higher, RR 1.47, p = 0.01, treatment mean 16.8 (±11.4) n=42, control mean 11.4 (±10.4) n=76, relative CAT total score at 3 months.
risk of no recovery, 42.9% higher, RR 1.43, p = 0.009, treatment mean 3.0 (±1.7) n=42, control mean 2.1 (±1.8) n=76, relative CAT dyspnea score at 3 months.
risk of no recovery, 23.8% higher, RR 1.24, p = 0.10, treatment mean 2.6 (±1.5) n=42, control mean 2.1 (±1.6) n=76, relative CAT fatigue score at 3 months.
risk of no recovery, 50.0% higher, RR 1.50, p = 0.04, treatment mean 1.8 (±1.6) n=42, control mean 1.2 (±1.5) n=76, relative CAT cough score at 3 months.
Bavaro, 5/19/2023, retrospective, Italy, peer-reviewed, median age 75.0, 27 authors, study period 1 July, 2021 - 15 March, 2022. risk of severe case, 7.0% lower, RR 0.93, p < 0.001, treatment 120, control 211, propensity score weighting.
Behboodikhah, 9/15/2022, retrospective, Iran, peer-reviewed, 8 authors. risk of death, 37.5% lower, OR 0.62, p = 0.21, treatment 1,214, control 960, adjusted per study, multivariable, RR approximated with OR.
Beigel, 10/8/2020, Randomized Controlled Trial, USA, peer-reviewed, 40 authors, average treatment delay 9.0 days, trial NCT04280705 (history) (ACTT-1). risk of death, 27.0% lower, HR 0.73, p = 0.07, treatment 541, control 521, day 29.
risk of death, 45.0% lower, HR 0.55, p = 0.005, treatment 541, control 521, day 15.
risk of no recovery, 22.5% lower, RR 0.78, p < 0.001, treatment 541, control 521, inverted to make RR<1 favor treatment.
Bowen, 8/25/2022, retrospective, USA, peer-reviewed, 10 authors, study period 1 March, 2020 - 31 March, 2021. risk of death, 57.0% higher, HR 1.57, p < 0.001, treatment 817, control 3,814, Table S2, Cox proportional hazards, day 30.
Burhan, 9/25/2023, retrospective, Indonesia, peer-reviewed, 26 authors, study period January 2020 - March 2021. risk of death, 14.8% higher, RR 1.15, p = 0.23, treatment 33 of 43 (76.7%), control 345 of 516 (66.9%).
Cacho, 10/31/2022, retrospective, Spain, peer-reviewed, 15 authors, study period 1 November, 2021 - 28 February, 2022, average treatment delay 5.0 days. risk of death, 79.8% higher, RR 1.80, p = 0.70, treatment 5 of 57 (8.8%), control 2 of 41 (4.9%).
risk of severe case, 43.9% higher, RR 1.44, p = 0.58, treatment 10 of 57 (17.5%), control 5 of 41 (12.2%).
risk of moderate/severe case, 72.6% higher, RR 1.73, p = 0.09, treatment 24 of 57 (42.1%), control 10 of 41 (24.4%).
risk of no hospital discharge, 91.8% higher, RR 1.92, p = 0.35, treatment 8 of 57 (14.0%), control 3 of 41 (7.3%).
Chang, 12/29/2023, retrospective, Taiwan, peer-reviewed, 2 authors. risk of death, 184.7% higher, OR 2.85, p = 0.04, treatment 81, control 81, adjusted per study, multivariable, RR approximated with OR.
Diaz, 8/19/2021, retrospective, USA, peer-reviewed, 45 authors. risk of death, 34.7% lower, HR 0.65, p = 0.01, treatment 33 of 286 (11.5%), control 173 of 852 (20.3%), NNT 11, adjusted per study, odds ratio converted to relative risk, multivariable, Cox proportional hazards, day 60.
risk of death, 44.0% lower, HR 0.56, p = 0.04, treatment 286, control 852, adjusted per study, multivariable, Cox proportional hazards, day 30, RR approximated with OR.
Drouin, 3/19/2024, retrospective, USA, peer-reviewed, median age 56.0, 13 authors, study period August 2020 - September 2021, excluded in exclusion analyses: substantial unadjusted confounding by indication likely. risk of severe case, 46.4% higher, RR 1.46, p < 0.001, treatment 52 of 102 (51.0%), control 135 of 354 (38.1%), adjusted per study, odds ratio converted to relative risk, multivariable.
El-Solh, 10/20/2020, retrospective, database analysis, USA, peer-reviewed, 5 authors, excluded in exclusion analyses: very late stage, >50% on oxygen/ventilation at baseline; substantial unadjusted confounding by indication likely; significant confounding by contraindications possible. risk of death, 29.0% lower, HR 0.71, p = 0.03, treatment 63 of 219 (28.8%), control 202 of 424 (47.6%), NNT 5.3, adjusted per study, multivariable.
Elavarasi, 8/12/2021, retrospective, India, peer-reviewed, 31 authors, study period April 2021 - June 2021, excluded in exclusion analyses: unadjusted results with no group details; substantial unadjusted confounding by indication likely. risk of death, 136.6% higher, RR 2.37, p < 0.001, treatment 146 of 403 (36.2%), control 207 of 1,352 (15.3%).
Elec, 3/14/2022, retrospective, Romania, peer-reviewed, 9 authors, study period 1 March, 2020 - 31 May, 2021, excluded in exclusion analyses: substantial confounding by time possible due to significant changes in SOC and treatment propensity during the study period. risk of death, 19.3% lower, RR 0.81, p = 0.66, treatment 7 of 38 (18.4%), control 29 of 127 (22.8%), NNT 23.
risk of mechanical ventilation, 10.9% lower, RR 0.89, p = 0.73, treatment 8 of 38 (21.1%), control 30 of 127 (23.6%), NNT 39.
risk of ICU admission, 71.9% higher, RR 1.72, p = 0.01, treatment 18 of 38 (47.4%), control 35 of 127 (27.6%).
Elhadi, 4/30/2021, prospective, Libya, peer-reviewed, 21 authors, study period 29 May, 2020 - 30 December, 2020, excluded in exclusion analyses: unadjusted results with no group details. risk of death, 10.9% higher, RR 1.11, p = 0.65, treatment 14 of 21 (66.7%), control 267 of 444 (60.1%), day 60.
Flisiak, 11/3/2020, retrospective, Poland, peer-reviewed, 23 authors, study period 1 March, 2020 - 31 August, 2020, SARSTer trial. risk of death, 48.9% lower, RR 0.51, p = 0.18, treatment 5 of 122 (4.1%), control 17 of 211 (8.1%), NNT 25, odds ratio converted to relative risk, all patients, day 28.
no clinical improvement, 56.5% lower, RR 0.44, p = 0.01, treatment 9 of 122 (7.4%), control 36 of 211 (17.1%), NNT 10, odds ratio converted to relative risk.
Floridia, 12/1/2025, retrospective, Italy, peer-reviewed, mean age 60.3, 22 authors, study period January 2023 - March 2024. risk of long COVID, 23.0% higher, OR 1.23, p = 0.37, treatment 318, control 1,216, RR approximated with OR.
Fried, 8/28/2020, retrospective, database analysis, USA, peer-reviewed, 11 authors, excluded in exclusion analyses: excessive unadjusted differences between groups; substantial unadjusted confounding by indication likely. risk of death, 61.2% lower, RR 0.39, p = 0.02, treatment 4 of 48 (8.3%), control 2,510 of 11,673 (21.5%), NNT 7.6, remdesivir vs. non-remdesivir.
risk of mechanical ventilation, 36.8% higher, RR 1.37, p = 0.25, treatment 11 of 48 (22.9%), control 1,956 of 11,673 (16.8%), remdesivir vs. non-remdesivir.
Garibaldi, 11/20/2020, retrospective, USA, preprint, 10 authors. risk of death, 20.0% lower, HR 0.80, p = 0.44, treatment 23 of 303 (7.6%), control 45 of 303 (14.9%), adjusted per study, day 28.
risk of no improvement, 35.0% better, RR 0.65, p < 0.001, treatment 52 of 303 (17.2%), control 80 of 303 (26.4%), NNT 11, adjusted per study, day 28.
Goldberg, 3/9/2021, retrospective, Israel, peer-reviewed, 7 authors. hospitalization time, 9.2% lower, relative time 0.91, p = 0.77, treatment 29, control 113.
risk of no viral clearance, 0.1% lower, RR 1.00, p = 0.98, treatment 29, control 113, relative change in Ct values.
Hagman, 9/26/2023, retrospective, Sweden, peer-reviewed, 9 authors, average treatment delay 6.0 days. risk of death, no change, HR 1.00, p = 0.97, treatment 105, control 213, adjusted per study, multivariable, day 60.
risk of death, no change, HR 1.00, p = 0.99, treatment 105, control 213, adjusted per study, multivariable, day 28.
risk of death, 20.0% lower, HR 0.80, p = 0.74, treatment 105, control 213, adjusted per study, multivariable, day 7.
risk of progression, 40.0% higher, OR 1.40, p = 0.31, treatment 105, control 213, adjusted per study, multivariable, Table S7, RR approximated with OR.
risk of no viral clearance, 28.6% lower, HR 0.71, p = 0.11, treatment 105, control 213, adjusted per study, inverted to make HR<1 favor treatment, multivariable.
Haji Aghajani, 4/29/2021, retrospective, Iran, peer-reviewed, 7 authors. risk of death, 18.6% lower, HR 0.81, p = 0.49, treatment 46, control 945, univariate Cox proportional regression.
Hartantri, 2/9/2023, retrospective, Indonesia, peer-reviewed, 10 authors, study period 1 March, 2020 - 31 December, 2020. risk of death, 11.0% lower, HR 0.89, p = 0.84, adjusted per study, mild/moderate, multivariable, Cox proportional hazards.
risk of death, 24.0% lower, HR 0.76, p = 0.53, adjusted per study, severe, multivariable, Cox proportional hazards.
Heiran, 1/7/2026, retrospective, Iran, peer-reviewed, 19 authors, study period 20 March, 2020 - 20 March, 2021. risk of death, 21.7% higher, HR 1.22, p = 0.20, adjusted per study, multivariable, Cox proportional hazards.
Ho, 10/31/2023, retrospective, USA, peer-reviewed, 9 authors, study period 1 January, 2020 - 31 August, 2021. risk of death, 62.0% higher, OR 1.62, p < 0.001, treatment 5,294, control 21,151, adjusted per study, multivariable, RR approximated with OR.
Kawther, 9/9/2024, retrospective, Iraq, peer-reviewed, 6 authors, study period December 2020 - December 2021. risk of death, 8.7% higher, OR 1.09, p = 0.86, treatment 111, control 340, adjusted per study, RR approximated with OR.
Kim (B), 3/15/2023, retrospective, South Korea, peer-reviewed, 5 authors, study period 1 November, 2021 - 30 April, 2022. risk of death, 1612.4% higher, RR 17.12, p = 0.22, treatment 14 of 145 (9.7%), control 0 of 22 (0.0%), continuity correction due to zero event (with reciprocal of the contrasting arm).
Kuno, 8/9/2021, retrospective, propensity score matching, USA, peer-reviewed, 6 authors. risk of death, 0.9% lower, RR 0.99, p = 0.96, treatment 214 of 999 (21.4%), control 216 of 999 (21.6%), NNT 499, PSM.
risk of mechanical ventilation, no change, RR 1.00, p = 1.00, treatment 140 of 999 (14.0%), control 140 of 999 (14.0%), PSM.
risk of ICU admission, 17.1% higher, RR 1.17, p = 0.05, treatment 260 of 999 (26.0%), control 222 of 999 (22.2%), PSM.
Kurniyanto, 2/28/2022, retrospective, Indonesia, peer-reviewed, 11 authors, excluded in exclusion analyses: unadjusted results with no group details; substantial unadjusted confounding by indication likely. risk of death, 460.0% higher, RR 5.60, p < 0.001, treatment 7 of 45 (15.6%), control 12 of 432 (2.8%).
Lewandowski, 3/7/2024, retrospective, Poland, peer-reviewed, 15 authors. risk of death, 20.9% higher, OR 1.21, p = 0.55, RR approximated with OR.
Liao, 1/15/2024, retrospective, Taiwan, peer-reviewed, median age 73.0, 10 authors, study period May 2022 - September 2022, excluded in exclusion analyses: unadjusted results with no group details. risk of death, 25.4% higher, RR 1.25, p = 0.67, treatment 37 of 59 (62.7%), control 3 of 6 (50.0%), day 120.
Mahajan, 3/20/2021, Randomized Controlled Trial, India, peer-reviewed, 3 authors, study period June 2020 - December 2020, average treatment delay 6.84 days. risk of death, 76.5% higher, RR 1.76, p = 0.47, treatment 5 of 34 (14.7%), control 3 of 36 (8.3%).
risk of mechanical ventilation, 111.8% higher, RR 2.12, p = 0.42, treatment 4 of 34 (11.8%), control 2 of 36 (5.6%).
Malundo, 7/14/2022, retrospective, Philippines, peer-reviewed, 16 authors, study period 12 March, 2021 - 9 September, 2021, excluded in exclusion analyses: unadjusted results with no group details. risk of death, 16.5% higher, RR 1.17, p = 0.45, treatment 24 of 115 (20.9%), control 197 of 1,100 (17.9%).
Milan, 4/30/2024, retrospective, Philippines, peer-reviewed, median age 11.0, 5 authors, study period 1 April, 2020 - 31 August, 2021, excluded in exclusion analyses: unadjusted results with no group details. risk of death, 34.4% higher, RR 1.34, p = 0.56, treatment 1 of 8 (12.5%), control 16 of 172 (9.3%), day 45.
risk of mechanical ventilation, 122.4% higher, RR 2.22, p = 0.15, treatment 3 of 8 (37.5%), control 29 of 172 (16.9%), day 45.
risk of ICU admission, 419.0% higher, RR 5.19, p < 0.001, treatment 7 of 8 (87.5%), control 29 of 172 (16.9%).
Mitsushima, 2/21/2023, retrospective, Japan, peer-reviewed, 3 authors. risk of death, 44.0% higher, OR 1.44, p < 0.01, adjusted per study, multivariable, RR approximated with OR.
Mohammed, 10/3/2025, retrospective, USA, peer-reviewed, mean age 57.0, 12 authors, study period 1 March, 2020 - 31 March, 2021. risk of death, 66.7% lower, RR 0.33, p = 0.62, treatment 1 of 101 (1.0%), control 3 of 101 (3.0%), NNT 51, propensity score matching.
hospitalization time, 117.5% higher, relative time 2.17, p < 0.001, treatment mean 13.7 (±12.8) n=101, control mean 6.3 (±5.5) n=101, propensity score matching.
bradycardia, 58.1% higher, RR 1.58, p = 0.01, treatment 49 of 101 (48.5%), control 31 of 101 (30.7%), propensity score matching.
Mozaffari, 8/9/2023, retrospective, USA, peer-reviewed, 11 authors, study period 1 December, 2020 - 30 April, 2022. risk of death, 25.0% lower, HR 0.75, p < 0.001, treatment 14,169, control 5,341, adjusted per study, propensity score matching, Cox proportional hazards, day 28.
risk of death, 30.0% lower, HR 0.70, p < 0.001, treatment 14,169, control 5,341, adjusted per study, propensity score matching, Cox proportional hazards, day 14.
Mozaffari (B), 10/1/2021, retrospective, USA, peer-reviewed, 12 authors. risk of death, 12.0% lower, HR 0.88, p = 0.003, treatment 4,441 of 28,855 (15.4%), control 5,499 of 28,855 (19.1%), NNT 27, adjusted per study, PSM, Cox proportional hazards, day 28.
risk of death, 24.0% lower, HR 0.76, p < 0.001, treatment 3,057 of 28,855 (10.6%), control 4,437 of 28,855 (15.4%), NNT 21, adjusted per study, PSM, Cox proportional hazards, day 14.
Mulhem, 4/7/2021, retrospective, database analysis, USA, peer-reviewed, 3 authors, excluded in exclusion analyses: substantial unadjusted confounding by indication likely; substantial confounding by time possible due to significant changes in SOC and treatment propensity during the study period. risk of death, 85.7% higher, RR 1.86, p = 0.54, treatment 1 of 8 (12.5%), control 515 of 3,211 (16.0%), adjusted per study, odds ratio converted to relative risk, logistic regression.
Muntean, 12/19/2023, retrospective, Romania, peer-reviewed, 8 authors. risk of death, 45.1% higher, RR 1.45, p = 0.03, treatment 71 of 287 (24.7%), control 45 of 264 (17.0%).
Mustafa, 12/29/2021, retrospective, Pakistan, peer-reviewed, 7 authors, excluded in exclusion analyses: unadjusted results with no group details. risk of death, 32.7% lower, RR 0.67, p = 0.21, treatment 16 of 200 (8.0%), control 29 of 244 (11.9%), NNT 26.
Nadeem, 8/12/2023, retrospective, USA, peer-reviewed, mean age 59.0, 6 authors, study period 1 March, 2020 - 28 February, 2022, excluded in exclusion analyses: unadjusted results with no group details. risk of death, 12.5% higher, RR 1.12, p = 1.00, treatment 12 of 96 (12.5%), control 4 of 36 (11.1%).
Ohl, 7/15/2021, retrospective, propensity score matching, USA, peer-reviewed, 9 authors. risk of death, 6.0% higher, HR 1.06, p = 0.66, treatment 143 of 1,172 (12.2%), control 124 of 1,172 (10.6%), adjusted per study, PSM, Cox proportional hazards regression, day 30.
hospitalization time, 100% higher, relative time 2.00, p < 0.001, treatment 1,172, control 1,172, PSM, Cox proportional hazards regression.
Oku, 9/6/2022, retrospective, Japan, peer-reviewed, 8 authors, study period 3 June, 2020 - 30 June, 2021, excluded in exclusion analyses: unadjusted results with no group details. risk of death, 40.2% higher, RR 1.40, p = 0.59, treatment 3 of 46 (6.5%), control 8 of 172 (4.7%), unadjusted, odds ratio converted to relative risk.
Olender, 7/24/2020, retrospective, USA, peer-reviewed, 33 authors. risk of death, 58.8% lower, RR 0.41, p = 0.001, treatment 24 of 312 (7.7%), control 102 of 818 (12.5%), odds ratio converted to relative risk, weighted multivariable logistic regression, day 14.
Pasquini, 8/23/2020, retrospective, Italy, peer-reviewed, 9 authors. risk of death, 16.2% lower, RR 0.84, p = 0.03, treatment 14 of 25 (56.0%), control 24 of 26 (92.3%), NNT 2.8, adjusted per study, inverted to make RR<1 favor treatment, odds ratio converted to relative risk, multivariate.
Pourhoseingholi, 5/26/2021, prospective, Iran, preprint, mean age 57.9, 11 authors, study period 2 February, 2020 - 20 July, 2020, average treatment delay 7.4 days. risk of death, 2.0% higher, HR 1.02, p = 0.92, treatment 42 of 123 (34.1%), control 297 of 2,345 (12.7%), adjusted per study, multivariable, Cox proportional hazards.
Punzalan, 2/28/2023, prospective, Philippines, peer-reviewed, mean age 56.0, 17 authors, study period October 2020 - September 2021. risk of death, 42.0% higher, RR 1.42, p = 0.12, treatment 47 of 224 (21.0%), control 26 of 176 (14.8%).
risk of progression, 58.9% higher, RR 1.59, p = 0.001, treatment 93 of 224 (41.5%), control 46 of 176 (26.1%).
Raad, 8/26/2022, retrospective, multiple countries, preprint, 52 authors, study period January 2020 - November 2020. risk of death, 42.0% lower, OR 0.58, p = 0.009, adjusted per study, multivariable, day 30, RR approximated with OR.
Salehi, 3/11/2022, retrospective, Iran, preprint, mean age 62.0, 11 authors, study period April 2021 - September 2021, excluded in exclusion analyses: unadjusted results with no group details. risk of death, 36.6% lower, RR 0.63, p = 0.01, treatment 17 of 40 (42.5%), control 57 of 85 (67.1%), NNT 4.1.
Sarhan, 11/2/2021, Randomized Controlled Trial, Egypt, peer-reviewed, 8 authors, study period 1 October, 2020 - 10 March, 2021, this trial compares with another treatment - results may be better when compared to placebo, trial NCT04779047 (history), excluded in exclusion analyses: very late stage, >50% on oxygen/ventilation at baseline; significant unadjusted differences between groups. risk of death, 34.6% higher, RR 1.35, p = 0.39, treatment 15 of 52 (28.8%), control 12 of 56 (21.4%).
risk of no hospital discharge, 34.6% higher, RR 1.35, p = 0.39, treatment 15 of 52 (28.8%), control 12 of 56 (21.4%).
Schmidt, 11/12/2021, retrospective, USA, peer-reviewed, 42 authors, study period 17 March, 2020 - 11 February, 2021, excluded in exclusion analyses: confounding by indication is likely and adjustments do not consider COVID-19 severity at baseline. risk of severe case, 509.0% higher, OR 6.09, p < 0.001, treatment 43, control 434, adjusted per study, propensity score matching, multivariable, RR approximated with OR.
Shamsi, 7/17/2023, retrospective, Iran, peer-reviewed, 4 authors, study period 1 March, 2020 - 1 August, 2021, excluded in exclusion analyses: unadjusted results with no group details. risk of death, 22.6% higher, RR 1.23, p = 0.63, treatment 8 of 53 (15.1%), control 16 of 130 (12.3%).
Siraj, 2/28/2022, retrospective, India, peer-reviewed, median age 56.0, 13 authors, study period March 2020 - December 2020. risk of death, 52.9% lower, RR 0.47, p < 0.001, treatment 108 of 413 (26.2%), control 197 of 587 (33.6%), adjusted per study, inverted to make RR<1 favor treatment, odds ratio converted to relative risk, multivariable.
Sise, 6/24/2024, Double Blind Randomized Controlled Trial, placebo-controlled, multiple countries, peer-reviewed, mean age 69.0, 24 authors, study period March 2021 - March 2022, trial NCT04745351 (history) (REDPINE). risk of death, 5.8% higher, RR 1.06, p = 0.89, treatment 55 of 166 (33.1%), control 26 of 83 (31.3%), last followup, registry.
risk of death, 0.1% higher, RR 1.00, p = 1.00, treatment 51 of 163 (31.3%), control 25 of 80 (31.2%), day 60.
risk of death, 17.0% lower, HR 0.83, p = 0.39, treatment 41 of 163 (25.2%), control 23 of 80 (28.7%), NNT 28, Cox proportional hazards, day 29.
risk of death/intubation, 18.0% lower, HR 0.82, p = 0.61, treatment 48 of 163 (29.4%), control 26 of 80 (32.5%), NNT 33, Cox proportional hazards, day 29.
clinical status, 16.0% lower, OR 0.84, p = 0.50, treatment 163, control 80, day 29, RR approximated with OR.
clinical status, 5.0% higher, OR 1.05, p = 0.85, treatment 163, control 80, day 15, RR approximated with OR.
Sokolski, 2/28/2024, retrospective, Poland, peer-reviewed, 11 authors, excluded in exclusion analyses: unadjusted results with no group details. risk of death, no change, HR 1.00, p = 1.00, treatment 88, control 460, Cox proportional hazards, day 90.
SOLIDARITY Trial Consortium, 10/15/2020, Randomized Controlled Trial, multiple countries, peer-reviewed, 15 authors, trial NCT04315948 (history) (SOLIDARITY). risk of death, 5.0% lower, RR 0.95, p = 0.53, treatment 301 of 2,743 (11.0%), control 303 of 2,708 (11.2%), NNT 464, day 28.
Spinner, 8/21/2020, Randomized Controlled Trial, multiple countries, peer-reviewed, 30 authors, study period 15 March, 2020 - 18 April, 2020, average treatment delay 8.0 days, trial NCT04292730 (history). 5 or 10 day remdesivir vs. control 28 day mortality, 34.9% lower, RR 0.65, p = 0.50, treatment 5 of 384 (1.3%), control 4 of 200 (2.0%), NNT 143, day 28.
Tong, 12/31/2025, Randomized Controlled Trial, Australia, trial NCT04483960 (history) (ASCOT). Estimated 2,200 patient RCT with results unknown and over 9 months late.
Tsuzuki, 3/10/2021, retrospective, Japan, peer-reviewed, 21 authors, average treatment delay 6.0 days. risk of death, 4.0% higher, HR 1.04, p = 0.21, treatment 69 of 824 (8.4%), control 285 of 11,663 (2.4%), adjusted per study, day 30.
risk of mechanical ventilation or ECMO, 1.7% lower, HR 0.98, p = 0.68, treatment 48 of 824 (5.8%), control 98 of 11,663 (0.8%), adjusted per study.
risk of progression, 15.0% lower, HR 0.85, p = 0.68, treatment 559 of 824 (67.8%), control 1,784 of 11,663 (15.3%), adjusted per study.
Ullah, 11/29/2020, retrospective, Pakistan, peer-reviewed, 8 authors. risk of death, 100% higher, RR 2.00, p = 0.33, treatment 8 of 30 (26.7%), control 4 of 30 (13.3%).
risk of mechanical ventilation, 250.0% higher, RR 3.50, p = 0.15, treatment 7 of 30 (23.3%), control 2 of 30 (6.7%).
Wang (B), 4/29/2020, Randomized Controlled Trial, China, peer-reviewed, 46 authors, study period 6 February, 2020 - 12 March, 2020, average treatment delay 11.0 days. all patients, 8.6% higher, RR 1.09, p = 1.00, treatment 22 of 158 (13.9%), control 10 of 78 (12.8%), day 28.
<10 days from symptoms, 24.3% lower, RR 0.76, p = 0.58, treatment 8 of 71 (11.3%), control 7 of 47 (14.9%), NNT 28, day 28.
>10 days from symptoms, 47.6% higher, RR 1.48, p = 0.76, treatment 12 of 84 (14.3%), control 3 of 31 (9.7%), day 28.
Yeramaneni, 2/28/2021, retrospective, USA, peer-reviewed, 6 authors, study period 11 February, 2020 - 8 May, 2020. risk of death, 24.0% higher, OR 1.24, p = 0.87, treatment 32, control 7,126, adjusted per study, multivariable, day 30, RR approximated with OR.
Viral infection and replication involves attachment, entry, uncoating and release, genome replication and transcription, translation and protein processing, assembly and budding, and release. Each step can be disrupted by therapeutics.
When administered late in infection, HCQ may enhance viral egress by further increasing lysosomal pH beyond the effect of ORF3a's water channel activity, thereby promoting lysosomal exocytosis, inactivating degradative enzymes, and facilitating the release of SARS-CoV-2 particles into the extracellular environment169,170. Research also suggests potential cardioprotective effects at lower doses, but cardiotoxicity with excessive dosage171. Bobrowski et al. also indicate negative effects if HCQ and remdesivir are combined.
Peters (B) et al. is subject to confounding by calendar-time (SOC evolved rapidly early in the pandemic, the linear covariate does not reflect non-linear SOC changes and hospital specific effects), hospital type (non-treatment hospitals were tertiary university centers), confounding by indication (4/7 hospitals initiated treatment on deterioration), immortal-time bias for as-treated (exposure assigned after baseline), significant differences for other experimental treatments, potential overadjustment from collider bias (steroid use and indication bias), limited baseline severity information, differences in hospice referral propensity across hospitals, unadjusted difference in time from onset to admission, difference in PCR positivity, and other factors. Mahévas et al. is subject to confounding by hospital (treatment highly dependent on the hospital, different SOC/ICU transfer practices, not included in PS), immortal time (only partly addressed in sensitivity analysis), co-treatment differences, calendar-time (SOC evolved rapidly early in the pandemic), binary coding for age (age ≥65 despite steep age-risk gradient), residual imbalance (variables dropped from PS), a composite outcome dependent on hospital triage/capacity, and other factors.