Antiandrogens reduce COVID-19 risk: real-time meta-analysis of 49 studies

Meta-analysis49 studies · 120K patientsc19early.org

Antiandrogens for COVID-19

Serious outcome risk
Antiandrogens
Control
Outcome (studies)
Improvement
Relative risk · 95% CI
All studies (49)30%
Mortality (32)37%
Ventilation (14)47%
ICU admission (11)36%
Hospitalization (16)32%
Progression (4)54%
Recovery (11)42%
Cases (12)8%
RCTs (17)58%
RCT mortality (13)62%
Prophylaxis (25)7%
Early (6)44%
Late (18)63%
after exclusions
00.511.5+
← Antiandrogens
reduce risk
Increased
risk →
Abstract
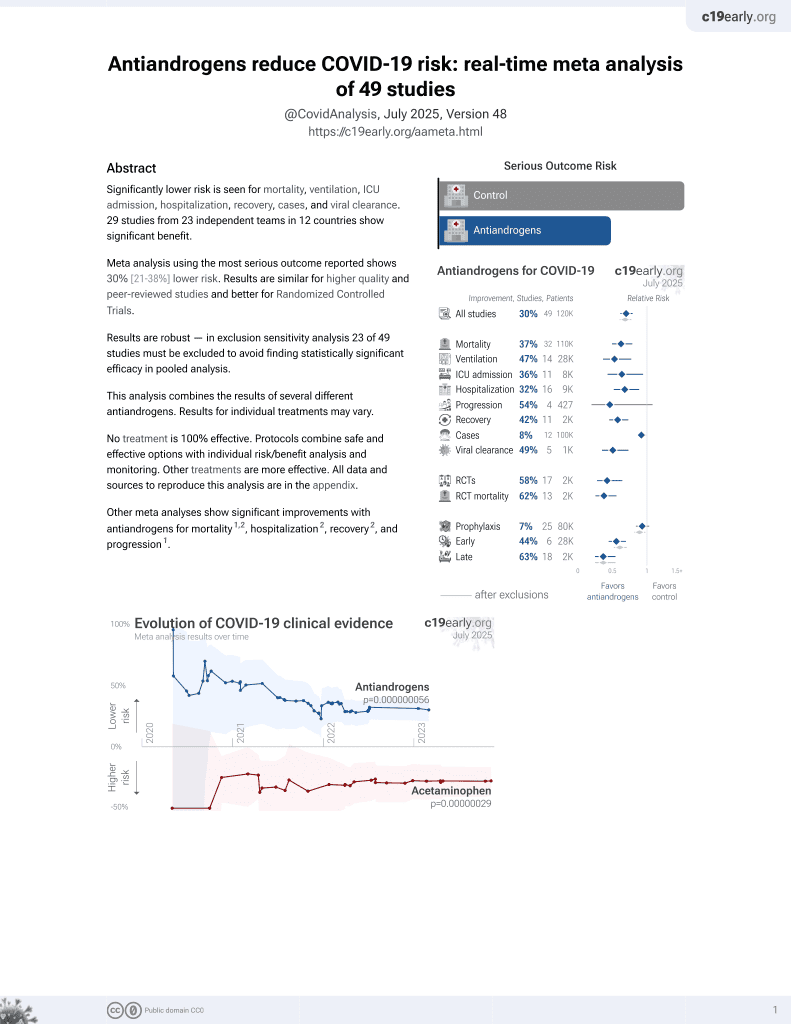
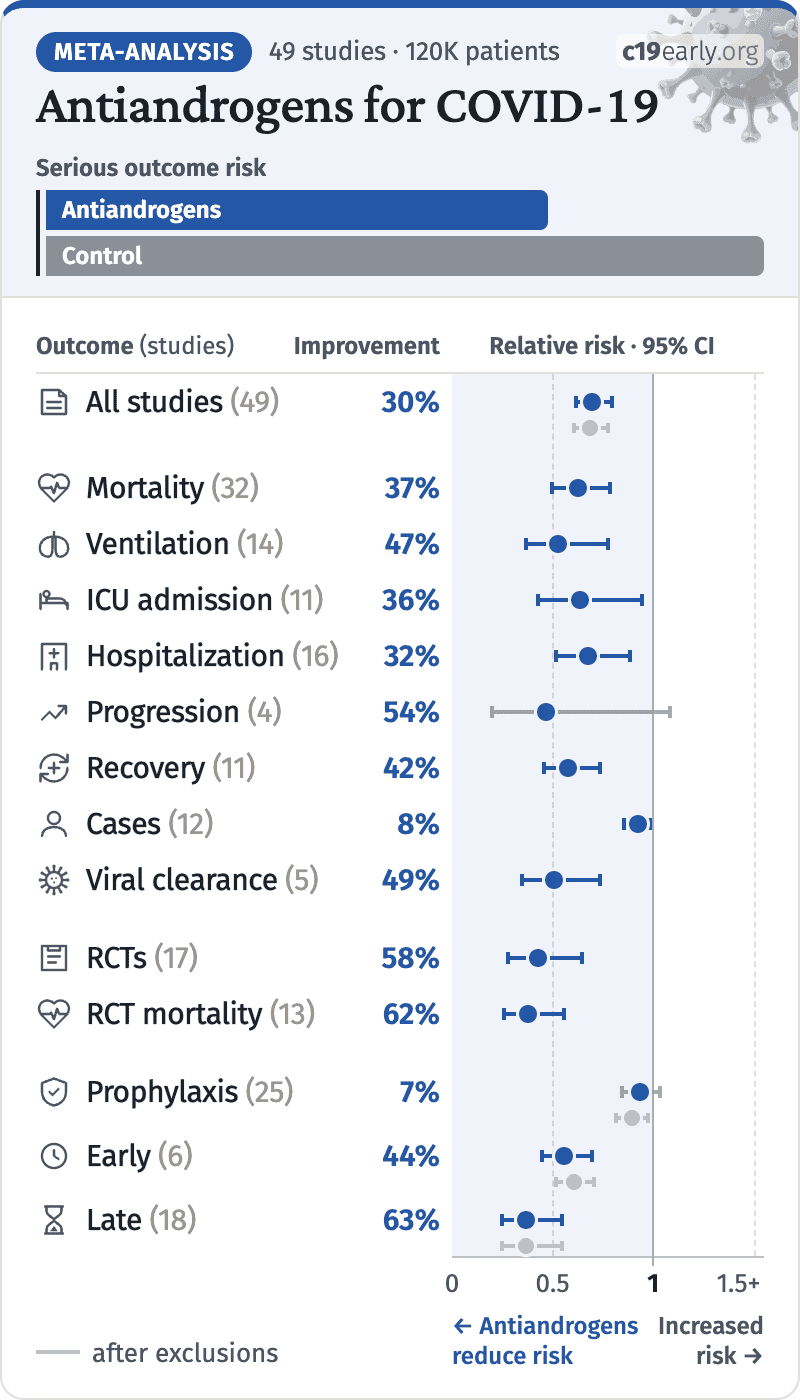
Significantly lower risk is seen for mortality, ventilation, ICU admission, hospitalization, recovery, cases, and viral clearance. 29 studies from 23 independent teams in 12 countries show significant benefit.
Meta-analysis using the most serious outcome reported shows 30% [21‑38%] lower risk. Results are similar for higher quality and peer-reviewed studies and better for Randomized Controlled Trials.
Results are robust—in worst case exclusion sensitivity analysis 23 of 49 studies must be excluded before statistical significance is lost.
Meta-analysis49 studies · 120K patientsc19early.org

Antiandrogens for COVID-19

Serious outcome risk
Antiandrogens
Control
Outcome (studies)
Improvement
Relative risk · 95% CI
All studies (49)30%
Mortality (32)37%
Ventilation (14)47%
ICU admission (11)36%
Hospitalization (16)32%
Progression (4)54%
Recovery (11)42%
Cases (12)8%
RCTs (17)58%
RCT mortality (13)62%
Prophylaxis (25)7%
Early (6)44%
Late (18)63%
after exclusions
00.511.5+
← Antiandrogens
reduce risk
Increased
risk →
This analysis combines the results of several different antiandrogens. Results for individual treatments may vary.
No treatment is 100% effective. Protocols combine safe and effective options with individual risk/benefit analysis and monitoring. Other treatments are more effective. All data and sources to reproduce this analysis are in the appendix.
Other meta-analyses show significant improvements with antiandrogens for mortality1,2, hospitalization2, recovery2, and progression1.
Evolution of COVID-19 clinical evidence Meta-analysis results over time Antiandrogens p=0.000000056 Acetaminophen p=0.00000021 2020 2021 2022 2023 2024 2025 2026 Lowerrisk Higherrisk c19early.org October 2026 50% 0% -50%
Antiandrogens for COVID-19 — Highlights
Antiandrogens reduce risk with very high confidence for mortality, ventilation, hospitalization, recovery, viral clearance, and in pooled analysis, high confidence for ICU admission and cases, and low confidence for progression.
Combined results of several different antiandrogens.
7th treatment shown effective in September 2020, now with p = 0.000000056 from 49 studies.
Real-time updates and corrections with a consistent protocol for 226 treatments. Outcome specific analysis and combined evidence from all studies including treatment delay, a primary confounding factor.
October 2026

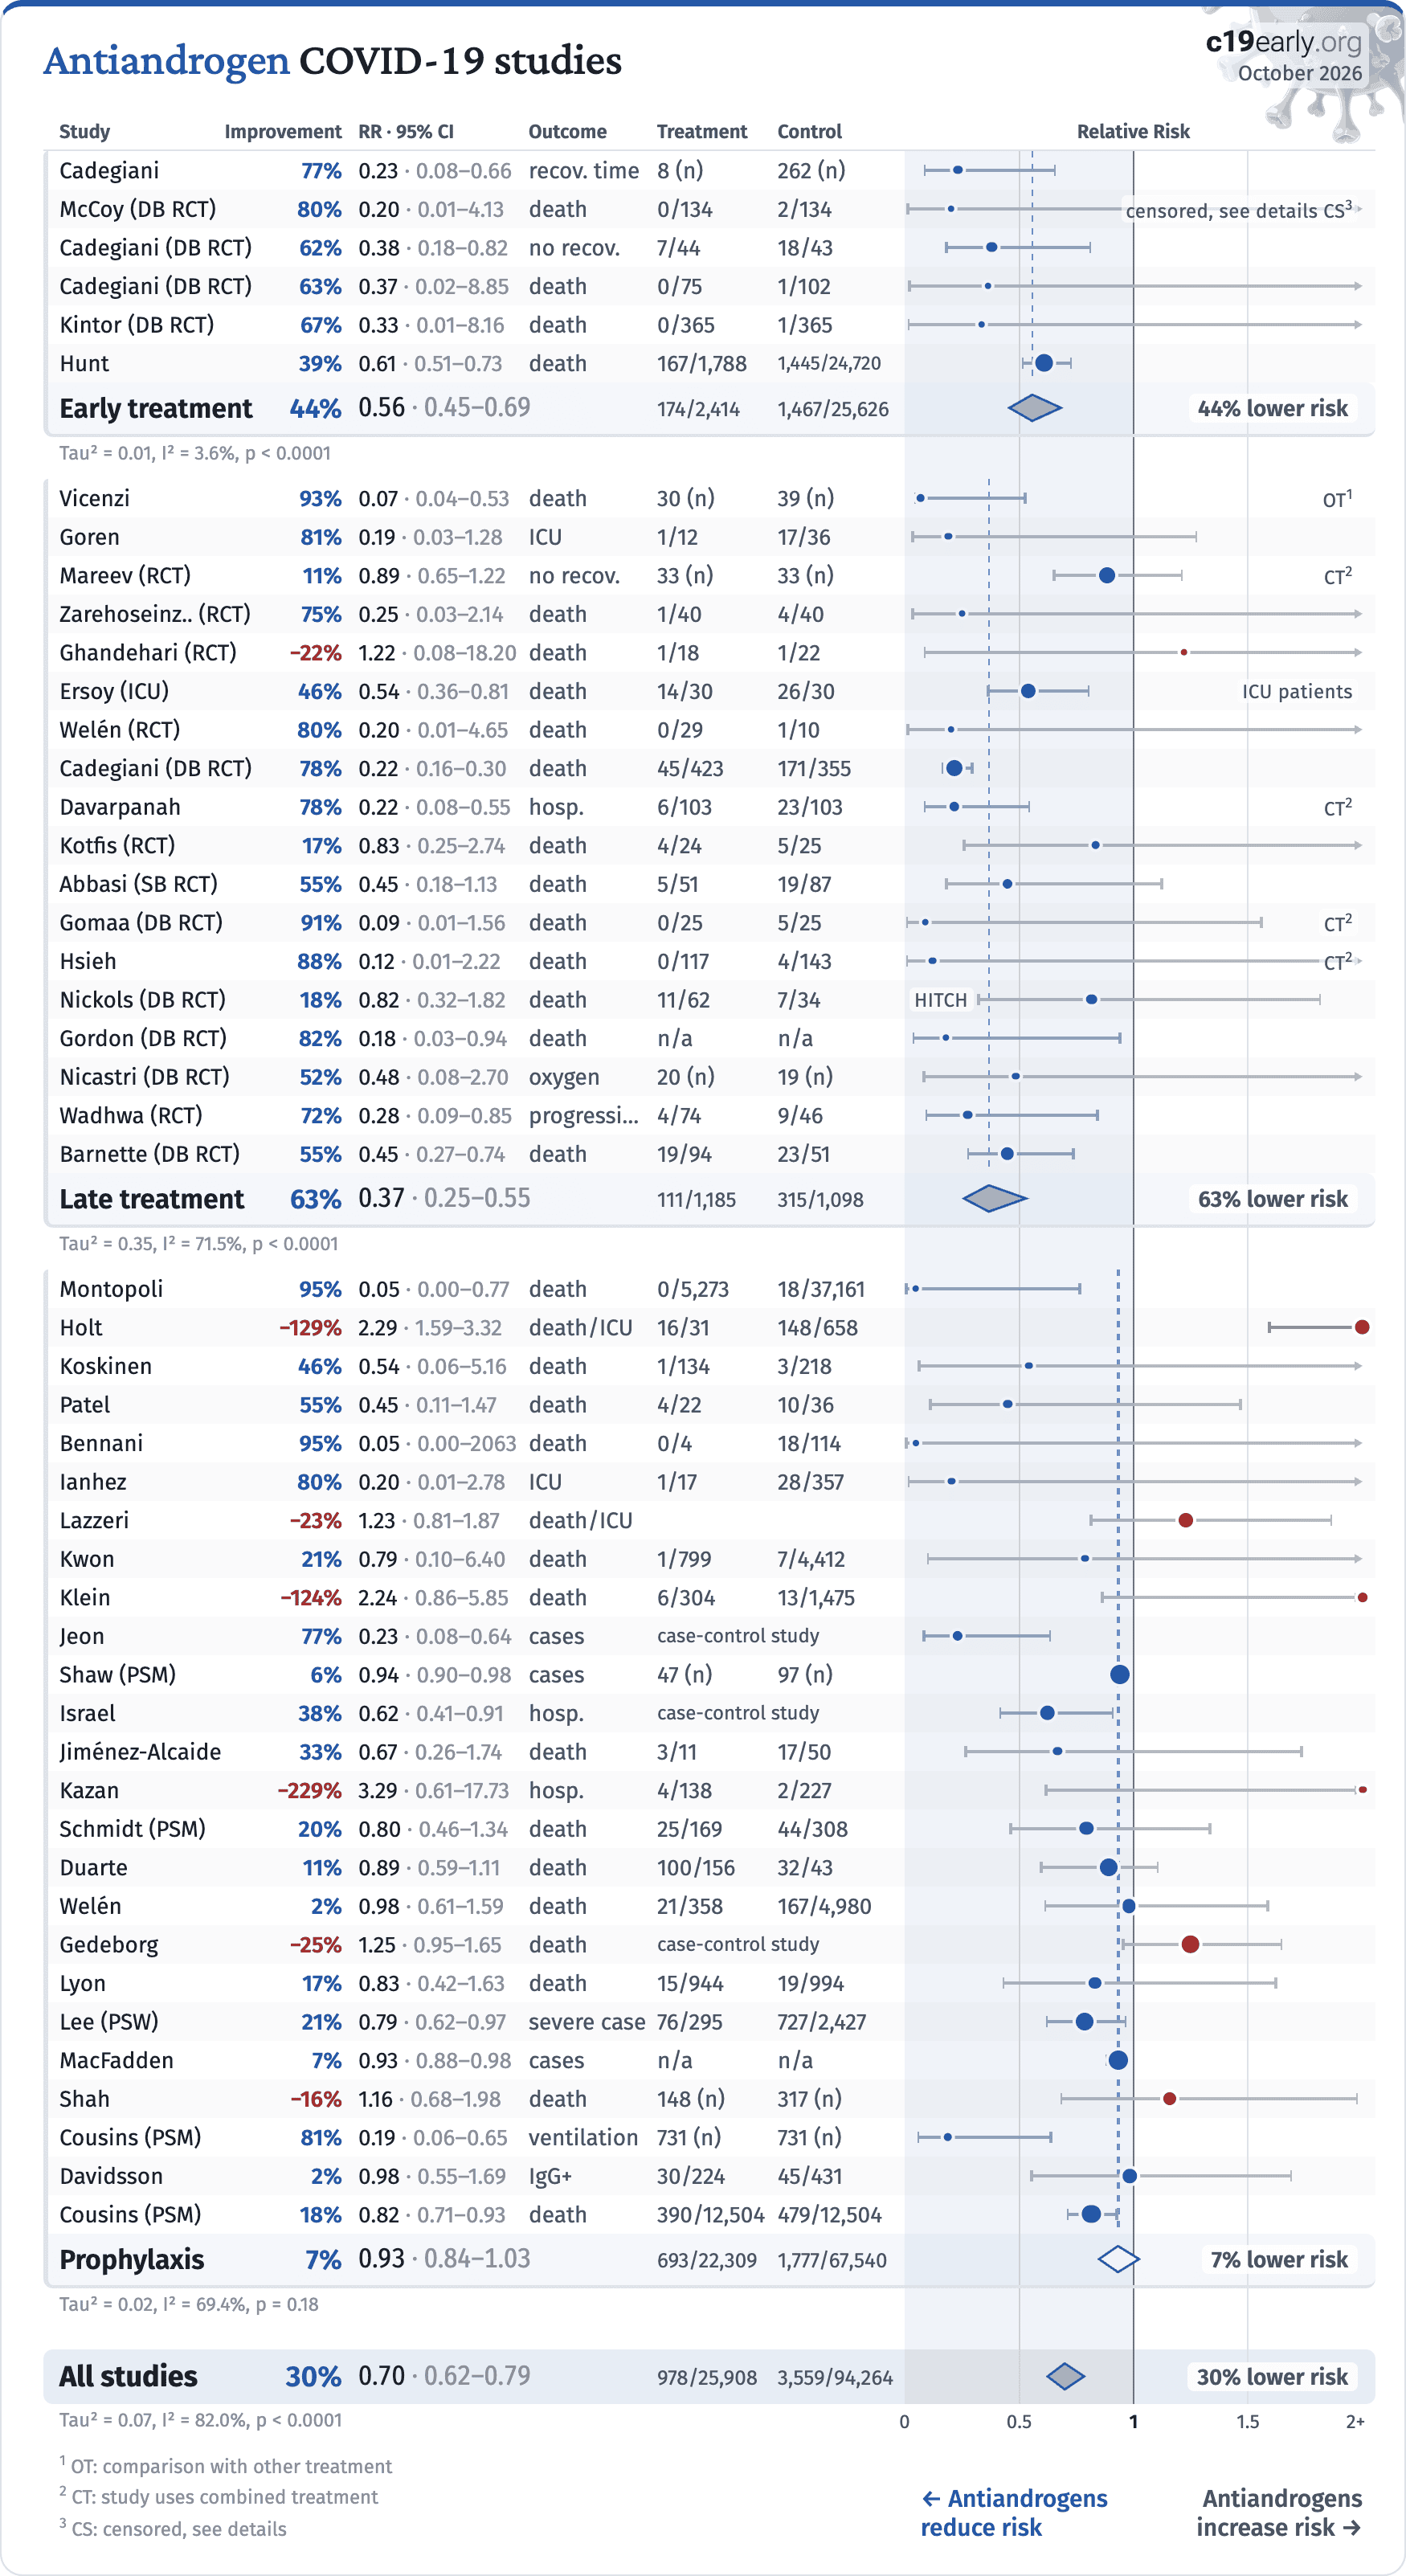
Antiandrogen COVID-19 studies

StudyImprovementRR · 95% CIOutcomeTreatmentControlRelative Risk
Early treatment44%0.56 · 0.45–0.69174/2,4141,467/25,62644% lower risk
Tau² = 0.01, I² = 3.6%, p < 0.0001
Late treatment63%0.37 · 0.25–0.55111/1,185315/1,09863% lower risk
Tau² = 0.35, I² = 71.5%, p < 0.0001
Prophylaxis7%0.93 · 0.84–1.03693/22,3091,777/67,5407% lower risk
Tau² = 0.02, I² = 69.4%, p = 0.18
All studies30%0.70 · 0.62–0.79978/25,9083,559/94,26430% lower risk
Tau² = 0.07, I² = 82.0%, p < 0.000100.511.52+
1 OT: comparison with other treatment
2 CT: study uses combined treatment
3 CS: censored, see details
Rotate screen for more detailsIncrease width for more details
← Antiandrogens
reduce risk
Antiandrogens
increase risk →
B
Loading..
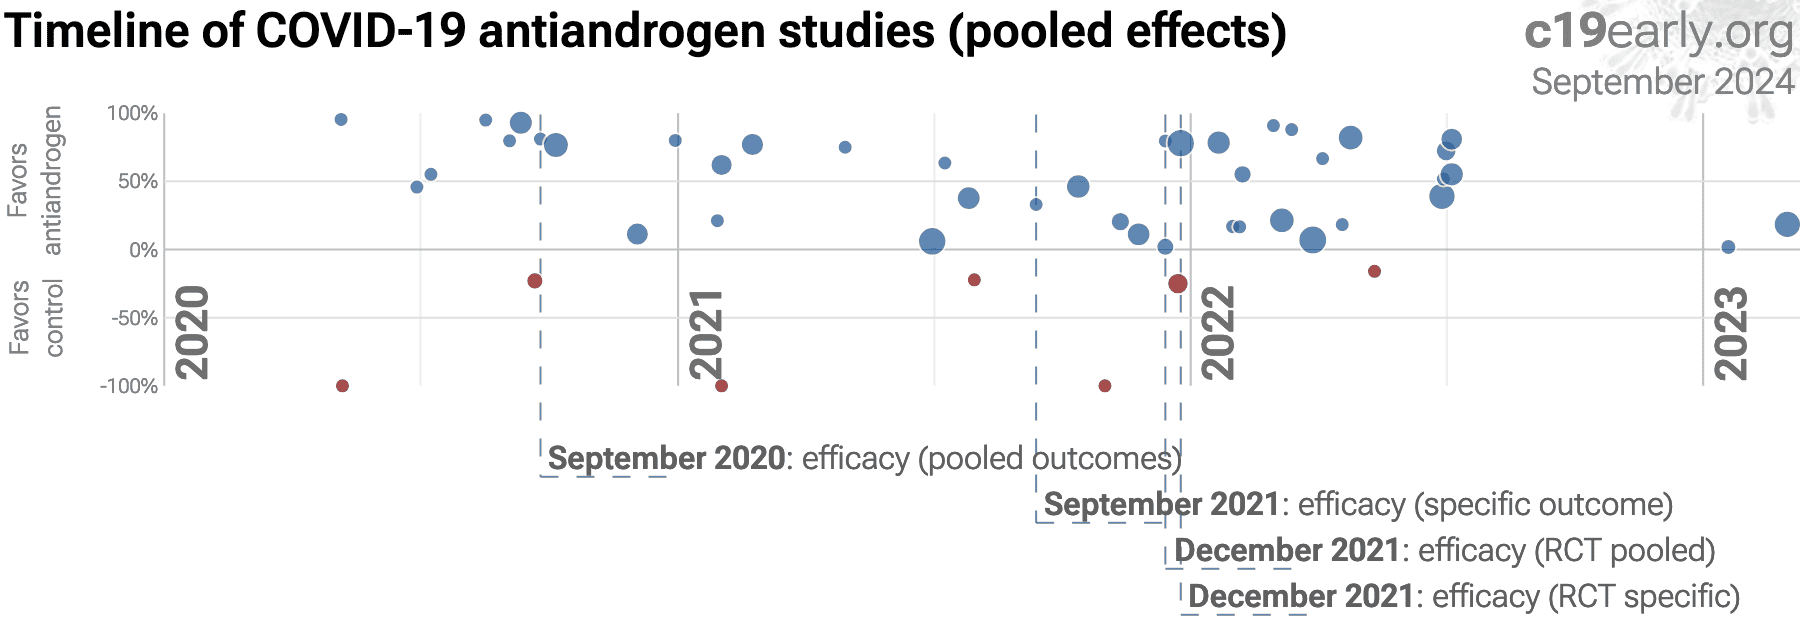
Fig. 1. A. Random-effects meta-analysis. This plot shows pooled effects, see the specific outcome analyses for individual outcomes. Analysis validating pooled outcomes for COVID-19 can be found below. Effect extraction is pre-specified, using the most serious outcome reported. For details see the appendix. B. Timeline of results in antiandrogen studies. The marked dates indicate the time when efficacy was known with a statistically significant improvement of ≥10% from ≥3 studies for pooled outcomes, one or more specific outcome, pooled outcomes in RCTs, and one or more specific outcome in RCTs. Efficacy based on RCTs only was delayed by 14.6 months, compared to using all studies. Efficacy based on specific outcomes was delayed by 11.6 months, compared to using pooled outcomes.
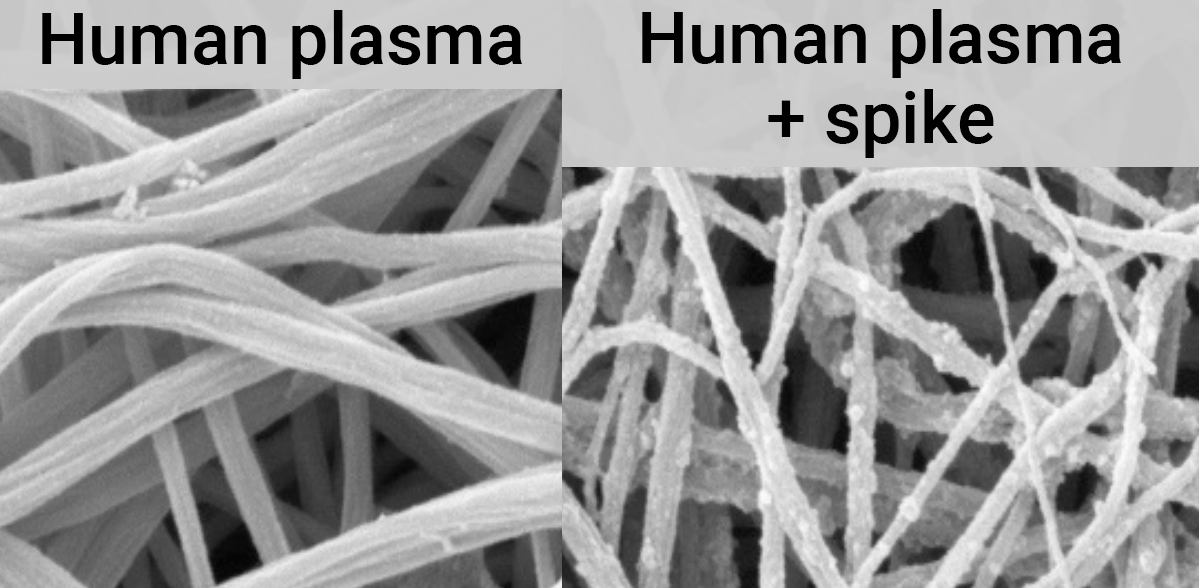
Fig. 2. SARS-CoV-2 spike protein fibrin binding leads to thromboinflammation and neuropathology, from3.
SARS-CoV-2 infection primarily begins in the upper respiratory tract and may progress to the lower respiratory tract, other tissues, and the nervous and cardiovascular systems, which may lead to cytokine storm, pneumonia, ARDS, neurological injury4-20 and cognitive deficits7,12, cardiovascular complications21-27, DNA damage28-31, organ failure, and death. Even mild untreated infections may result in persistent cognitive deficits32—the spike protein binds to fibrin leading to fibrinolysis-resistant blood clots, thromboinflammation, and neuropathology. Minimizing replication as early as possible is recommended.
SARS-CoV-2 infection and replication involves the complex interplay of 500+ host and viral proteins and other factorsA,33-40, providing many therapeutic targets for which many existing compounds have known activity. Scientists have predicted that over 12,000 compounds may reduce COVID-19 risk41, either by directly minimizing infection or replication, by supporting immune system function, or by minimizing secondary complications.
We analyze all significant controlled studies of Antiandrogens for COVID-19. Search methods, inclusion criteria, effect extraction criteria (more serious outcomes have priority), all individual study data, PRISMA answers, and statistical methods are detailed in Appendix 1. We present random-effects meta-analysis results for all studies, studies within each treatment stage, individual outcomes, peer-reviewed studies, Randomized Controlled Trials (RCTs), and higher quality studies.
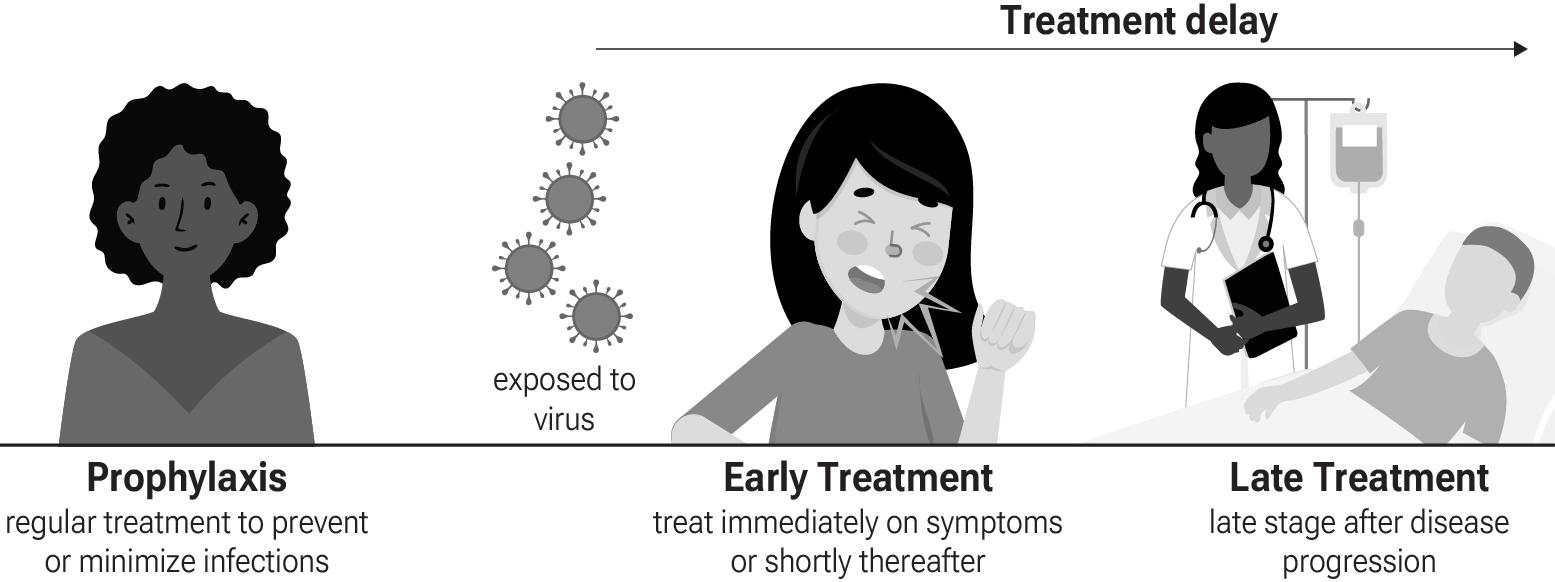
Fig. 3 shows stages of possible treatment for COVID-19. Prophylaxis refers to regularly taking medication before becoming sick, in order to prevent or minimize infection. Early treatment refers to treatment immediately or soon after symptoms appear, while late treatment refers to more delayed treatment.
regular treatment to prevent or minimize infectionstreat immediately on symptoms or shortly thereafterlate stage after disease progressionexposed to virusEarly TreatmentProphylaxisTreatment delayLate Treatment
Fig. 3. Treatment stages.
An in silico study supports the efficacy of antiandrogens49.
An in vitro study supports the efficacy of antiandrogens50.
2 in vivo animal studies support the efficacy of antiandrogens51,52.
Preclinical research is an important part of the development of treatments, however results may be very different in clinical trials. Preclinical results are not used in this paper.
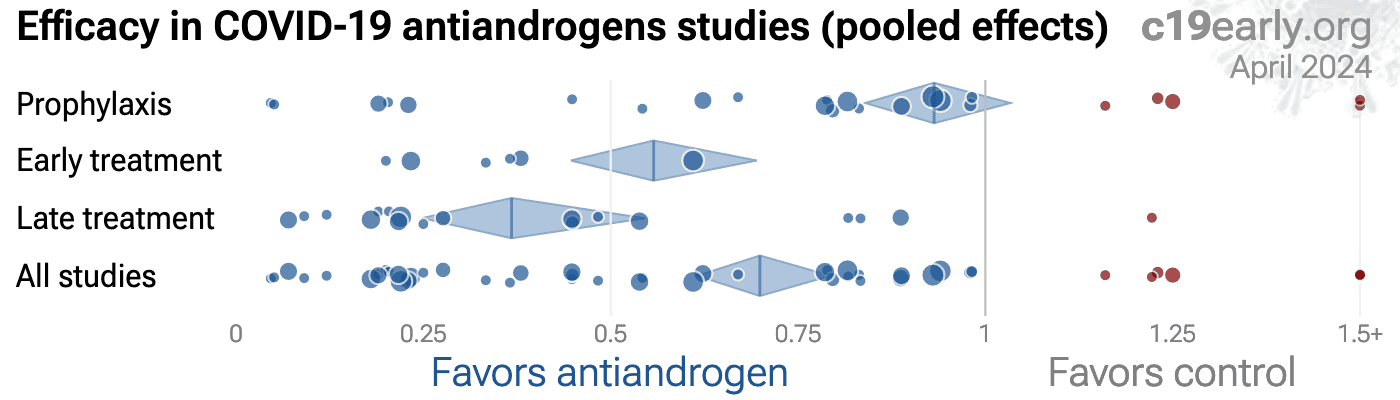
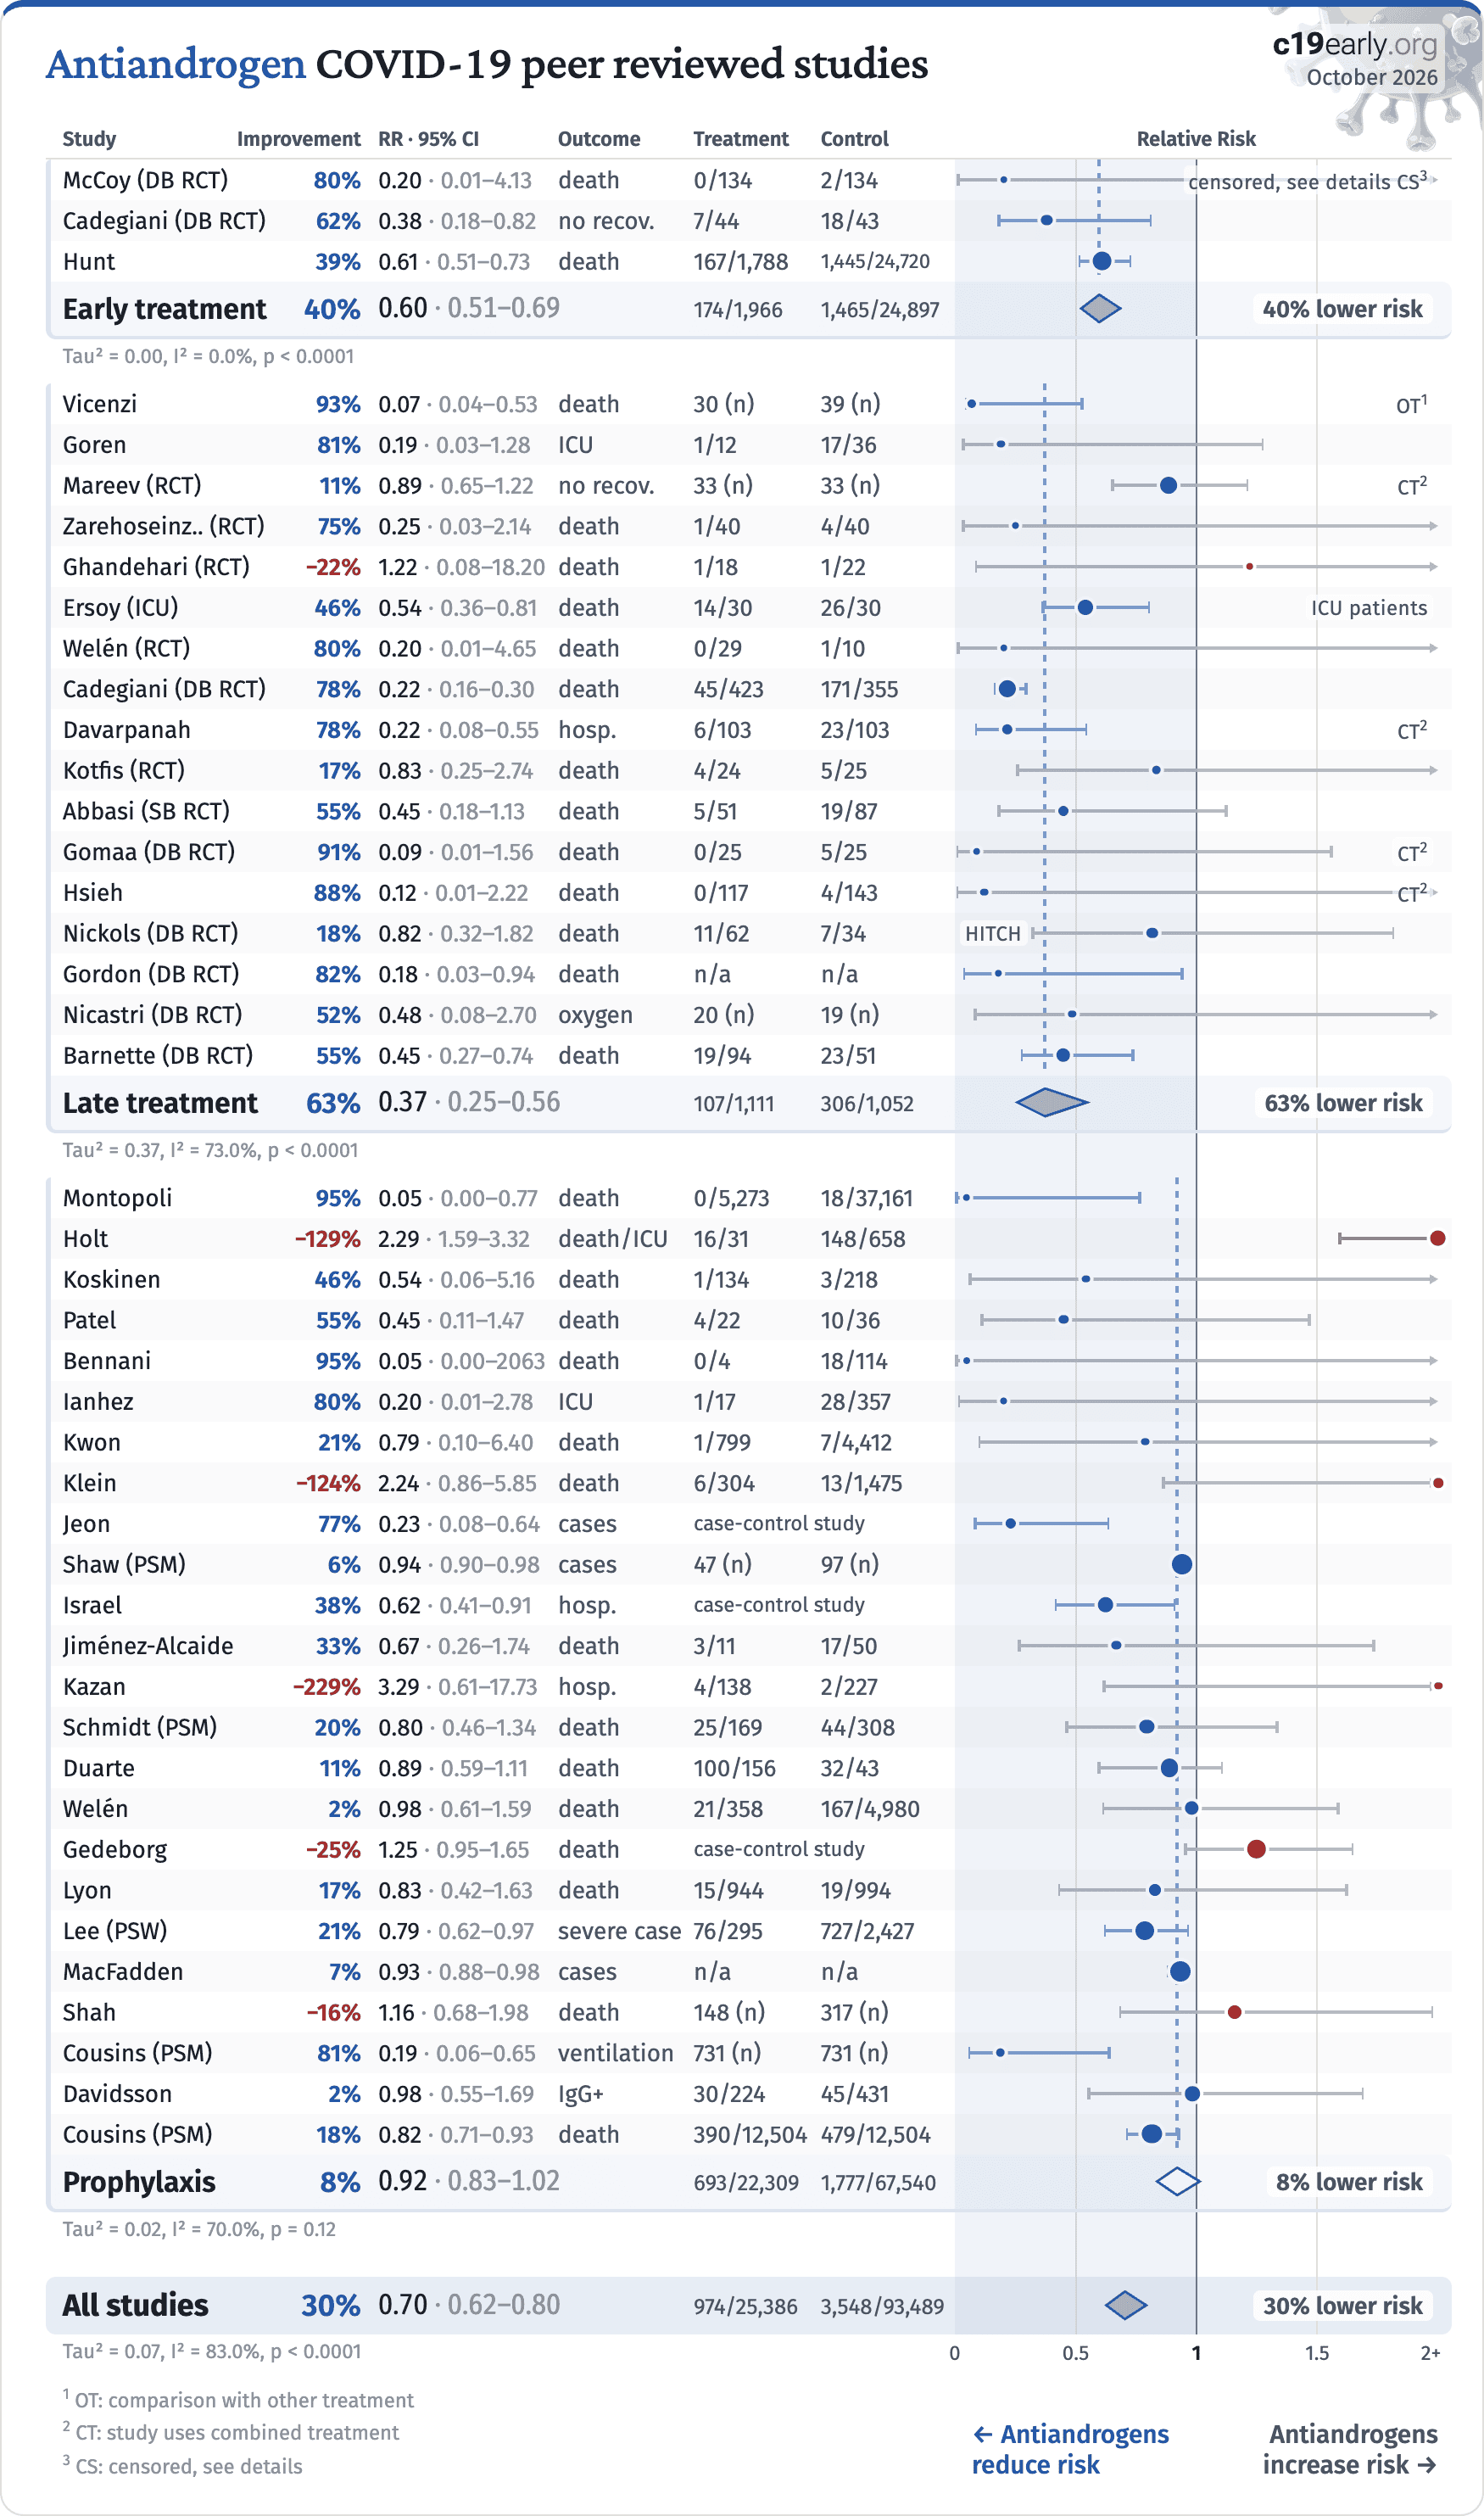
Table 1 summarizes the results for all stages combined, for Randomized Controlled Trials, for peer-reviewed studies, after exclusions, and for specific outcomes. Table 2 shows results by treatment stage. Fig. 4 plots individual results by treatment stage. Fig. 5, 6, 7, 8, 9, 10, 11, 12, 13, and 14 show forest plots for random-effects meta-analysis of all studies with pooled effects, mortality results, ventilation, ICU admission, hospitalization, progression, recovery, cases, viral clearance, and peer reviewed studies.
Table 1. Random-effects meta-analysis for all stages combined, for Randomized Controlled Trials, for peer-reviewed studies, after exclusions, and for specific outcomes. Results show the relative risk with treatment and the 95% confidence interval. * p<0.05  ** p<0.01  *** p<0.001  **** p<0.0001.
Relative Risk Studies Patients
All studies0.70 [0.62‑0.79]****49120K
After exclusions0.68 [0.60‑0.78]****45110K
Peer-reviewedPeer-reviewed0.70 [0.62‑0.80]****44110K
RCTsRCTs0.42 [0.28‑0.64]****172,902
Mortality0.63 [0.50‑0.79]****32110K
VentilationVent.0.53 [0.36‑0.77]**1420K
ICU admissionICU0.64 [0.43‑0.95]*118,017
HospitalizationHosp.0.68 [0.52‑0.89]**169,228
Recovery0.58 [0.45‑0.73]****112,063
Cases0.92 [0.86‑0.99]*12100K
Viral0.51 [0.35‑0.73]***51,329
RCT mortality0.38 [0.25‑0.56]****132,590
RCT hospitalizationRCT hosp.0.68 [0.47‑0.97]*82,304
Table 2. Random-effects meta-analysis results by treatment stage. Results show the relative risk with treatment and the 95% confidence interval.treatment and the 95% confidence interval. * p<0.05  ** p<0.01  *** p<0.001  **** p<0.0001.
Early treatment Late treatment Prophylaxis
All studies0.56 [0.45‑0.69]****0.56****
[0.45‑0.69]
0.37 [0.25‑0.55]****0.37****
[0.25‑0.55]
0.93 [0.84‑1.03]0.93
[0.84‑1.03]
After exclusions0.61 [0.52‑0.71]****0.61****
[0.52‑0.71]
0.37 [0.25‑0.55]****0.37****
[0.25‑0.55]
0.89 [0.82‑0.98]*0.89*
[0.82‑0.98]
Peer-reviewedPeer-reviewed0.60 [0.51‑0.69]****0.60****
[0.51‑0.69]
0.37 [0.25‑0.56]****0.37****
[0.25‑0.56]
0.92 [0.83‑1.02]0.92
[0.83‑1.02]
RCTsRCTs0.36 [0.18‑0.74]**0.36**
[0.18‑0.74]
0.43 [0.27‑0.71]***0.43***
[0.27‑0.71]
Mortality0.61 [0.52‑0.71]****0.61****
[0.52‑0.71]
0.37 [0.25‑0.57]****0.37****
[0.25‑0.57]
0.93 [0.78‑1.12]0.93
[0.78‑1.12]
VentilationVent.0.05 [0.01‑0.40]**0.05**
[0.01‑0.40]
0.56 [0.41‑0.77]***0.56***
[0.41‑0.77]
0.54 [0.26‑1.12]0.54
[0.26‑1.12]
ICU admissionICU0.60 [0.45‑0.78]***0.60***
[0.45‑0.78]
0.69 [0.25‑1.88]0.69
[0.25‑1.88]
HospitalizationHosp.0.19 [0.07‑0.54]**0.19**
[0.07‑0.54]
0.79 [0.57‑1.10]0.79
[0.57‑1.10]
0.79 [0.50‑1.23]0.79
[0.50‑1.23]
Recovery0.32 [0.17‑0.59]***0.32***
[0.17‑0.59]
0.62 [0.48‑0.79]***0.62***
[0.48‑0.79]
Cases0.92 [0.86‑0.99]*0.92*
[0.86‑0.99]
Viral0.42 [0.18‑0.98]*0.42*
[0.18‑0.98]
0.63 [0.50‑0.79]****0.63****
[0.50‑0.79]
RCT mortality0.29 [0.05‑1.75]0.29
[0.05‑1.75]
0.39 [0.25‑0.61]****0.39****
[0.25‑0.61]
RCT hospitalizationRCT hosp.0.19 [0.07‑0.54]**0.19**
[0.07‑0.54]
0.90 [0.67‑1.20]0.90
[0.67‑1.20]
Loading..
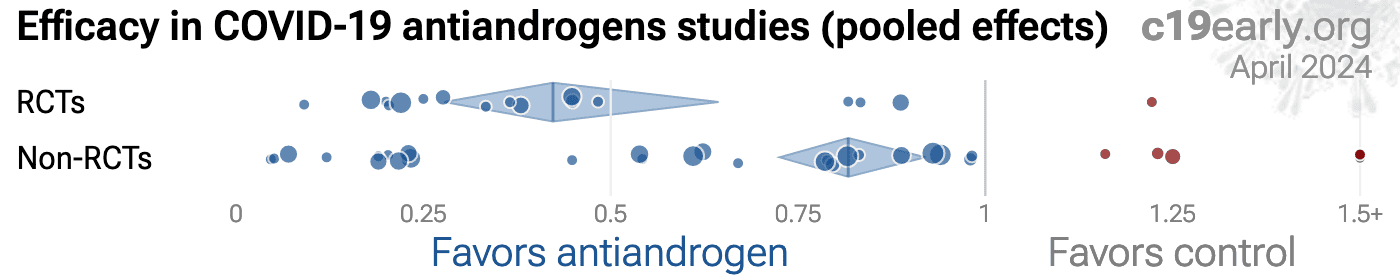
Fig. 4. Scatter plot showing the most serious outcome in all studies, and for studies within each stage. Diamonds shows the results of random-effects meta-analysis.
October 2026

Antiandrogen COVID-19 studies

StudyImprovementRR · 95% CIOutcomeTreatmentControlRelative Risk
Early treatment44%0.56 · 0.45–0.69174/2,4141,467/25,62644% lower risk
Tau² = 0.01, I² = 3.6%, p < 0.0001
Late treatment63%0.37 · 0.25–0.55111/1,185315/1,09863% lower risk
Tau² = 0.35, I² = 71.5%, p < 0.0001
Prophylaxis7%0.93 · 0.84–1.03693/22,3091,777/67,5407% lower risk
Tau² = 0.02, I² = 69.4%, p = 0.18
All studies30%0.70 · 0.62–0.79978/25,9083,559/94,26430% lower risk
Tau² = 0.07, I² = 82.0%, p < 0.000100.511.52+
1 OT: comparison with other treatment
2 CT: study uses combined treatment
3 CS: censored, see details
Rotate screen for more detailsIncrease width for more details
← Antiandrogens
reduce risk
Antiandrogens
increase risk →
Fig. 5. Random-effects meta-analysis for all studies. This plot shows pooled effects, see the specific outcome analyses for individual outcomes. Analysis validating pooled outcomes for COVID-19 can be found below. Effect extraction is pre-specified, using the most serious outcome reported. For details see the appendix.
October 2026

Antiandrogen COVID-19 mortality results

StudyImprovementRR · 95% CITreatmentControlRelative Risk
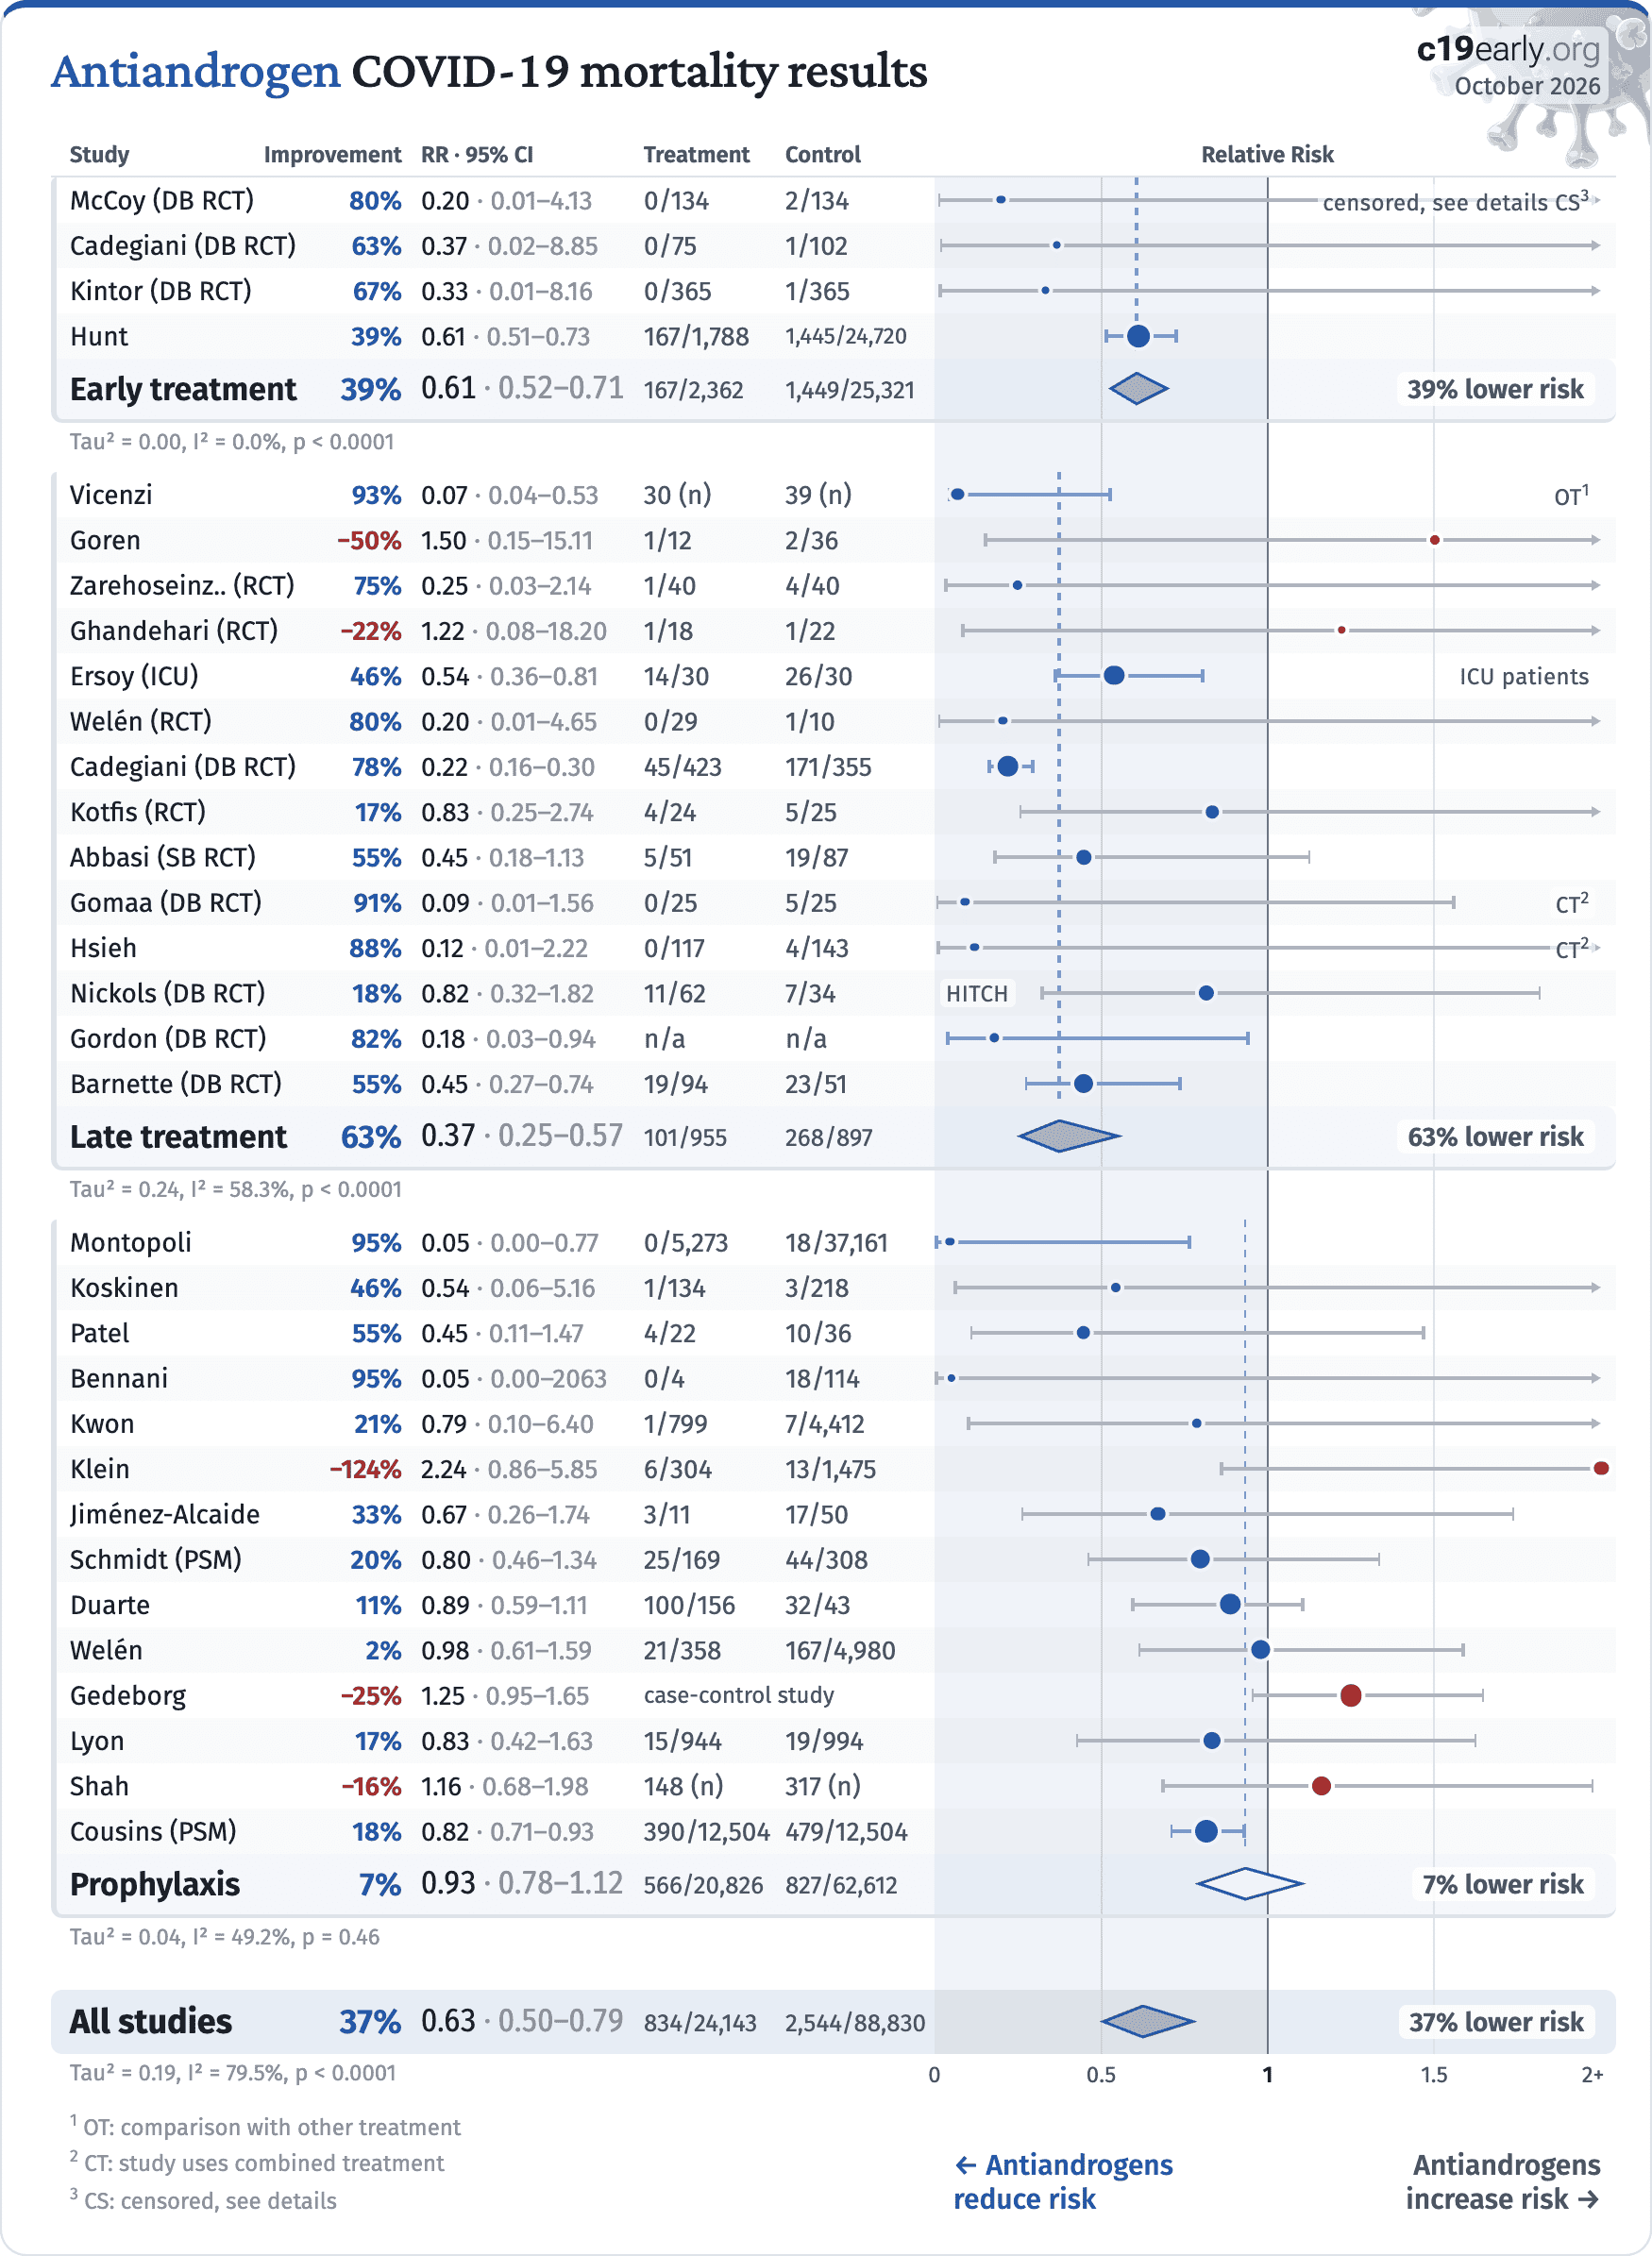
Early treatment39%0.61 · 0.52–0.71167/2,3621,449/25,32139% lower risk
Tau² = 0.00, I² = 0.0%, p < 0.0001
Late treatment63%0.37 · 0.25–0.57101/955268/89763% lower risk
Tau² = 0.24, I² = 58.3%, p < 0.0001
Prophylaxis7%0.93 · 0.78–1.12566/20,826827/62,6127% lower risk
Tau² = 0.04, I² = 49.2%, p = 0.46
All studies37%0.63 · 0.50–0.79834/24,1432,544/88,83037% lower risk
Tau² = 0.19, I² = 79.5%, p < 0.000100.511.52+
1 OT: comparison with other treatment
2 CT: study uses combined treatment
3 CS: censored, see details
Rotate screen for more detailsIncrease width for more details
← Antiandrogens
reduce risk
Antiandrogens
increase risk →
Fig. 6. Random-effects meta-analysis for mortality results.
October 2026

Antiandrogen COVID-19 mechanical ventilation results

StudyImprovementRR · 95% CITreatmentControlRelative Risk
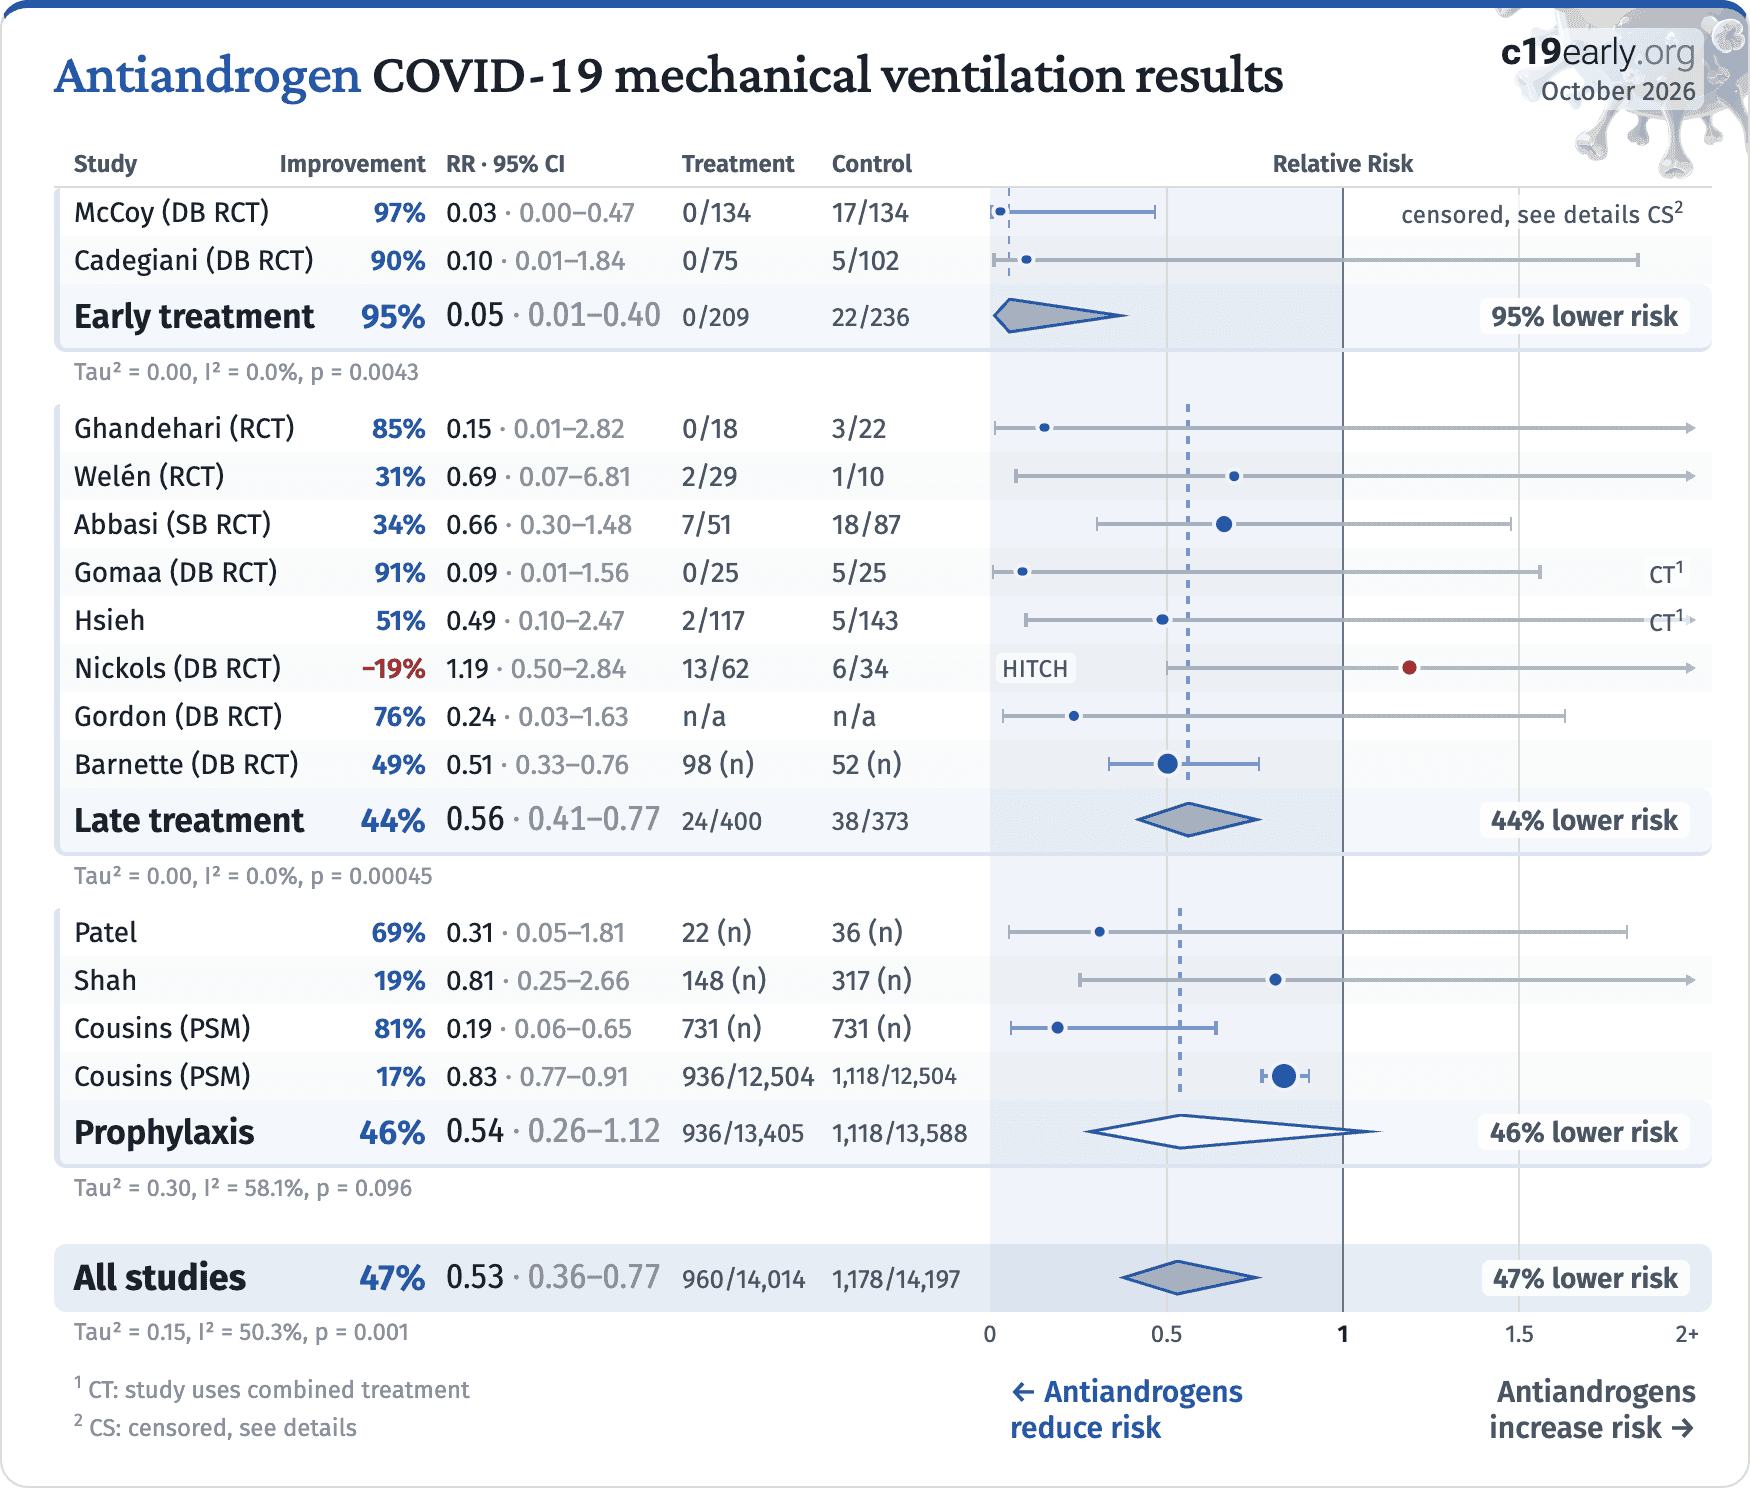
Early treatment95%0.05 · 0.01–0.400/20922/23695% lower risk
Tau² = 0.00, I² = 0.0%, p = 0.0043
Late treatment44%0.56 · 0.41–0.7724/40038/37344% lower risk
Tau² = 0.00, I² = 0.0%, p = 0.00045
Prophylaxis46%0.54 · 0.26–1.12936/13,4051,118/13,58846% lower risk
Tau² = 0.30, I² = 58.1%, p = 0.096
All studies47%0.53 · 0.36–0.77960/14,0141,178/14,19747% lower risk
Tau² = 0.15, I² = 50.3%, p = 0.00100.511.52+
1 CT: study uses combined treatment
2 CS: censored, see details
Rotate screen for more detailsIncrease width for more details
← Antiandrogens
reduce risk
Antiandrogens
increase risk →
Fig. 7. Random-effects meta-analysis for ventilation.
October 2026

Antiandrogen COVID-19 ICU results

StudyImprovementRR · 95% CITreatmentControlRelative Risk
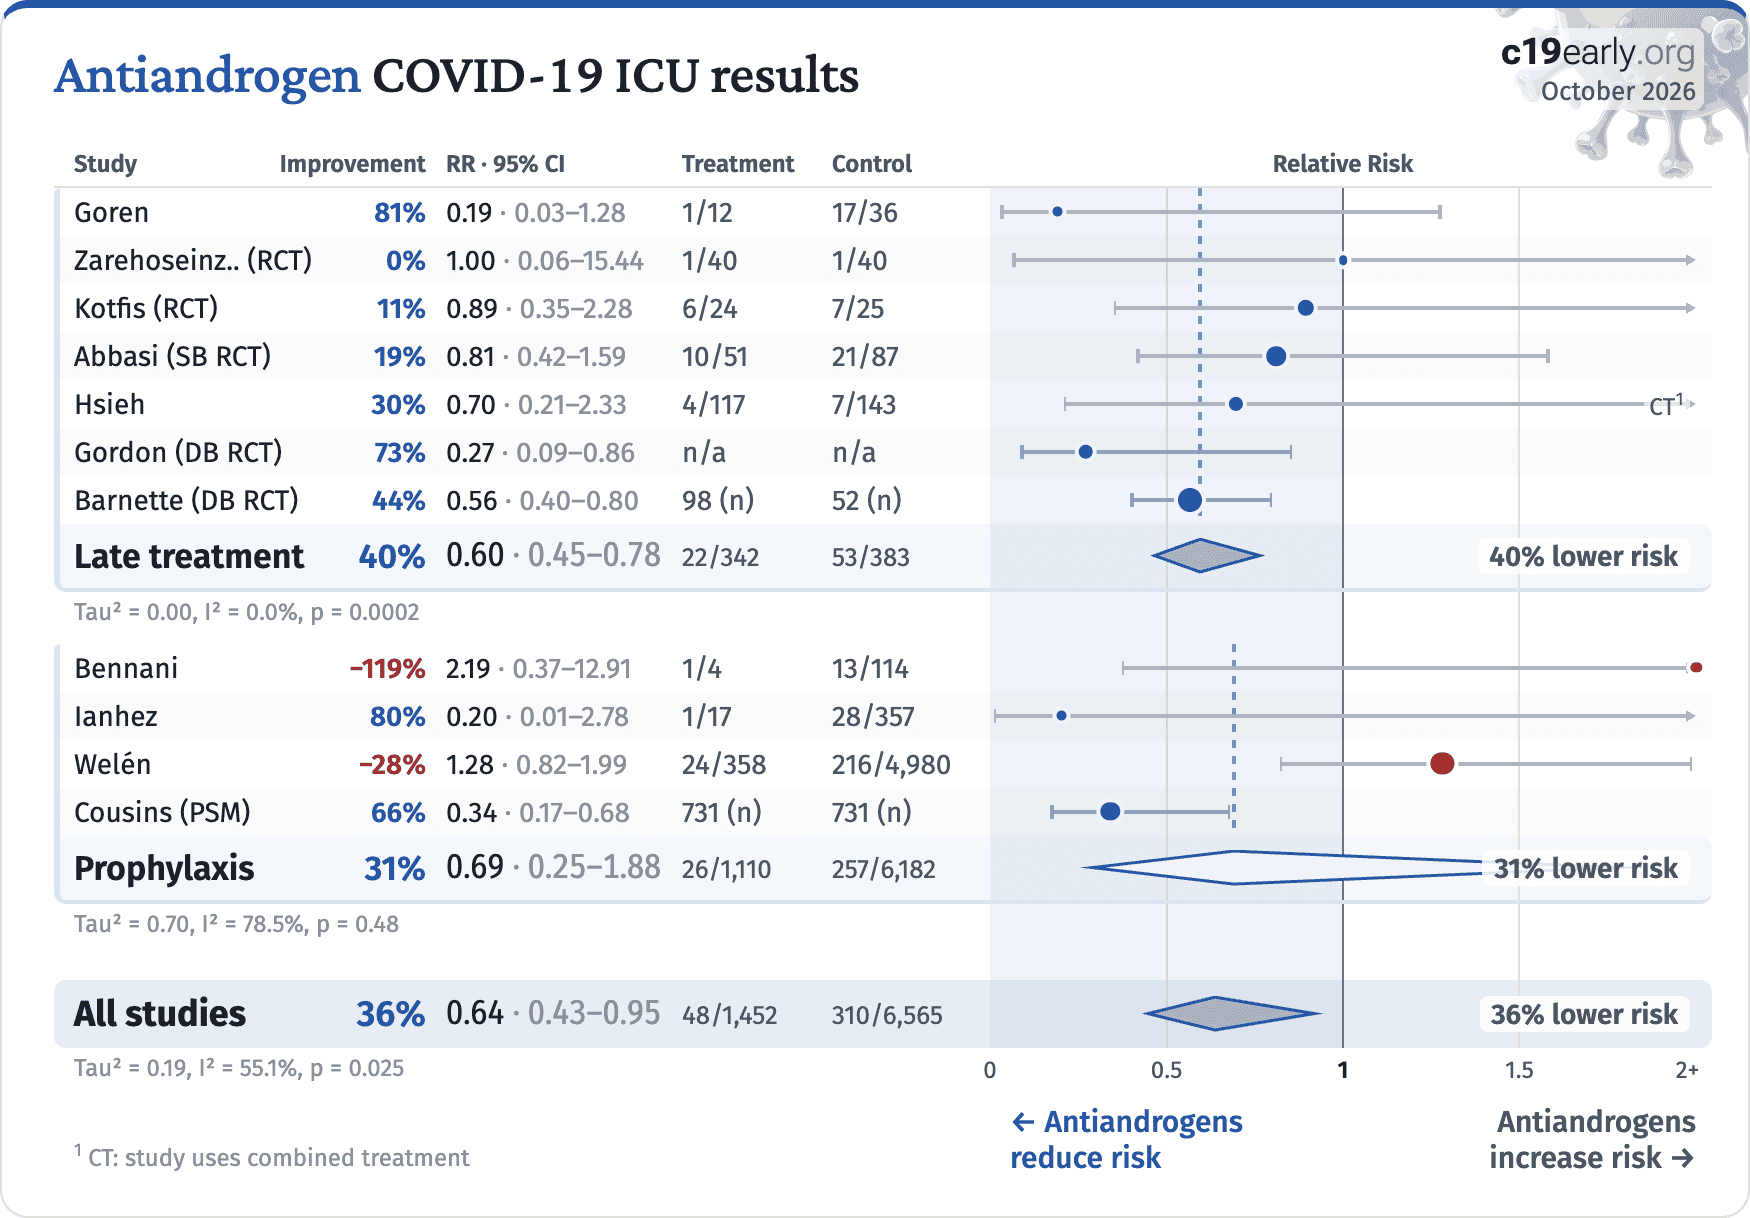
Late treatment40%0.60 · 0.45–0.7822/34253/38340% lower risk
Tau² = 0.00, I² = 0.0%, p = 0.0002
Prophylaxis31%0.69 · 0.25–1.8826/1,110257/6,18231% lower risk
Tau² = 0.70, I² = 78.5%, p = 0.48
All studies36%0.64 · 0.43–0.9548/1,452310/6,56536% lower risk
Tau² = 0.19, I² = 55.1%, p = 0.02500.511.52+
1 CT: study uses combined treatment
Rotate screen for more detailsIncrease width for more details
← Antiandrogens
reduce risk
Antiandrogens
increase risk →
Fig. 8. Random-effects meta-analysis for ICU admission.
October 2026

Antiandrogen COVID-19 hospitalization results

StudyImprovementRR · 95% CIOutcomeTreatmentControlRelative Risk
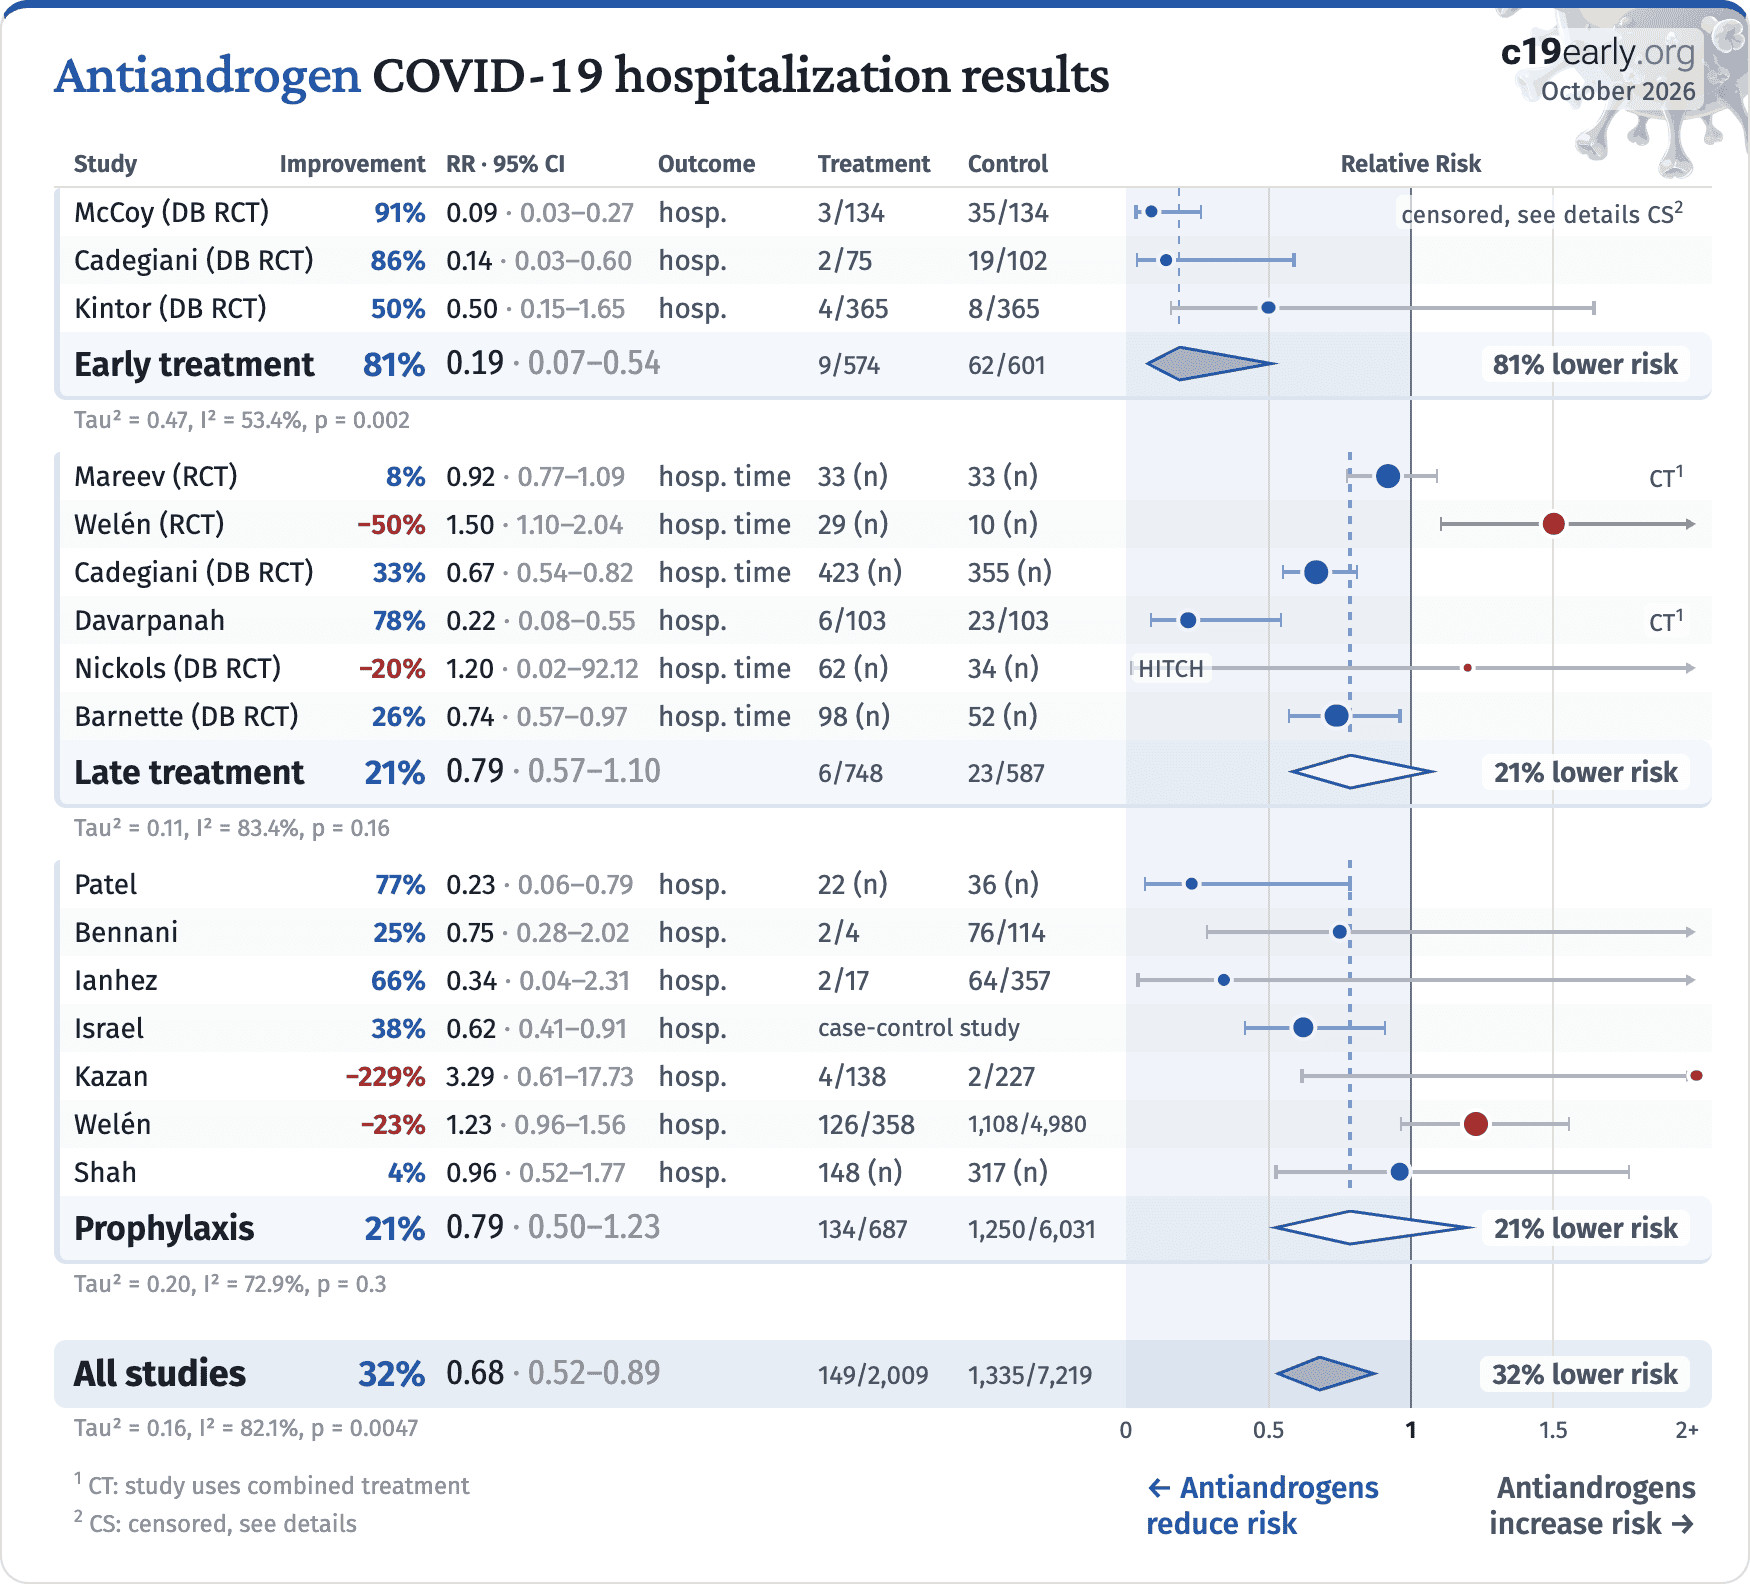
Early treatment81%0.19 · 0.07–0.549/57462/60181% lower risk
Tau² = 0.47, I² = 53.4%, p = 0.002
Late treatment21%0.79 · 0.57–1.106/74823/58721% lower risk
Tau² = 0.11, I² = 83.4%, p = 0.16
Prophylaxis21%0.79 · 0.50–1.23134/6871,250/6,03121% lower risk
Tau² = 0.20, I² = 72.9%, p = 0.3
All studies32%0.68 · 0.52–0.89149/2,0091,335/7,21932% lower risk
Tau² = 0.16, I² = 82.1%, p = 0.004700.511.52+
1 CT: study uses combined treatment
2 CS: censored, see details
Rotate screen for more detailsIncrease width for more details
← Antiandrogens
reduce risk
Antiandrogens
increase risk →
Fig. 9. Random-effects meta-analysis for hospitalization.
October 2026

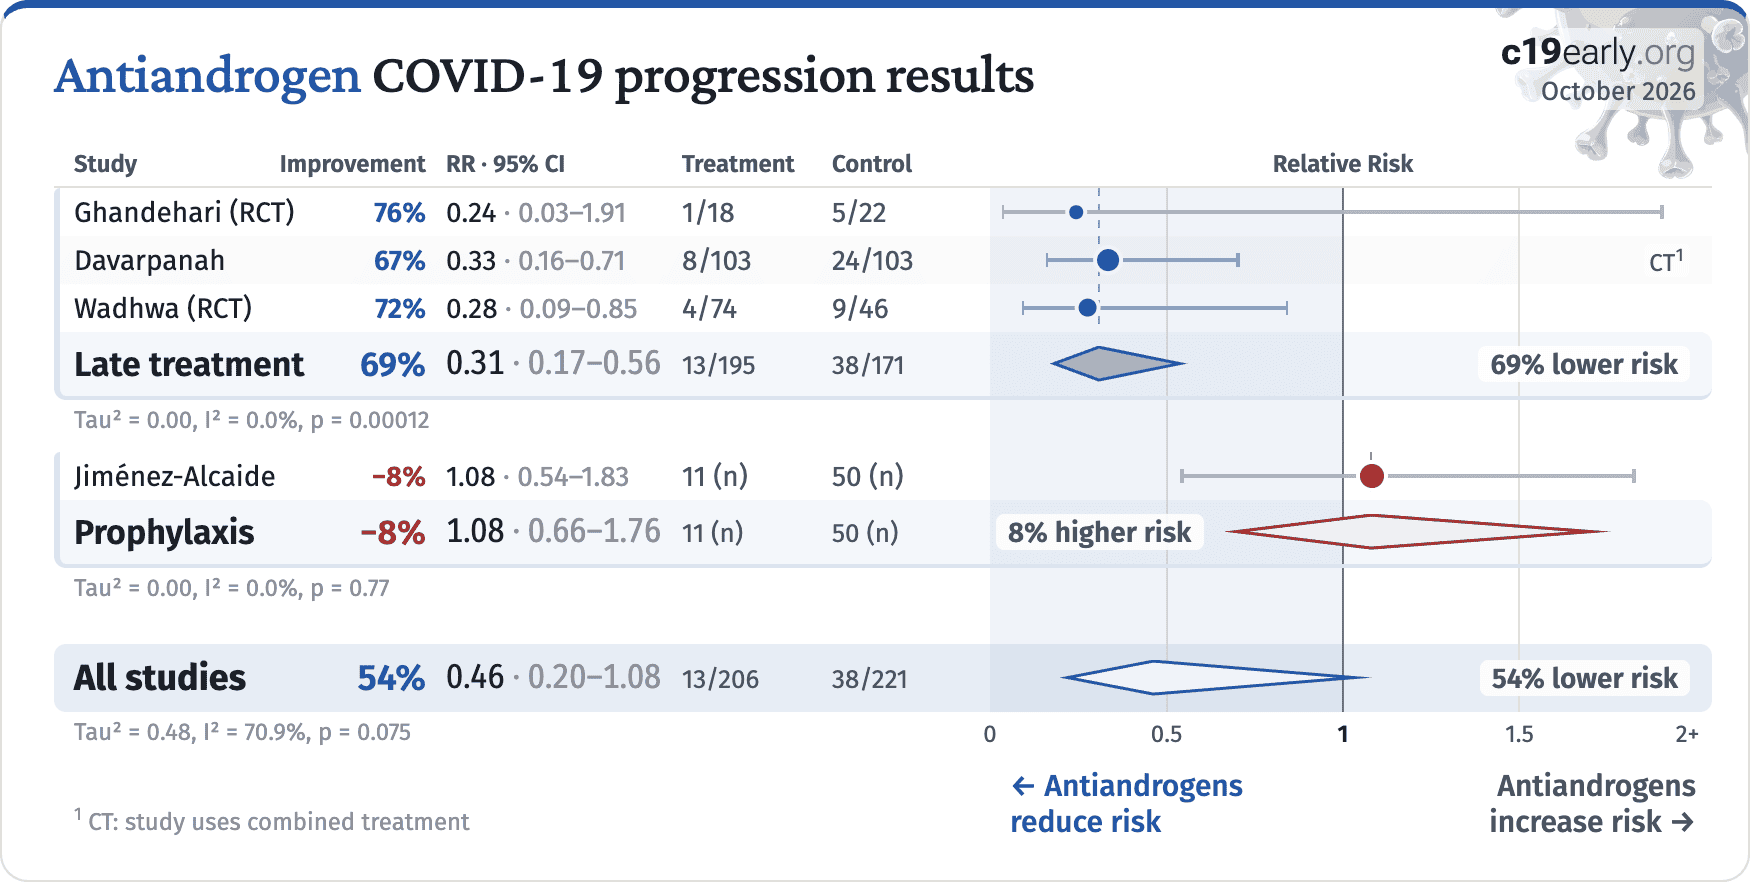
Antiandrogen COVID-19 progression results

StudyImprovementRR · 95% CITreatmentControlRelative Risk
Late treatment69%0.31 · 0.17–0.5613/19538/17169% lower risk
Tau² = 0.00, I² = 0.0%, p = 0.00012
Prophylaxis−8%1.08 · 0.66–1.7611 (n)50 (n)8% higher risk
Tau² = 0.00, I² = 0.0%, p = 0.77
All studies54%0.46 · 0.20–1.0813/20638/22154% lower risk
Tau² = 0.48, I² = 70.9%, p = 0.07500.511.52+
1 CT: study uses combined treatment
Rotate screen for more detailsIncrease width for more details
← Antiandrogens
reduce risk
Antiandrogens
increase risk →
Fig. 10. Random-effects meta-analysis for progression.
October 2026

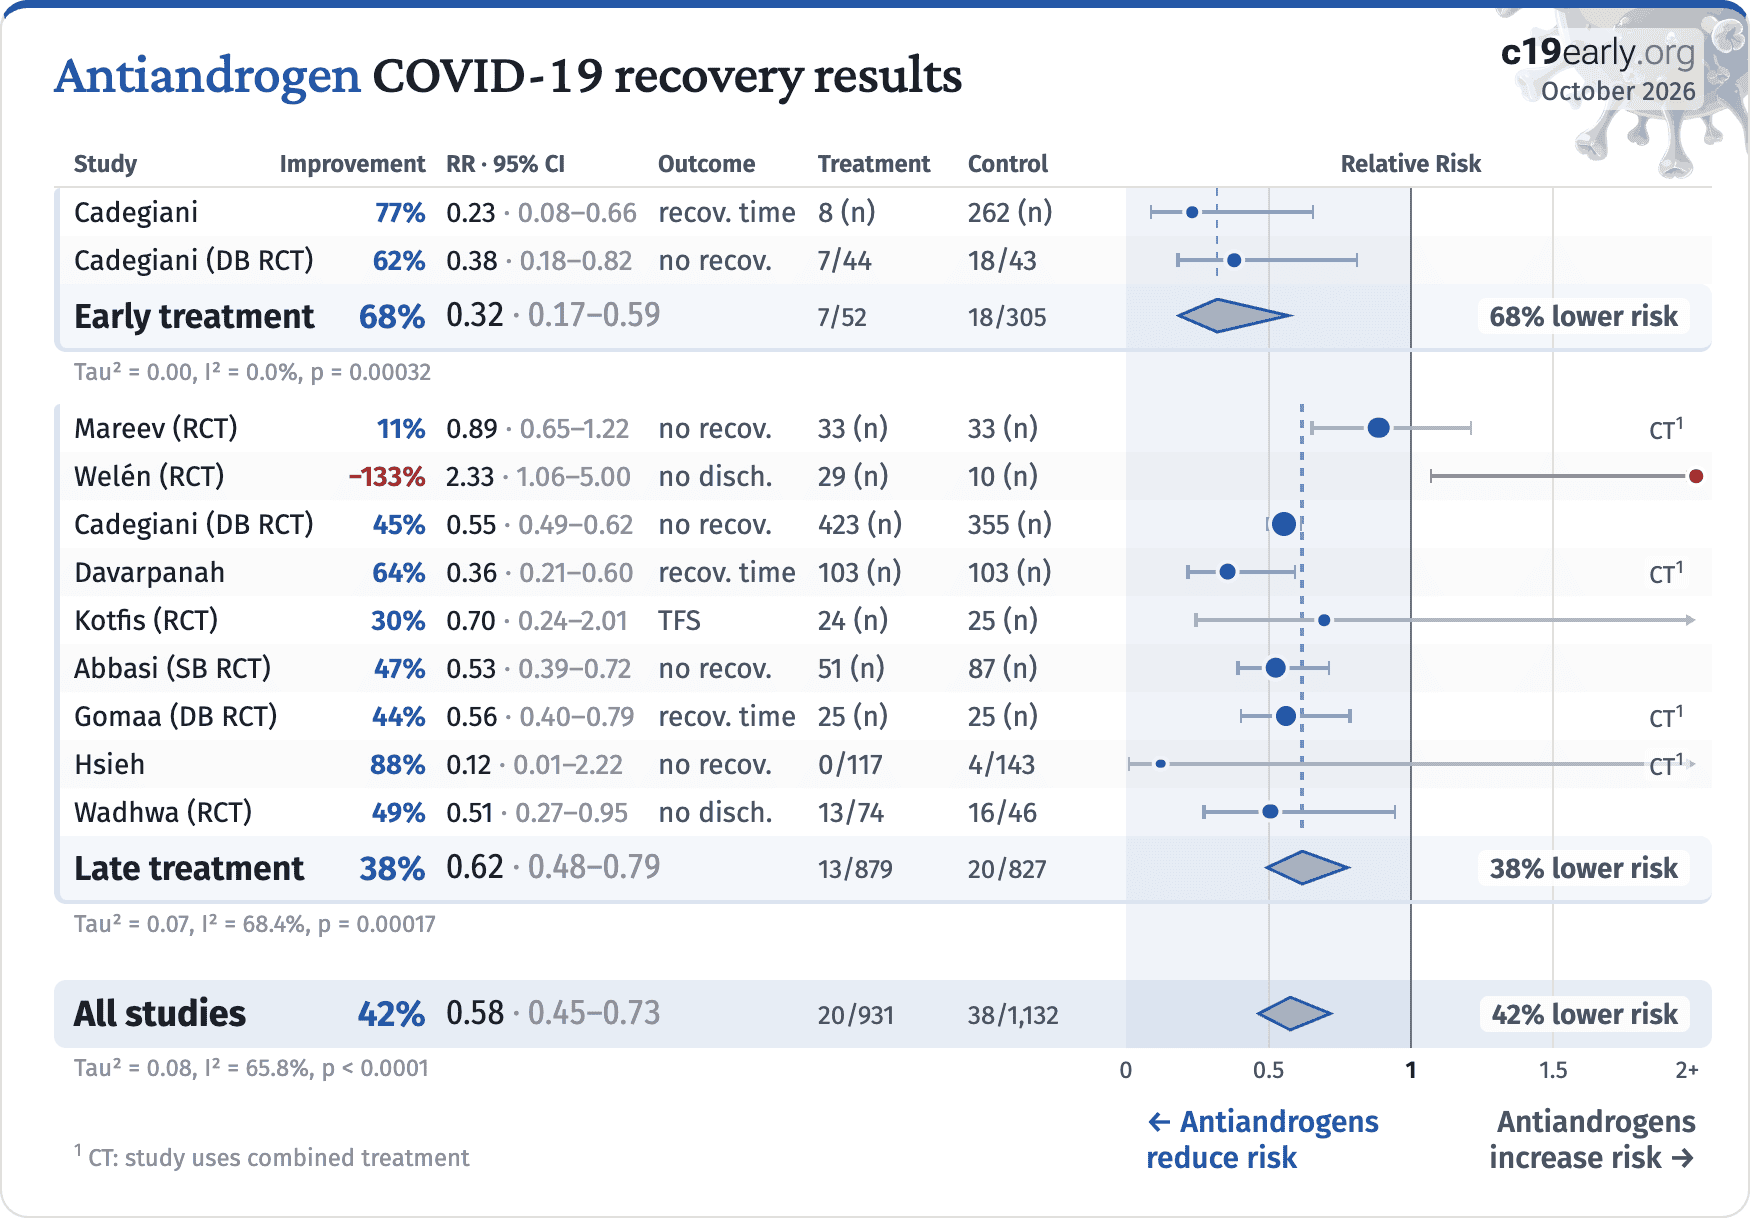
Antiandrogen COVID-19 recovery results

StudyImprovementRR · 95% CIOutcomeTreatmentControlRelative Risk
Early treatment68%0.32 · 0.17–0.597/5218/30568% lower risk
Tau² = 0.00, I² = 0.0%, p = 0.00032
Late treatment38%0.62 · 0.48–0.7913/87920/82738% lower risk
Tau² = 0.07, I² = 68.4%, p = 0.00017
All studies42%0.58 · 0.45–0.7320/93138/1,13242% lower risk
Tau² = 0.08, I² = 65.8%, p < 0.000100.511.52+
1 CT: study uses combined treatment
Rotate screen for more detailsIncrease width for more details
← Antiandrogens
reduce risk
Antiandrogens
increase risk →
Fig. 11. Random-effects meta-analysis for recovery.
October 2026

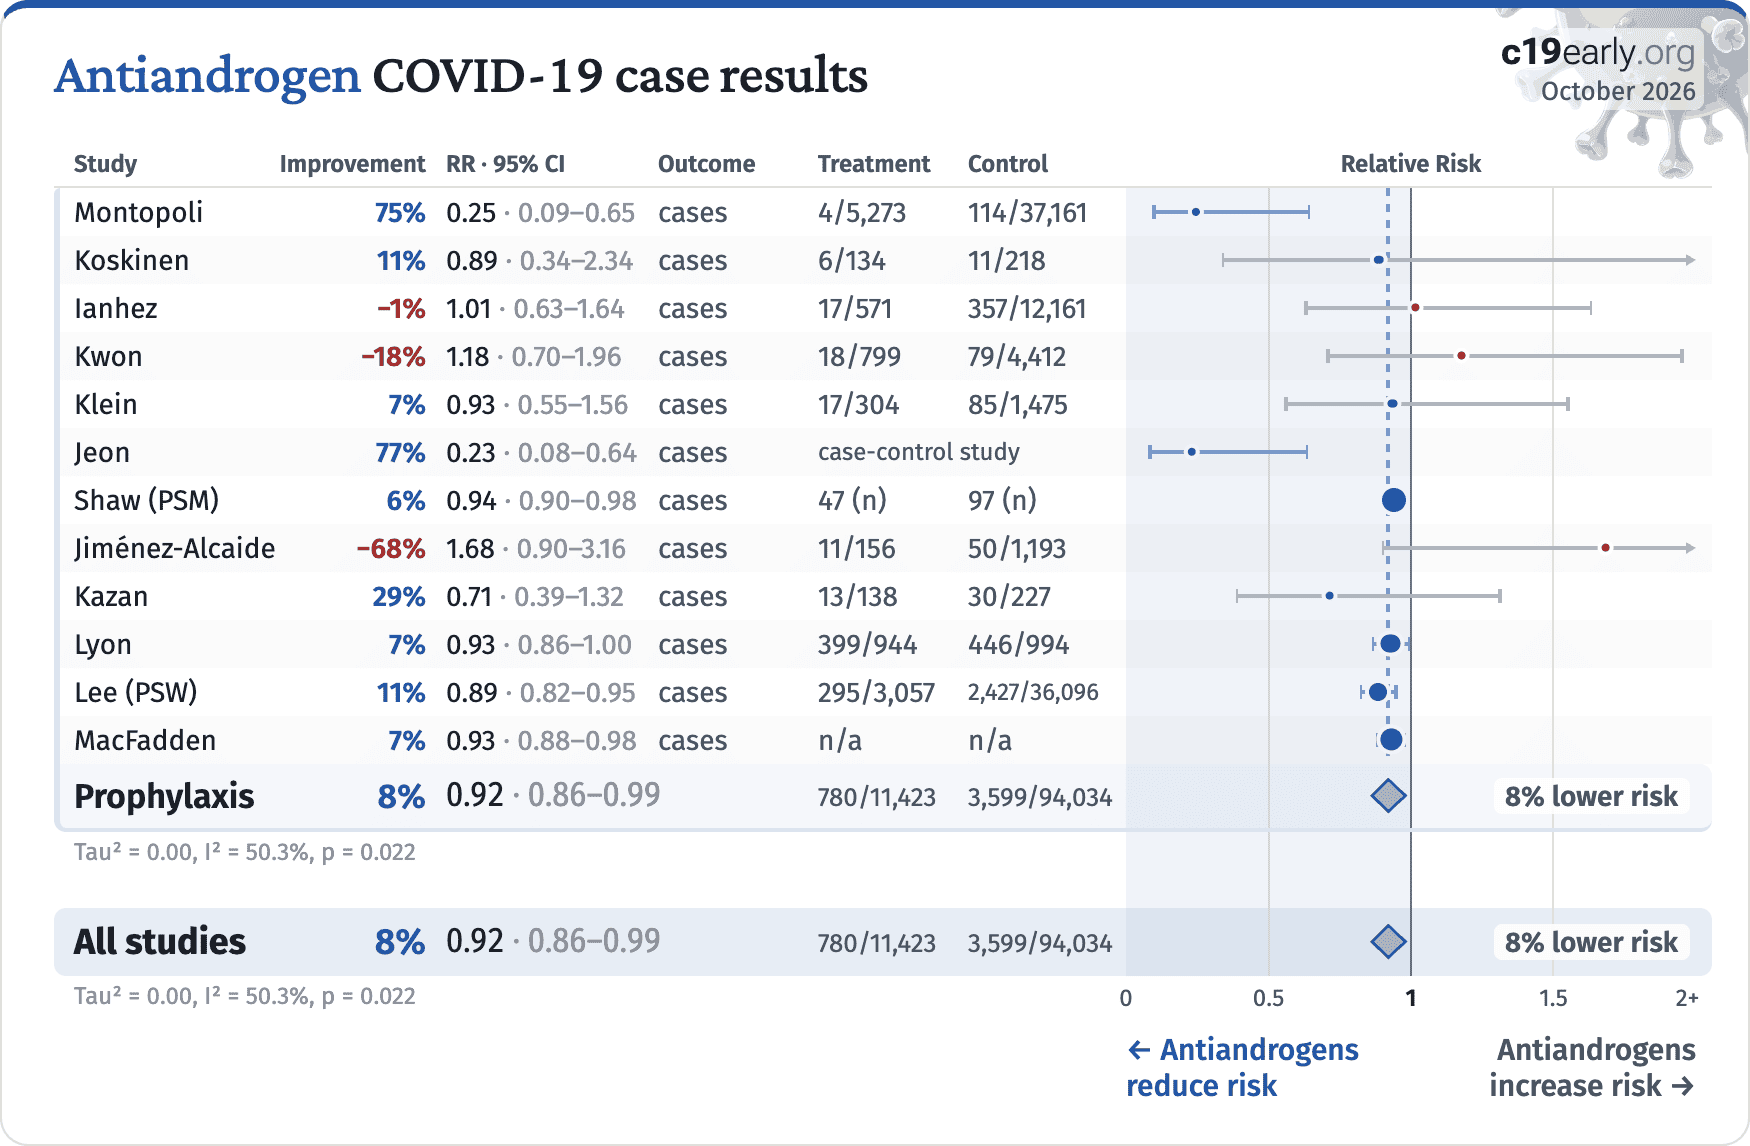
Antiandrogen COVID-19 case results

StudyImprovementRR · 95% CIOutcomeTreatmentControlRelative Risk
Prophylaxis8%0.92 · 0.86–0.99780/11,4233,599/94,0348% lower risk
Tau² = 0.00, I² = 50.3%, p = 0.022
All studies8%0.92 · 0.86–0.99780/11,4233,599/94,0348% lower risk
Tau² = 0.00, I² = 50.3%, p = 0.02200.511.52+
Rotate screen for more detailsIncrease width for more details
← Antiandrogens
reduce risk
Antiandrogens
increase risk →
Fig. 12. Random-effects meta-analysis for cases.
October 2026

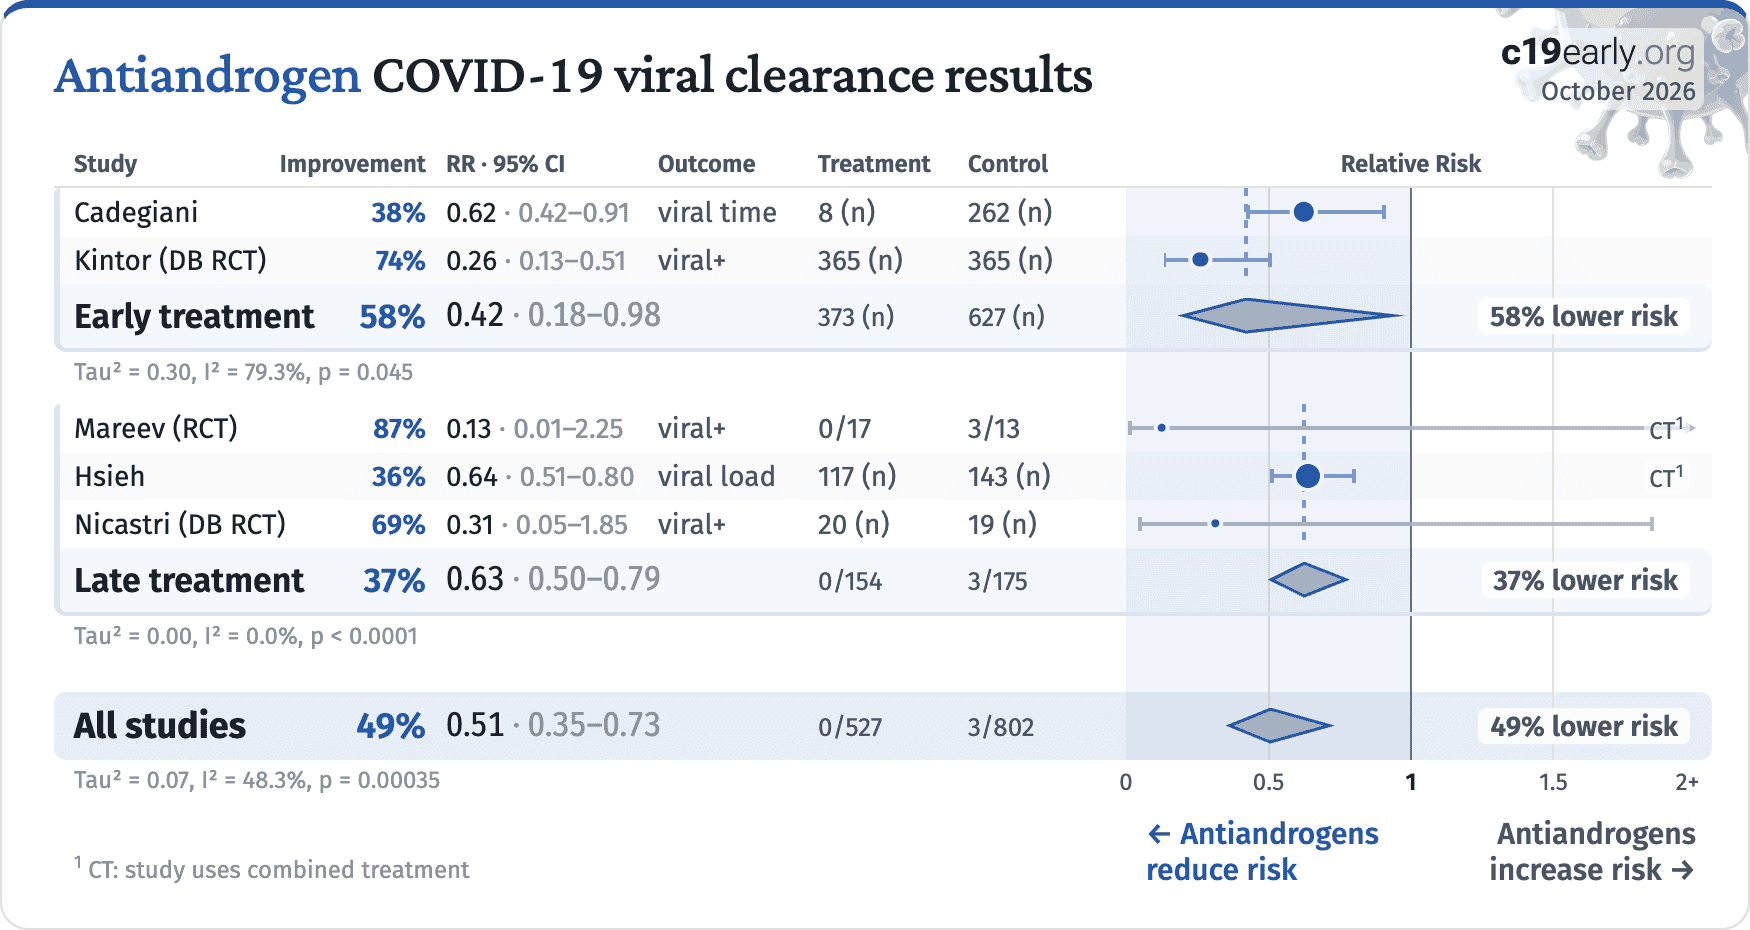
Antiandrogen COVID-19 viral clearance results

StudyImprovementRR · 95% CIOutcomeTreatmentControlRelative Risk
Early treatment58%0.42 · 0.18–0.98373 (n)627 (n)58% lower risk
Tau² = 0.30, I² = 79.3%, p = 0.045
Late treatment37%0.63 · 0.50–0.790/1543/17537% lower risk
Tau² = 0.00, I² = 0.0%, p < 0.0001
All studies49%0.51 · 0.35–0.730/5273/80249% lower risk
Tau² = 0.07, I² = 48.3%, p = 0.0003500.511.52+
1 CT: study uses combined treatment
Rotate screen for more detailsIncrease width for more details
← Antiandrogens
reduce risk
Antiandrogens
increase risk →
Fig. 13. Random-effects meta-analysis for viral clearance.
October 2026

Antiandrogen COVID-19 peer reviewed studies

StudyImprovementRR · 95% CIOutcomeTreatmentControlRelative Risk
Early treatment40%0.60 · 0.51–0.69174/1,9661,465/24,89740% lower risk
Tau² = 0.00, I² = 0.0%, p < 0.0001
Late treatment63%0.37 · 0.25–0.56107/1,111306/1,05263% lower risk
Tau² = 0.37, I² = 73.0%, p < 0.0001
Prophylaxis8%0.92 · 0.83–1.02693/22,3091,777/67,5408% lower risk
Tau² = 0.02, I² = 70.0%, p = 0.12
All studies30%0.70 · 0.62–0.80974/25,3863,548/93,48930% lower risk
Tau² = 0.07, I² = 83.0%, p < 0.000100.511.52+
1 OT: comparison with other treatment
2 CT: study uses combined treatment
3 CS: censored, see details
Rotate screen for more detailsIncrease width for more details
← Antiandrogens
reduce risk
Antiandrogens
increase risk →
Fig. 14. Random-effects meta-analysis for peer reviewed studies. Zeraatkar et al. analyze 356 COVID-19 trials, finding no significant evidence that preprint results are inconsistent with peer-reviewed studies. They also show extremely long peer-review delays, with a median of 6 months to journal publication. A six month delay was equivalent to around 1.5 million deaths during the first two years of the pandemic. Authors recommend using preprint evidence, with appropriate checks for potential falsified data, which provides higher certainty much earlier. Davidson et al. also showed no important difference between meta-analysis results of preprints and peer-reviewed publications for COVID-19, based on 37 meta-analyses including 114 trials. Effect extraction is pre-specified, using the most serious outcome reported, see the appendix for details. Analysis validating pooled outcomes for COVID-19 can be found below.
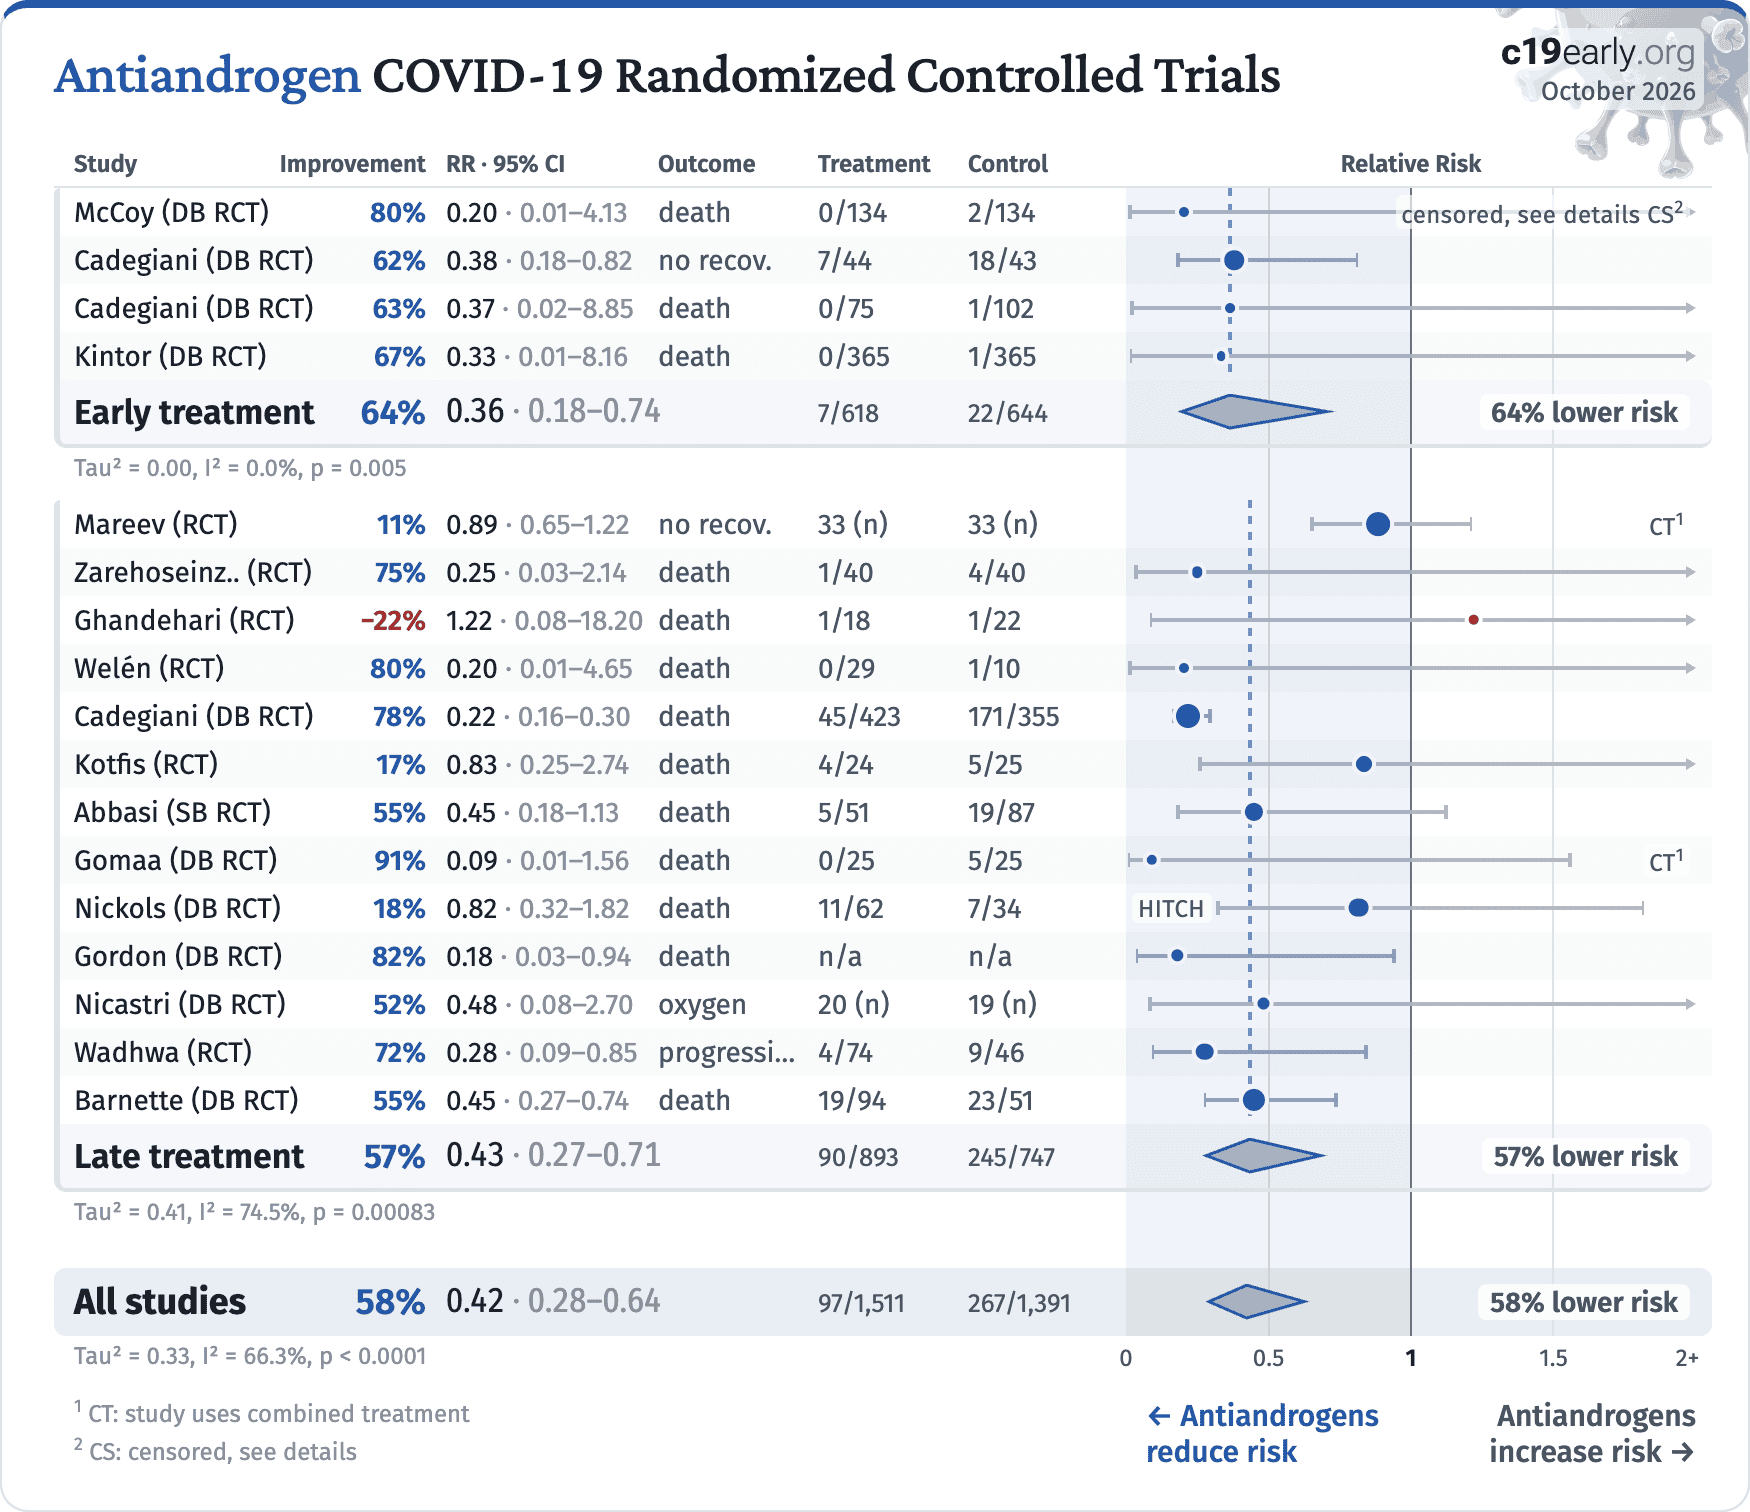
Fig. 15 shows a comparison of results for RCTs and observational studies. Random-effects meta-analysis of RCTs shows 58% improvement, compared to 18% for other studies. Fig. 16, 17, and 18 show forest plots for random-effects meta-analysis of all Randomized Controlled Trials, RCT mortality results, and RCT hospitalization results. RCT results are included in Table 1 and Table 2.
Loading..
Fig. 15. Results for RCTs and observational studies.
RCTs help to make study groups more similar and can provide a higher level of evidence, however they are subject to many biases55, and analysis of double-blind RCTs has identified extreme levels of bias56. For COVID-19, the overhead may delay treatment, dramatically compromising efficacy; they may encourage monotherapy for simplicity at the cost of efficacy which may rely on combined or synergistic effects; the participants that sign up may not reflect real world usage or the population that benefits most in terms of age, comorbidities, severity of illness, or other factors; standard of care may be compromised and unable to evolve quickly based on emerging research for new diseases; errors may be made in randomization and medication delivery; and investigators may have hidden agendas or vested interests influencing design, operation, analysis, reporting, and the potential for fraud. All of these biases have been observed with COVID-19 RCTs. There is no guarantee that a specific RCT provides a higher level of evidence.
RCTs are expensive and many RCTs are funded by pharmaceutical companies or other organizations with conflicts of interest, for example governments that previously denied treatment with the study drug. For COVID-19, this creates an incentive to show efficacy for patented commercial products, and an incentive to show a lack of efficacy for inexpensive treatments. The bias is expected to be significant, for example Als-Nielsen et al. analyzed 370 RCTs from Cochrane reviews, showing that trials funded by for-profit organizations were 5 times more likely to recommend the experimental drug compared with those funded by nonprofit organizations. Bekelman et al. and Lundh et al. show that industry-sponsored studies are more likely to be favorable. For COVID-19, some major philanthropic organizations are largely funded by investments with extreme conflicts of interest for and against specific COVID-19 interventions.
High quality RCTs for novel acute diseases are more challenging, with increased ethical issues due to the urgency of treatment, increased risk due to enrollment delays, and more difficult design with a rapidly evolving evidence base. For COVID-19, the most common site of initial infection is the upper respiratory tract. Immediate treatment is likely to be most successful and may prevent or slow progression to other parts of the body. For a non-prophylaxis RCT, it makes sense to provide treatment in advance and instruct patients to use it immediately on symptoms, just as some governments have done by providing medication kits in advance. Unfortunately, no RCTs have been done in this way. Every treatment RCT to date involves delayed treatment. Among the 226 treatments we have analyzed, 67% of RCTs involve very late treatment 5+ days after onset. No non-prophylaxis COVID-19 RCTs match the potential real-world use of early treatments. They may more accurately represent results for treatments that require visiting a medical facility, e.g., those requiring intravenous administration.
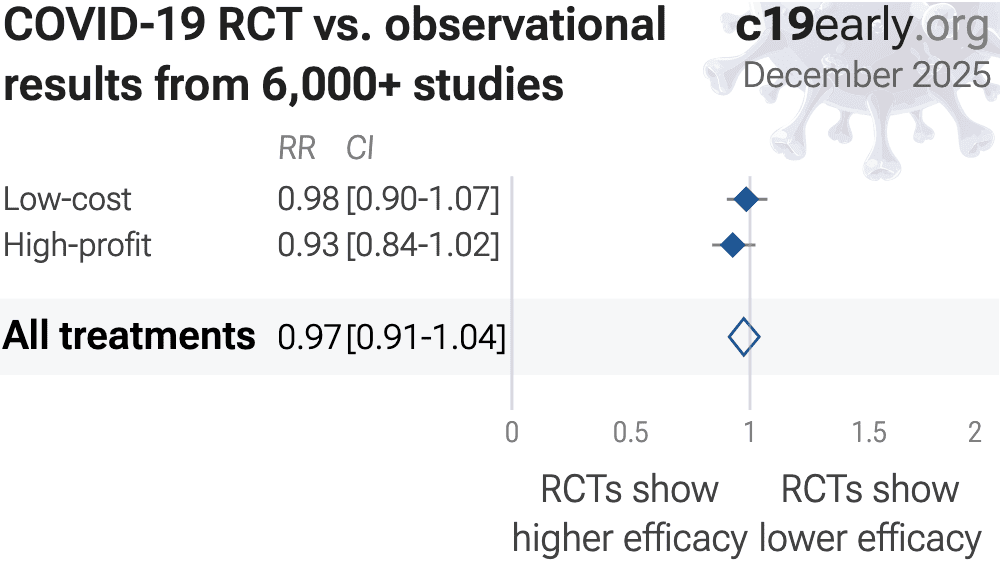
0 0.5 1 1.5 2 Low-cost 0.98 [0.90-1.06] RR CI High-profit 0.93 [0.85-1.02] All treatments 0.97 [0.91-1.03] COVID-19 RCT vs. observationalresults from 6,000+ studies c19early.org October 2026 RCTs showhigher efficacy RCTs showlower efficacy
Fig. 19. For COVID-19, observational study results do not systematically differ from RCTs, RR 0.97 [0.91‑1.03] across 226 treatments60.
Evidence shows that observational studies can also provide reliable results. Concato et al. found that well-designed observational studies do not systematically overestimate the magnitude of the effects of treatment compared to RCTs. Anglemyer et al. analyzed reviews comparing RCTs to observational studies and found little evidence for significant differences in effect estimates.
We performed a similar analysis across the 226 treatments we cover, showing no significant difference in the results of RCTs compared to observational studies, RR 0.97 [0.91‑1.03]46. Similar results are found for all low-cost treatments, RR 0.98 [0.90‑1.06]. High-cost treatments show a non-significant trend towards RCTs showing greater efficacy, RR 0.93 [0.85‑1.02]. Details can be found in the supplementary data.
Lee et al. showed that only 14% of the guidelines of the Infectious Diseases Society of America were based on RCTs. Evaluation of studies relies on an understanding of the study and potential biases. Limitations in an RCT can outweigh the benefits, for example excessive dosages, excessive treatment delays, or remote survey bias may have a greater effect on results. Ethical issues may also prevent running RCTs for known effective treatments. For more on issues with RCTs see64,65.
Concato et al. report a paradoxical finding—RCT results had higher variability, and only RCTs were found to sometimes report significant results the opposite of the overall result. The same trend is seen for the most popular (most politicized) COVID-19 treatments—considering all statistically significant results reported in studies, RCTs are slightly more likely to report a result in the opposite direction. In other words, for these COVID-19 treatments and for the topics covered by Concato et al., assuming causality from a single study is more likely to result in an incorrect conclusion for RCTs.
Increased risk of inconsistent results for RCTs suggests higher prevalence of bias, which may arise due to many issues including design bias, conflicts of interest, treatment differences by physicians aware of allocation, attrition bias, ascertainment bias, randomization failures, errors, or fraud.
Currently, 59 of the treatments we analyze show statistically significant efficacy or harm, defined as ≥10% decreased risk or >0% increased risk from ≥3 studies. Of these, 54% have been confirmed in RCTs, with a mean delay of 7.8 months (62% with 8.7 months delay for low-cost treatments). The remaining treatments either have no RCTs, or the point estimate is consistent.
Neither observational studies nor RCTs prove causation—any study can be flawed or fraudulent. We need much more, for example a combination of results from many independent teams, detailed understanding of each study, knowledge of conflicts/team reliability, dose-response relationships, delay-response relationships, logical results across outcomes, or details consistent with preclinical expectations.
All studies must be evaluated individually. RCTs for a given medication and disease may be more reliable, however they may also be less reliable. For off-patent medications, very high conflict of interest trials may be more likely to be RCTs, and more likely to be large trials that dominate meta-analyses.
October 2026

Antiandrogen COVID-19 Randomized Controlled Trials

StudyImprovementRR · 95% CIOutcomeTreatmentControlRelative Risk
Early treatment64%0.36 · 0.18–0.747/61822/64464% lower risk
Tau² = 0.00, I² = 0.0%, p = 0.005
Late treatment57%0.43 · 0.27–0.7190/893245/74757% lower risk
Tau² = 0.41, I² = 74.5%, p = 0.00083
All studies58%0.42 · 0.28–0.6497/1,511267/1,39158% lower risk
Tau² = 0.33, I² = 66.3%, p < 0.000100.511.52+
1 CT: study uses combined treatment
2 CS: censored, see details
Rotate screen for more detailsIncrease width for more details
← Antiandrogens
reduce risk
Antiandrogens
increase risk →
Fig. 16. Random-effects meta-analysis for all Randomized Controlled Trials. This plot shows pooled effects, see the specific outcome analyses for individual outcomes. Analysis validating pooled outcomes for COVID-19 can be found below. Effect extraction is pre-specified, using the most serious outcome reported. For details see the appendix.
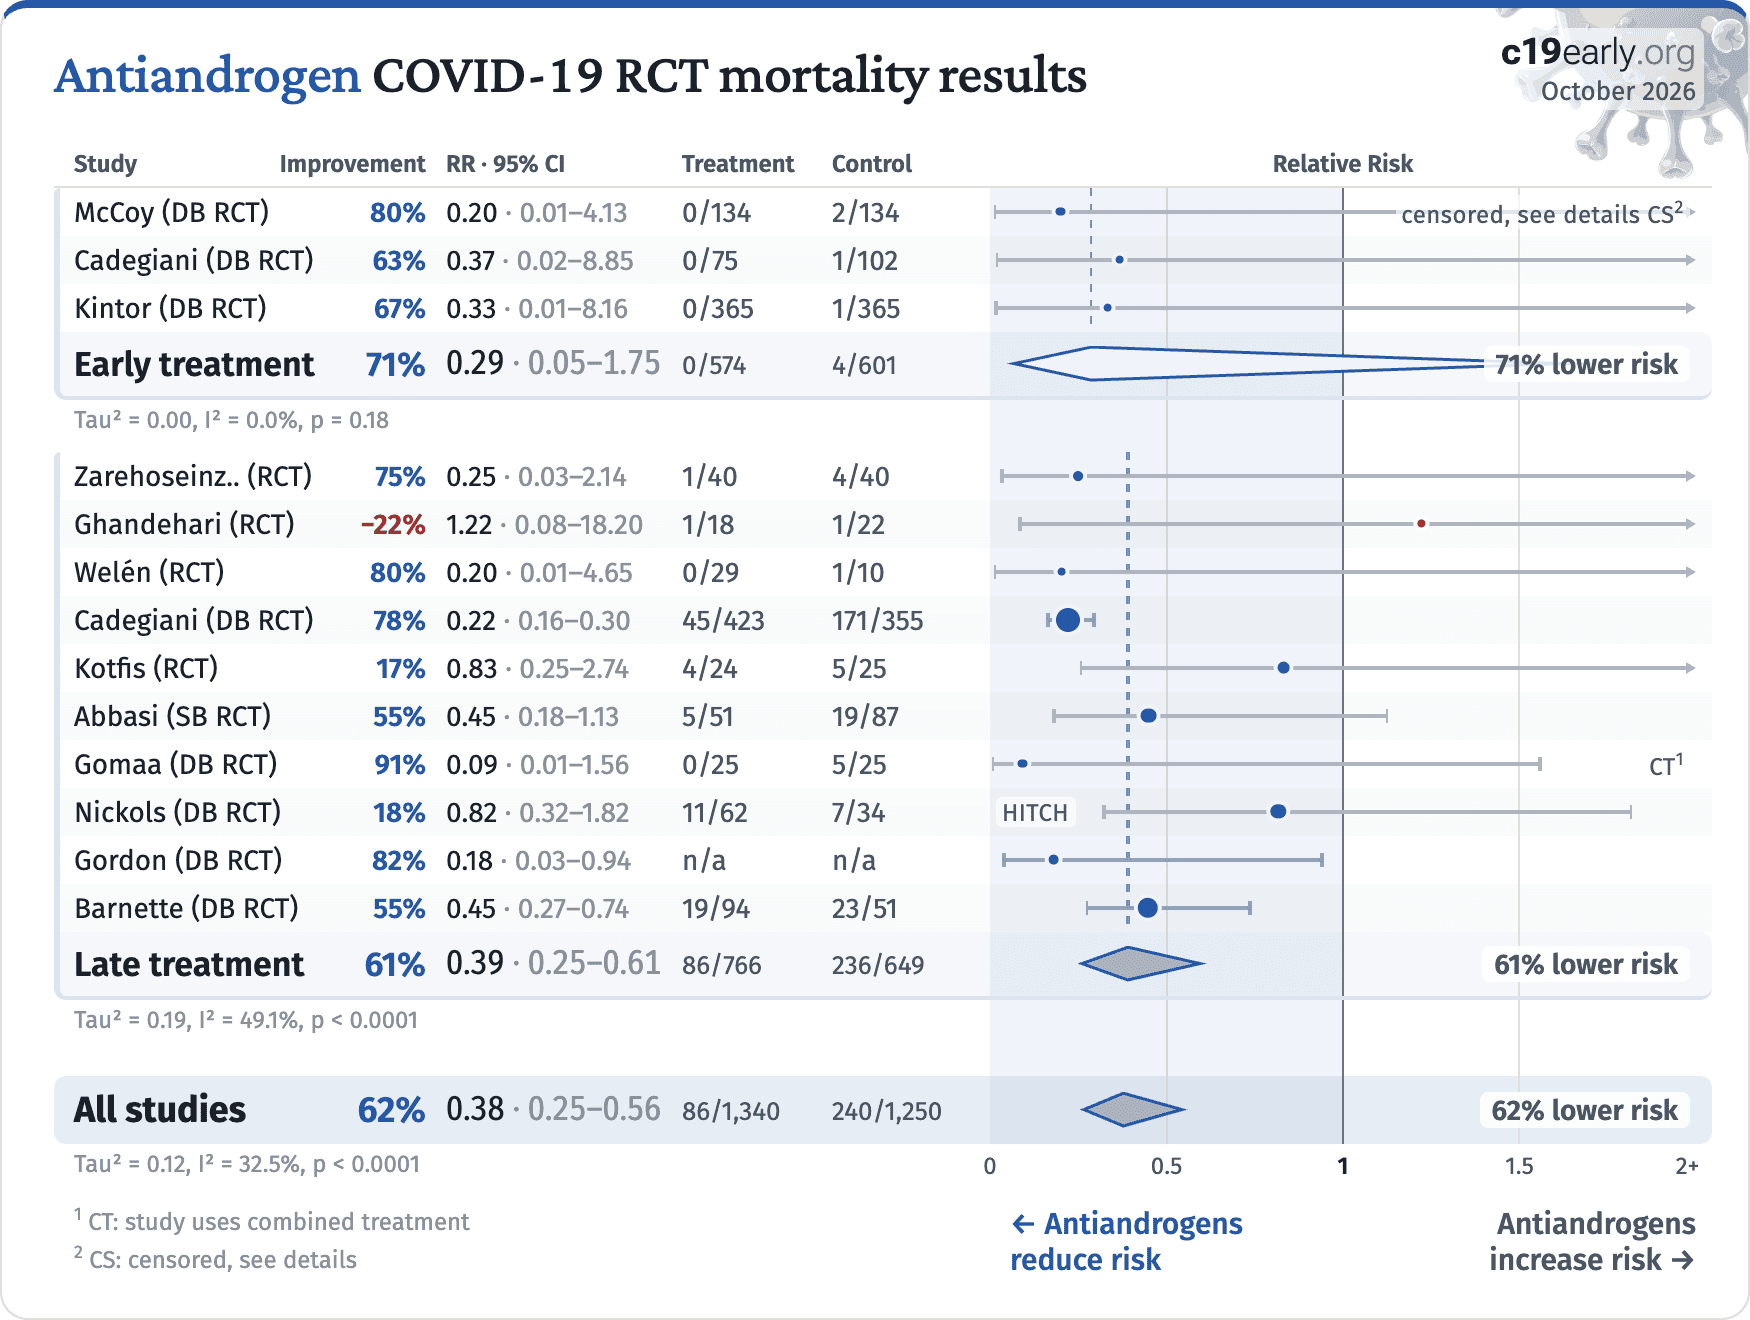
October 2026

Antiandrogen COVID-19 RCT mortality results

StudyImprovementRR · 95% CITreatmentControlRelative Risk
Early treatment71%0.29 · 0.05–1.750/5744/60171% lower risk
Tau² = 0.00, I² = 0.0%, p = 0.18
Late treatment61%0.39 · 0.25–0.6186/766236/64961% lower risk
Tau² = 0.19, I² = 49.1%, p < 0.0001
All studies62%0.38 · 0.25–0.5686/1,340240/1,25062% lower risk
Tau² = 0.12, I² = 32.5%, p < 0.000100.511.52+
1 CT: study uses combined treatment
2 CS: censored, see details
Rotate screen for more detailsIncrease width for more details
← Antiandrogens
reduce risk
Antiandrogens
increase risk →
Fig. 17. Random-effects meta-analysis for RCT mortality results.
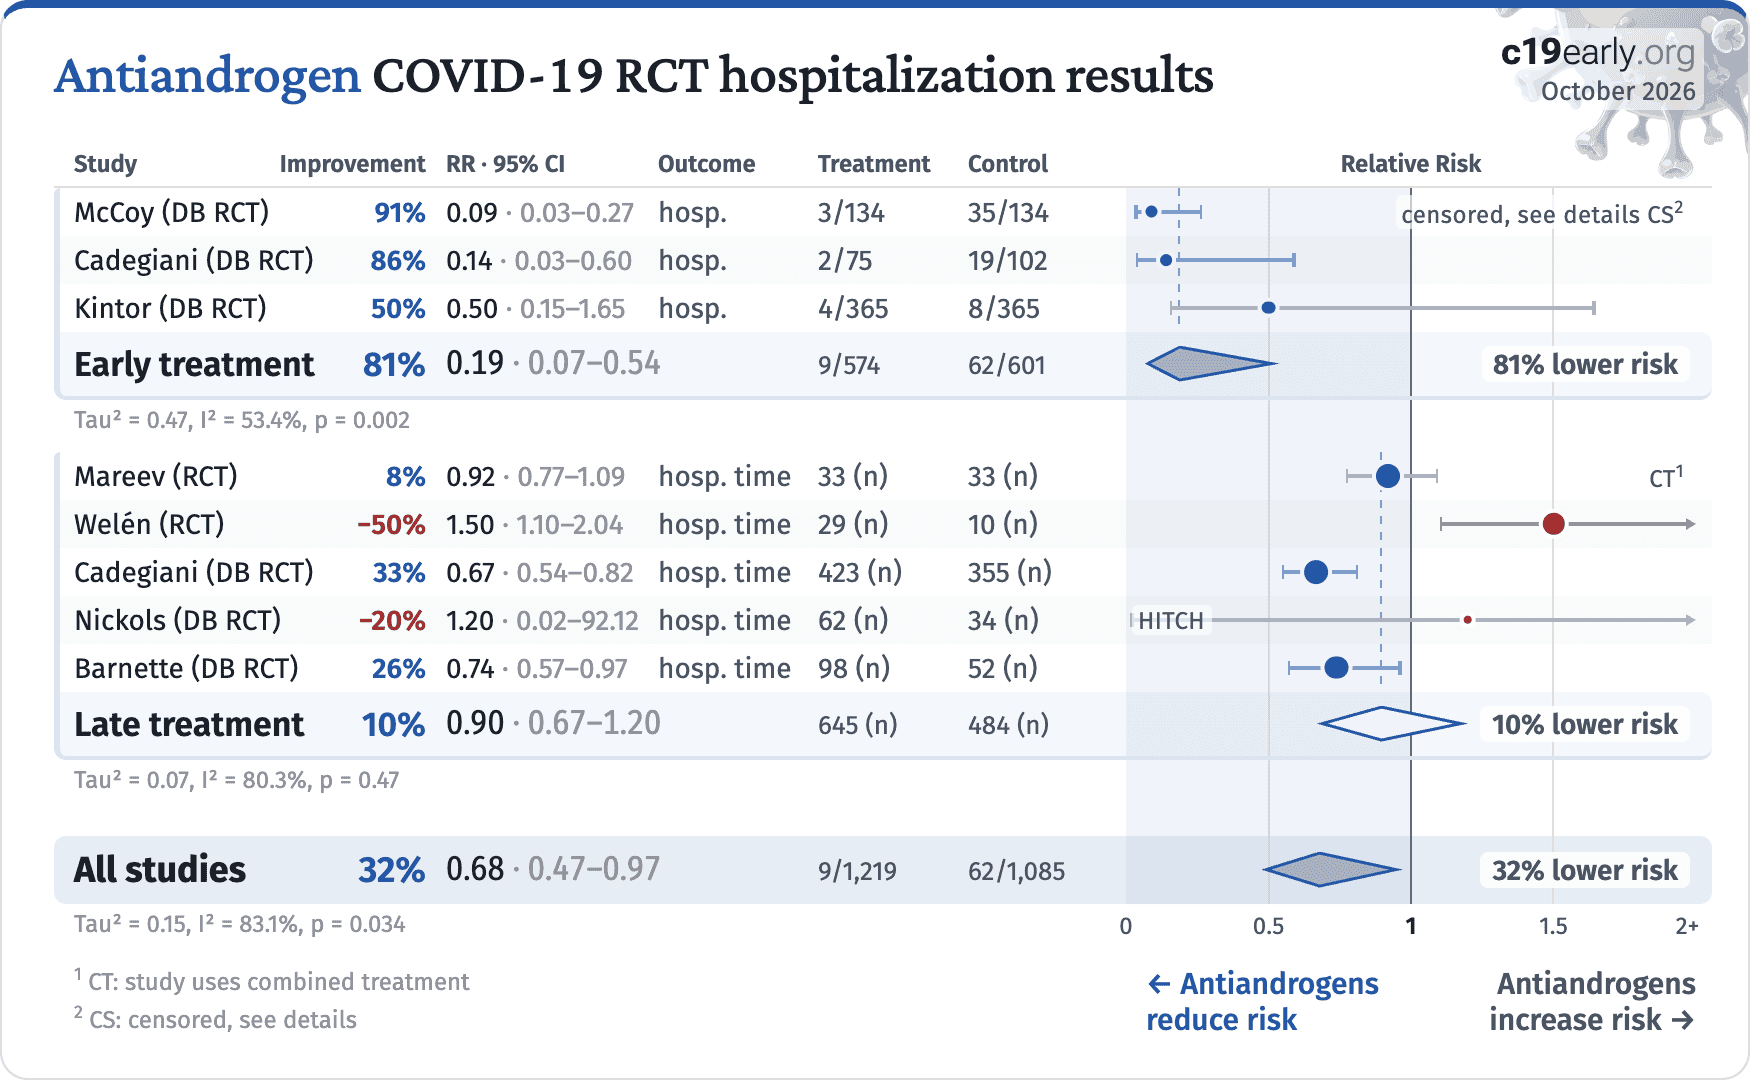
October 2026

Antiandrogen COVID-19 RCT hospitalization results

StudyImprovementRR · 95% CIOutcomeTreatmentControlRelative Risk
Early treatment81%0.19 · 0.07–0.549/57462/60181% lower risk
Tau² = 0.47, I² = 53.4%, p = 0.002
Late treatment10%0.90 · 0.67–1.20645 (n)484 (n)10% lower risk
Tau² = 0.07, I² = 80.3%, p = 0.47
All studies32%0.68 · 0.47–0.979/1,21962/1,08532% lower risk
Tau² = 0.15, I² = 83.1%, p = 0.03400.511.52+
1 CT: study uses combined treatment
2 CS: censored, see details
Rotate screen for more detailsIncrease width for more details
← Antiandrogens
reduce risk
Antiandrogens
increase risk →
Fig. 18. Random-effects meta-analysis for RCT hospitalization results.
To avoid bias in the selection of studies, we analyze all non-retracted studies. Here we show the results after excluding studies with major issues likely to alter results, non-standard studies, and studies where very minimal detail is currently available. Our bias evaluation is based on analysis of each study and identifying when there is a significant chance that limitations will substantially change the outcome of the study. We believe this can be more valuable than checklist-based approaches such as Cochrane GRADE, which can be easily influenced by potential bias, may ignore or underemphasize serious issues not captured in the checklists, and may overemphasize issues unlikely to alter outcomes in specific cases (for example certain specifics of randomization with a very large effect size and well-matched baseline characteristics).
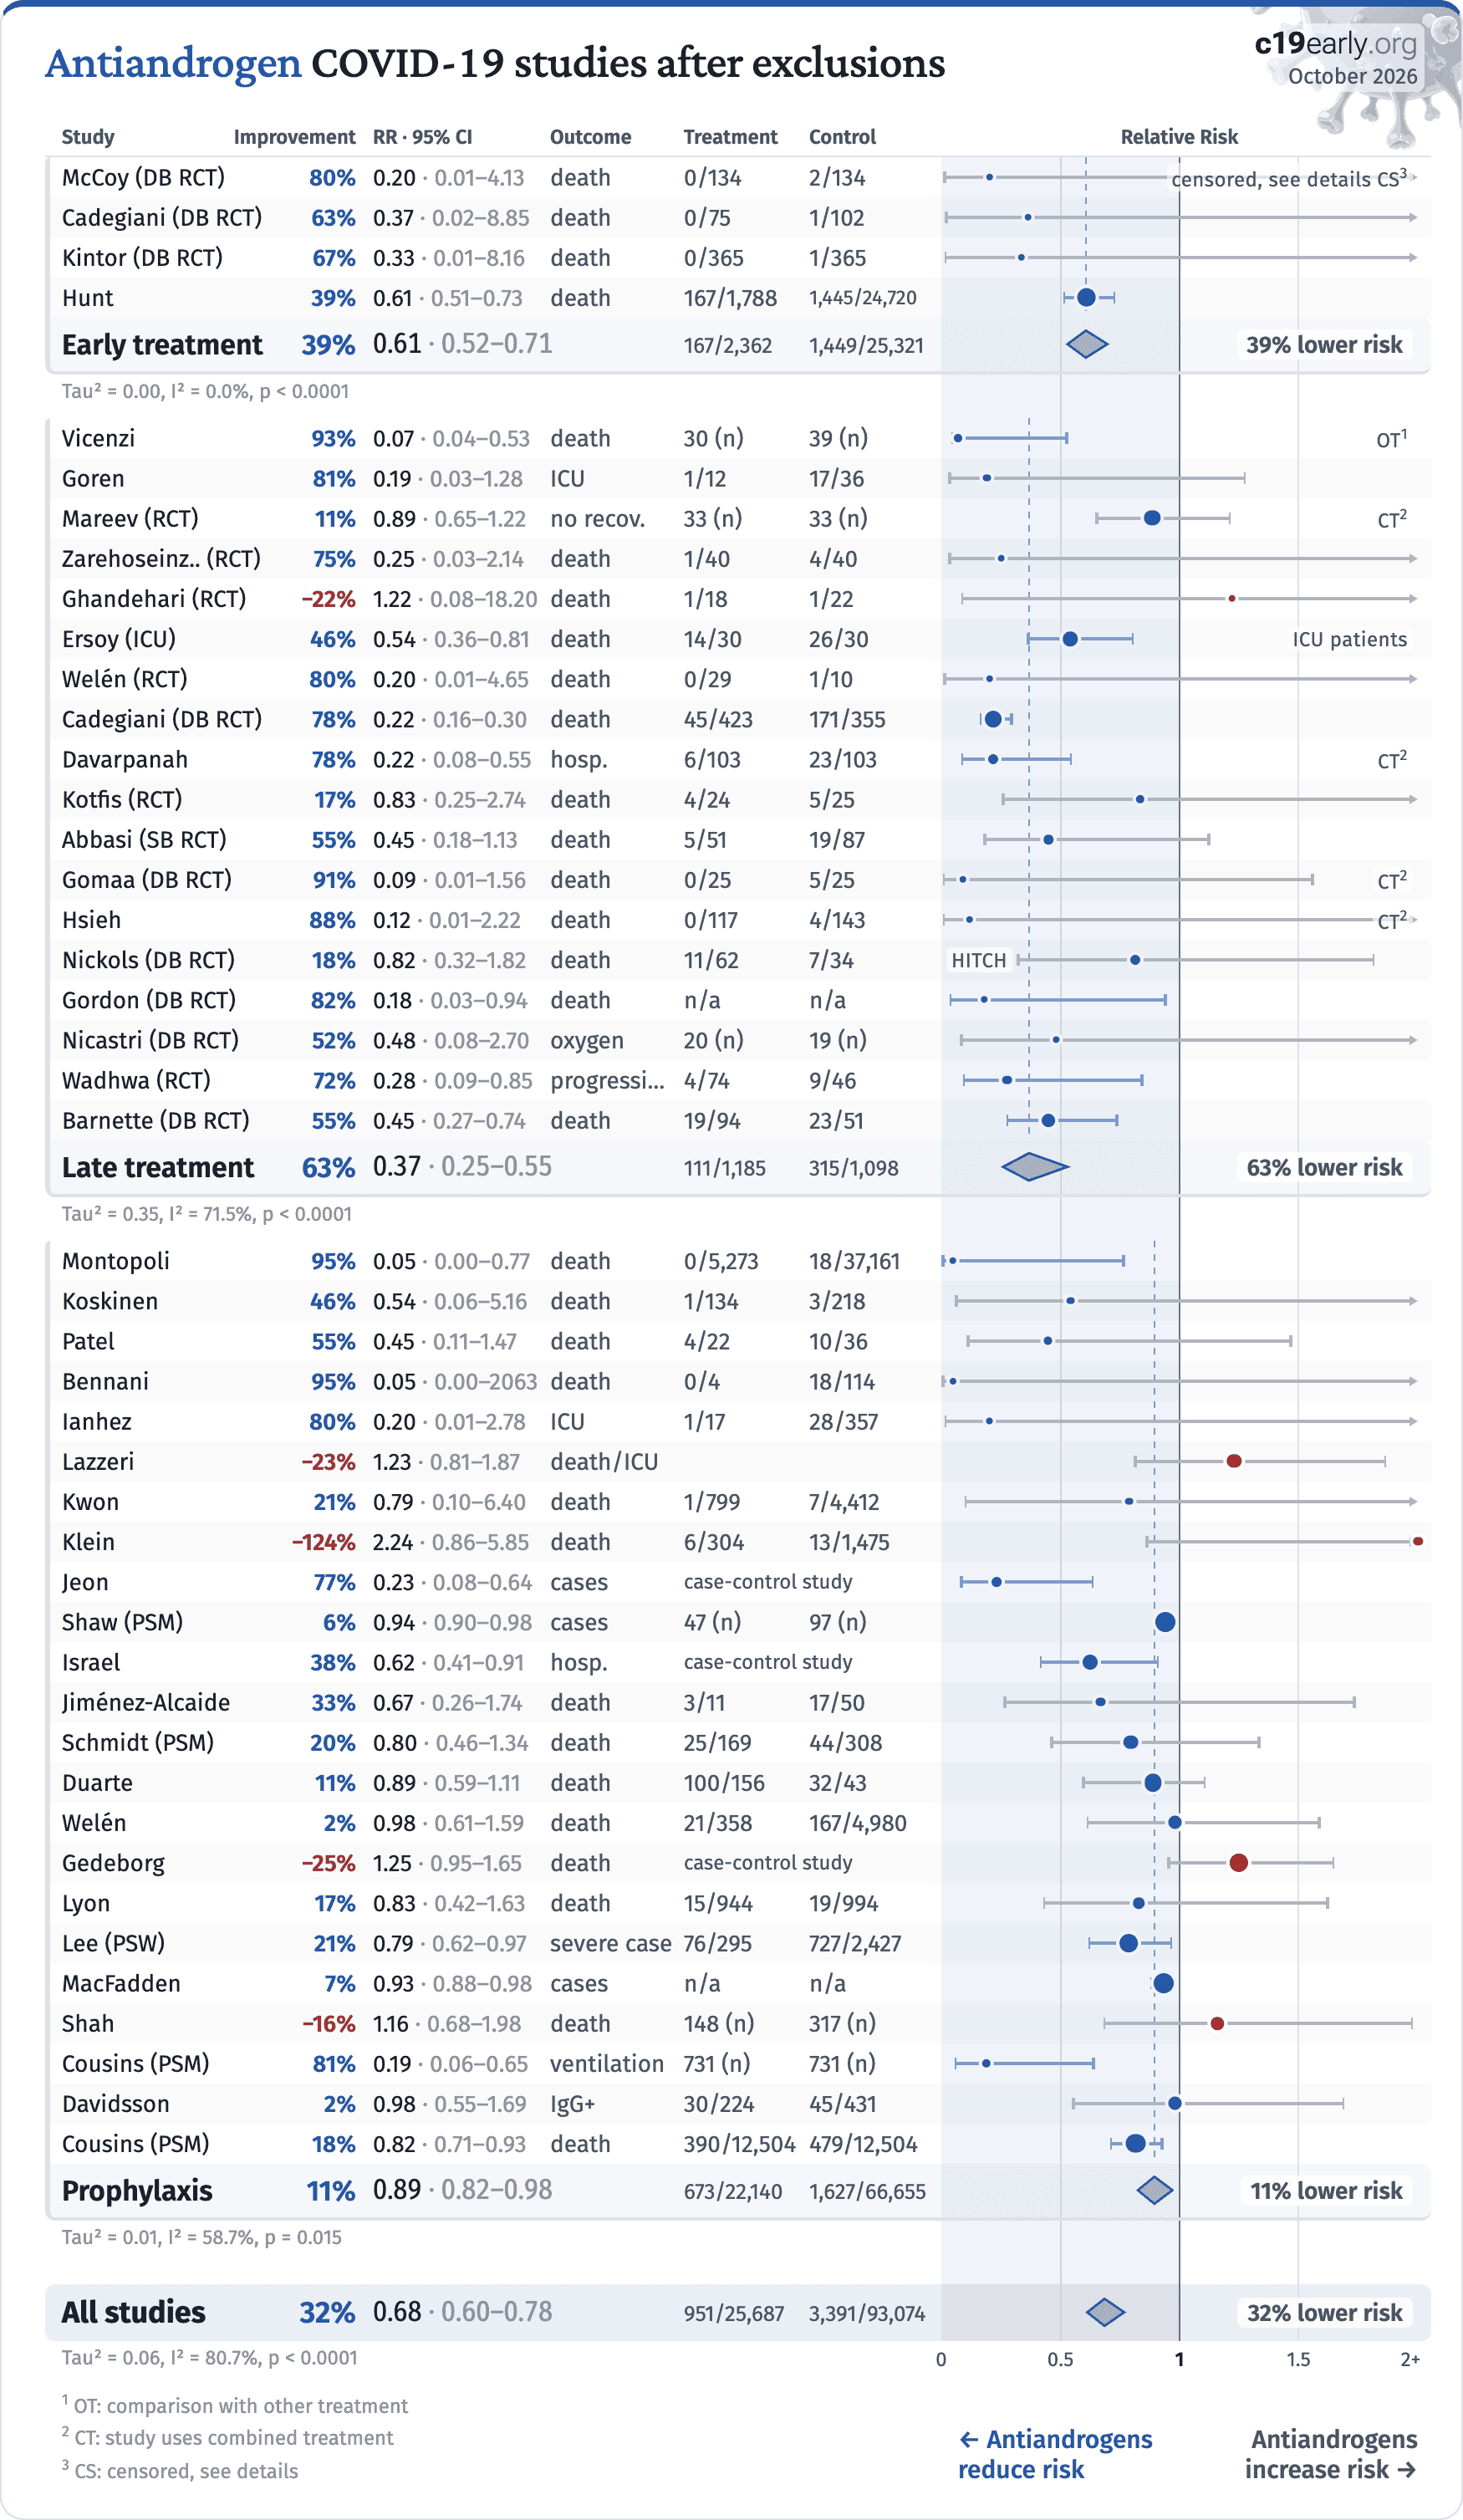
The studies excluded are as below. Fig. 20 shows a forest plot for random-effects meta-analysis of all studies after exclusions.
Cadegiani, potential randomization failure.
Cadegiani (B), significant unadjusted differences between groups.
Holt, unadjusted results with no group details.
Jiménez-Alcaide, excessive unadjusted differences between groups. Excluded results: case.
Kazan, excessive unadjusted differences between groups.
October 2026

Antiandrogen COVID-19 studies after exclusions

StudyImprovementRR · 95% CIOutcomeTreatmentControlRelative Risk
Early treatment39%0.61 · 0.52–0.71167/2,3621,449/25,32139% lower risk
Tau² = 0.00, I² = 0.0%, p < 0.0001
Late treatment63%0.37 · 0.25–0.55111/1,185315/1,09863% lower risk
Tau² = 0.35, I² = 71.5%, p < 0.0001
Prophylaxis11%0.89 · 0.82–0.98673/22,1401,627/66,65511% lower risk
Tau² = 0.01, I² = 58.7%, p = 0.015
All studies32%0.68 · 0.60–0.78951/25,6873,391/93,07432% lower risk
Tau² = 0.06, I² = 80.7%, p < 0.000100.511.52+
1 OT: comparison with other treatment
2 CT: study uses combined treatment
3 CS: censored, see details
Rotate screen for more detailsIncrease width for more details
← Antiandrogens
reduce risk
Antiandrogens
increase risk →
Fig. 20. Random-effects meta-analysis for all studies after exclusions. This plot shows pooled effects, see the specific outcome analyses for individual outcomes. Analysis validating pooled outcomes for COVID-19 can be found below. Effect extraction is pre-specified, using the most serious outcome reported. For details see the appendix.
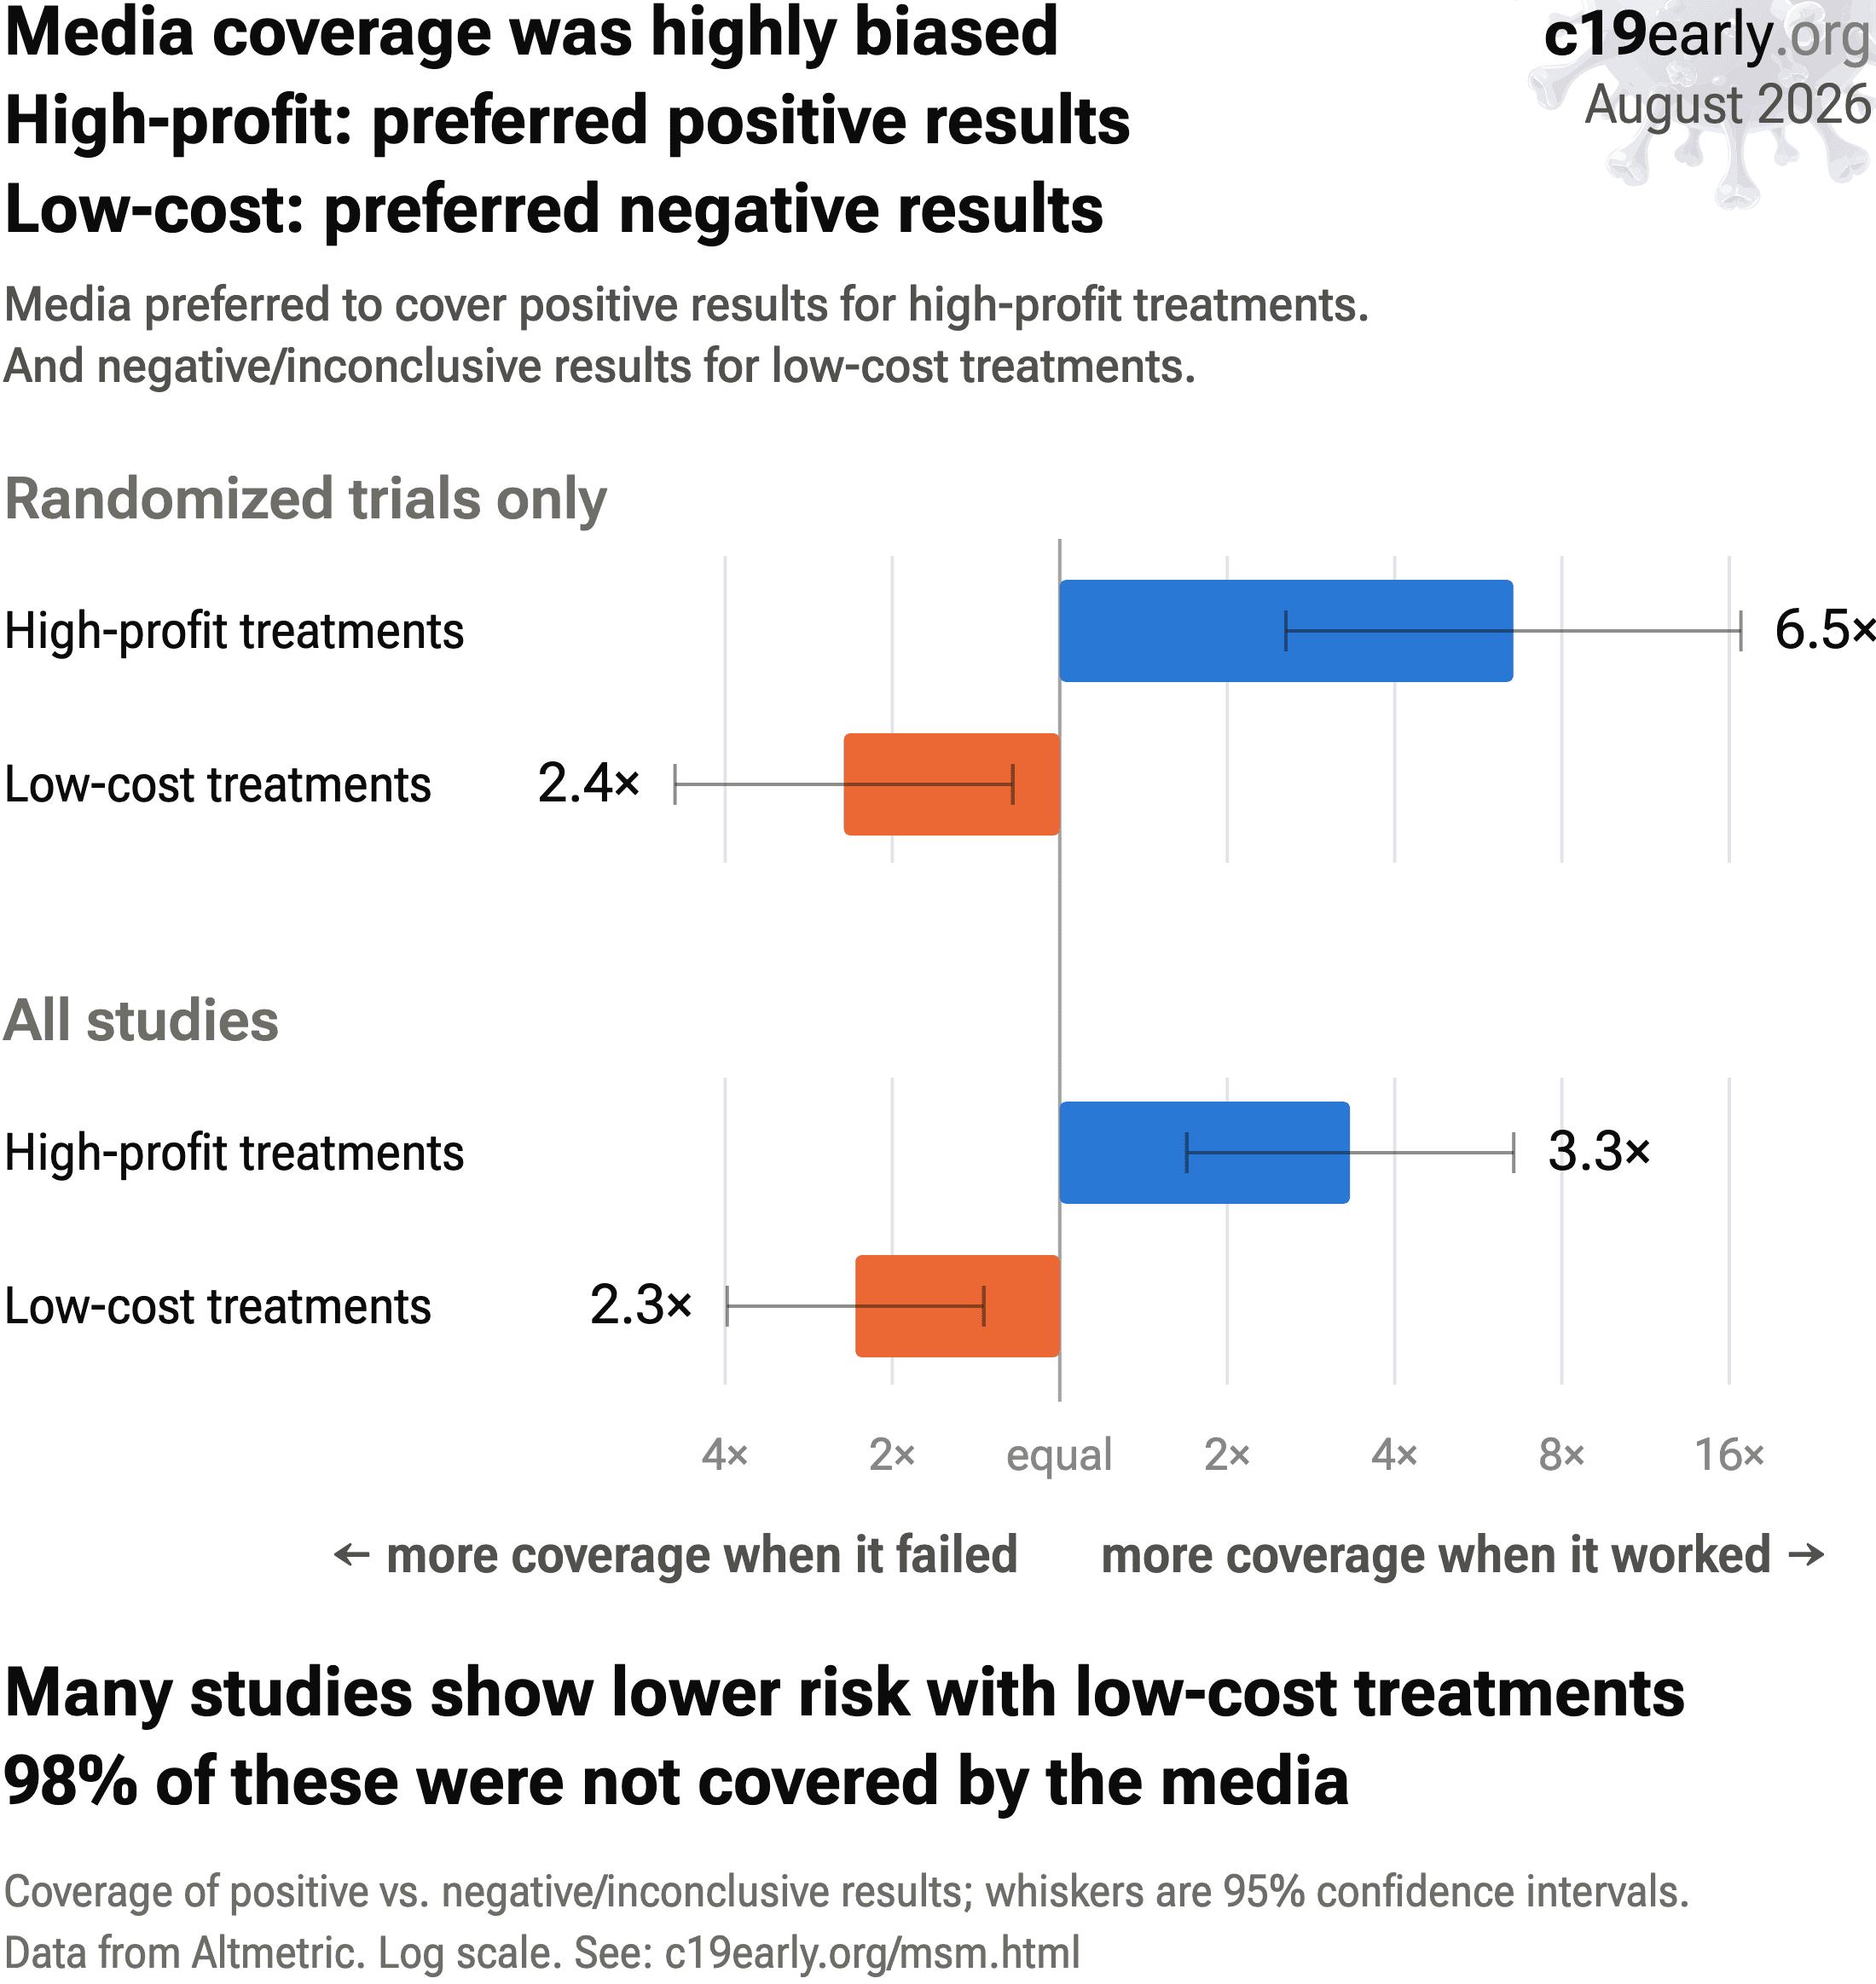
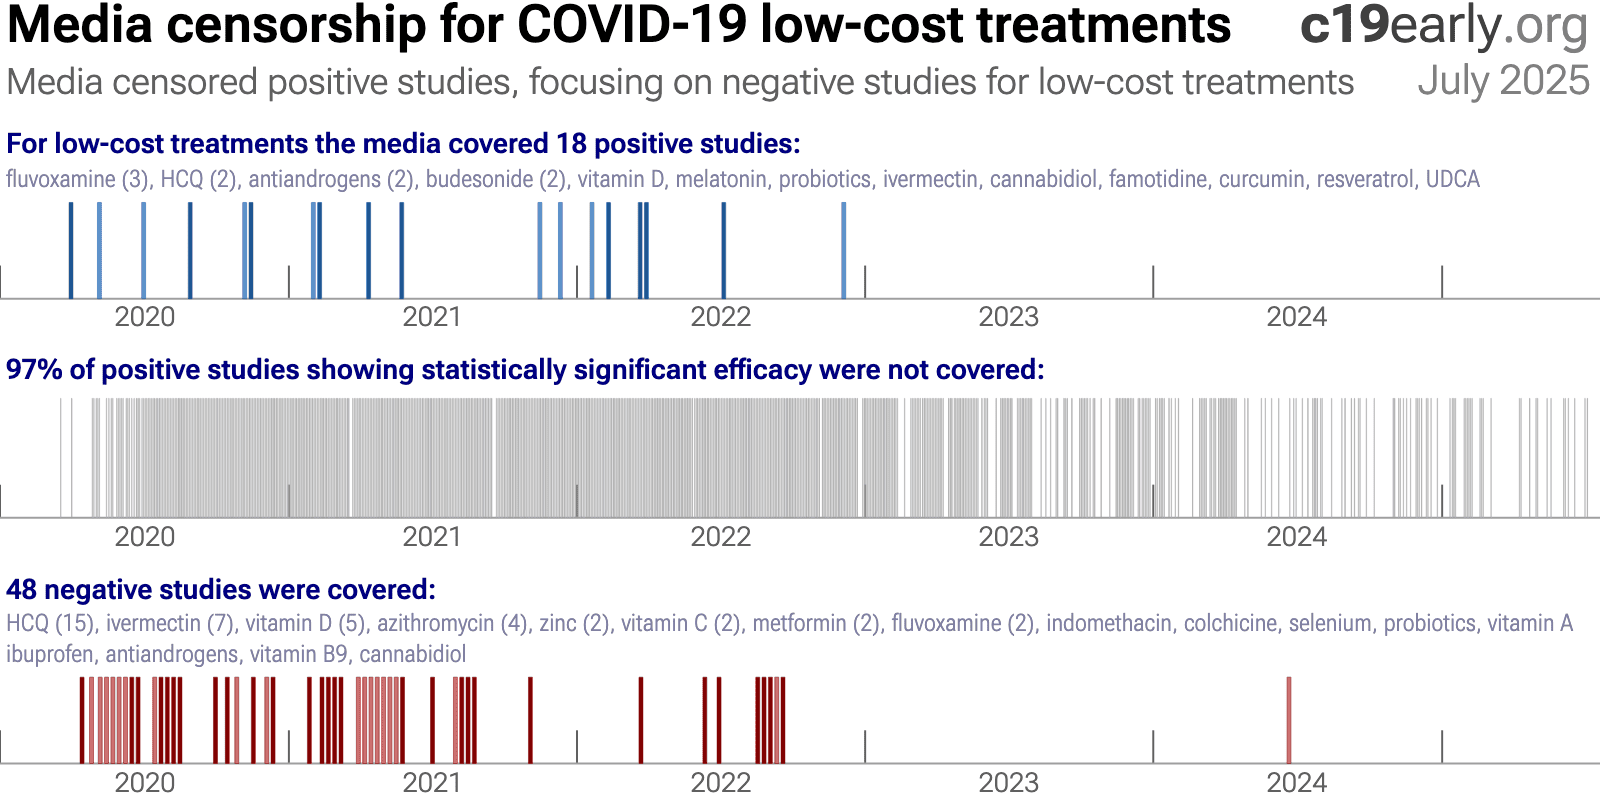
Low-cost treatments were subject to bias and censorship during the pandemic. Scientific bias is seen in the design, analysis, presentation, and selective reporting of studies, which often favored negative results. A similar bias is seen in the media coverage for low-cost treatments. While broadly seen, bias was particularly notable for ivermectin and hydroxychloroquine, e.g., Scott Alexander noted that "if you say anything in favor of ivermectin you will be cast out of civilization and thrown into the circle of social hell reserved for Klan members and 1/6 insurrectionists. All the health officials in the world will shout 'horse dewormer!' at you and compare you to Josef Mengele."42.
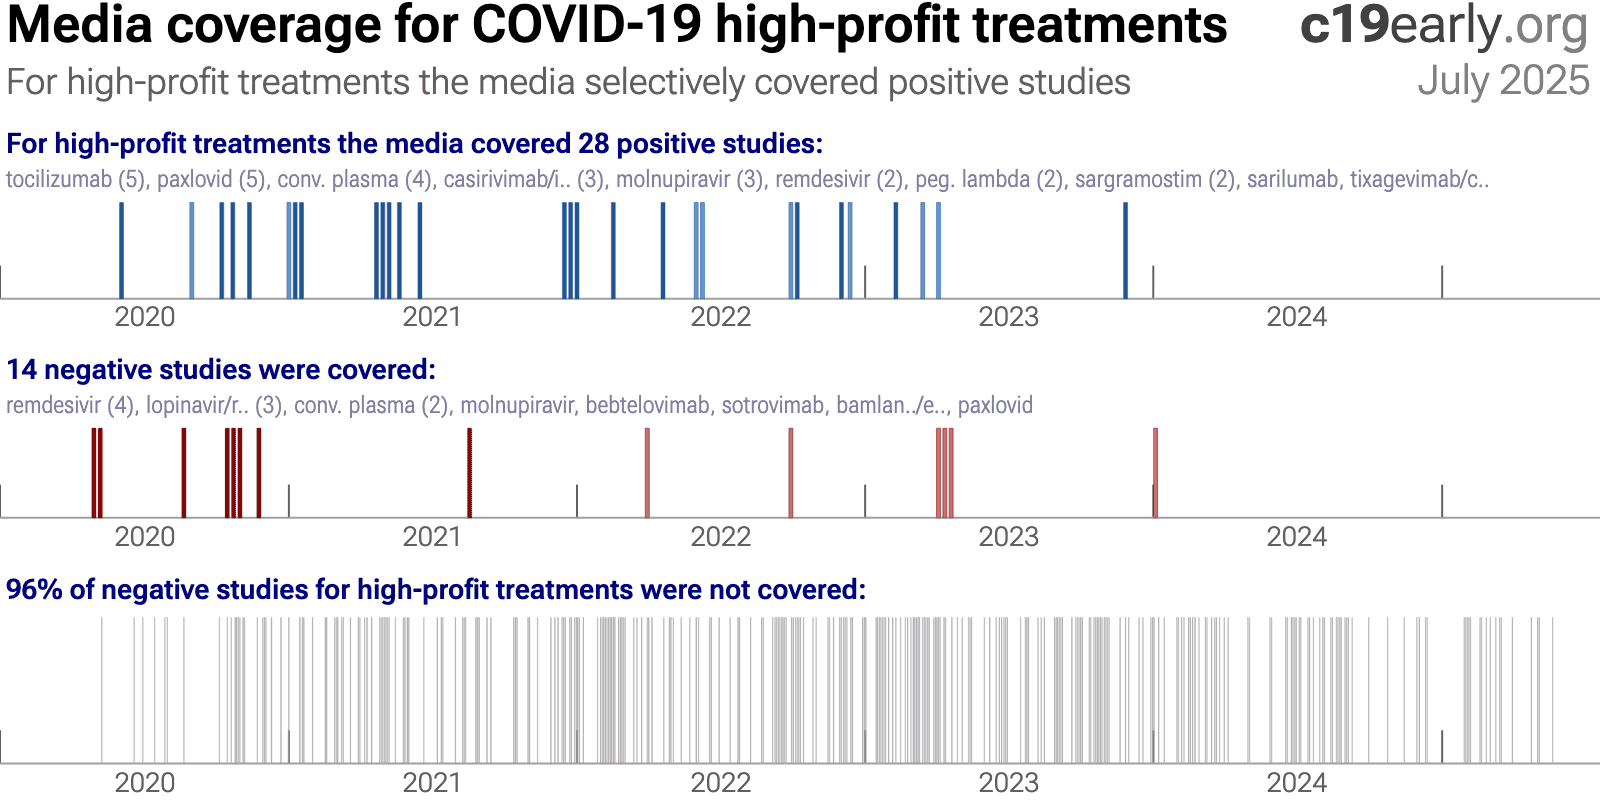
We analyze media coverage for the 226 treatments we cover using Altmetric71, which reports the number of ~12,000 tracked news outlets that covered each study72. Studies are considered to have received significant media coverage if they were covered by at least 0.5% of the tracked news outlets. Fig. 21, 22, and 23 show the bias toward negative results for low-cost treatments, in contrast to the opposite bias for high-profit treatments. This may result in widespread incorrect perceptions on the relative efficacy of high-profit and low-cost treatments. The impact is significant—increased cost limits the use of high-profit treatments and treatment equity, and high-profit treatments were also more difficult to access, especially for earlier treatment which improves efficacy and minimizes community transmission.
Loading..
Fig. 21. Media was more likely to cover negative or inconclusive results for low-cost treatments, and positive results for high-profit treatments.
Loading..
Loading..
Fig. 22. Mainstream media was biased against positive results for low-cost treatments.
Loading..
Loading..
Fig. 23. In contrast to the results for low-cost treatments, mainstream media was biased towards positive results for high-cost treatments.
A combination of factors may have led to the media's suppression of low-cost treatments:
•
Politicization
led to a media environment where coverage was often framed to support a political narrative rather than to provide objective scientific information. As Scott Alexander said:
"if you say anything in favor of ivermectin you will be cast out of civilization and thrown into the circle of social hell reserved for Klan members and 1/6 insurrectionists. All the health officials in the world will shout 'horse dewormer!' at you and compare you to Josef Mengele."
There was strong social pressure to discredit low-cost treatments.
•
Censorship
of information conflicting with selected authorities. For example, individuals and organizations presenting conflicting science were often banned on Twitter and YouTube.
•
FDA requires "no adequate, approved, and available alternatives"
in order to grant an EUA for novel high-profit interventions, creating a strong incentive for authorities to ignore or downplay existing low-cost treatments.
•
Regulatory capture
biases authorities towards high-profit interventions.
•
Authorities ignored most evidence for low-cost treatments
, for example the NIH references only 2% of studies in delayed, rarely-updated, biased commentaries with no quantitive analysis.
•
Media coverage of science is often not very accurate
, e.g., misunderstanding confounding issues. For example the media widely considered the RECOVERY HCQ RCT to be conclusive on efficacy, but very late treatment of late stage patients (mostly on oxygen already) with an excessive toxic dose (shown dangerous in a dose comparison RCT) provides no information on the recommended early/prophylactic treatment. With difficulting in understanding basic confounders like treatment delay and dose, the media may favor deferring to authorities. Many studies for low-cost treatments require greater expertise to analyze. Relatively few journalists have a strong ability to analyze clinical trials and are outnumbered by the rest.
•
Substantial funding from pharmaceutical advertising
biases editorial decisions towards high-profit interventions.
•
PR power
- companies/teams with strong PR presence are favored in the media, which correlates with high-profit and high conflict of interest studies.
•
The media was very negative in general
, inflating risk, fear, and anxieties. A negative bias may improve ratings and revenue, increasing motivation to continue watching coverage. A combination of low-cost treatments greatly reducing risk conflicts with the negative narrative.
25 low-cost treatments were approved in one or more countries, yet many countries approved no low-cost treatments. The countries that did adopt low-cost treatments analyzed the evidence early and made timely approvals. With few exceptions, authorities did not change their initial views, regardless of how much evidence accumulated showing either efficacy or harm. Why?
The harms of smoking here hidden for 25 yearsC. Authorities did not analyze the data in real-time, failing to act when harm was known. Widespread acknowledgement of harm came only after attempts by two new surgeon generals, along with pressure from health advocates and a new president, and a review of 7,000 studies.
Similarly for COVID-19, most authorities and experts did not proactively analyze data in real-time. This guarantees delayed recognition of efficacy or harm, by which time moral, legal, career, and reputational liabilities strongly disincentivize any admission of error. Claims of no efficacy (for effective treatments) or safety (for harmful treatments) were often made prior to strong data being available. Correction would require admitting to errors that increased mortality, which is unlikely with the same generation of officials.
Analysis of potential treatments was rarely done, and when done these were typically minimal efforts. For example, NIH reviews were highly delayed, cover only a tiny fraction of treatments, reference only 2% of studies for the treatments covered, and include no quantitative analysis. They appear as rarely updated side projects from external panels implicitly tasked with justifying prior failures. As with smoking, the thousands of studies could (and should) have been analyzed and acted on in real-time.
A key structural improvement, applicable to all current and future diseases, is for authorities to implement real-time proactive analysis of clinical evidence. This does not remove all bias, but does make it possible to act on evidence, whereas delayed action may be unlikely due to moral, legal, career, and reputational liabilities.
c19early.org
Delayed public health acknowledgments
Official acknowledgment of efficacy or harm is often delayed—legal, career, and status risks disincentivize admission of error.
Evidence Official Acknowledgment Approx. Delay
Citrus Fruit (vitamin C) for Scurvy (effectiveness) 1747: James Lind conducted one of the first-ever controlled clinical trials, proving that oranges and lemons cured scurvy in sailors. 1795: The British Royal Navy finally made a daily ration of lemon juice a standard issue for all its sailors, effectively eliminating the disease. 48 years
Handwashing (lower mortality) 1847: Dr. Ignaz Semmelweis provided conclusive proof that having doctors wash their hands with a chlorine solution before delivering babies reduced maternal mortality rates from over 18% to around 1%. ~1870s: Semmelweis's findings were rejected and he was ridiculed. His work was only validated decades later (after his death). ~20+ years
Helicobacter pylori (bacteria causes ulcers) 1982-1984: Marshall and Warren discovered that Helicobacter pylori bacteria causes ulcers, confirmed via direct exposure. Officials maintained that ulcers were caused by stress and spicy food. 1994: The US NIH released a consensus statement officially recommending antibiotics as the standard treatment for peptic ulcers, overturning decades of acid-suppression therapy. ~12 years
Asbestos (causes asbestosis & cancer) 1924: The British Medical Journal published the first case study of a death from "asbestosis." By 1918, U.S. insurance companies had stopped selling life insurance to asbestos workers. 1971 (US): The Occupational Safety and Health Administration (OSHA) was formed and began regulating asbestos as a carcinogen, setting the first federal workplace safety standards for it. ~47 years
Leaded Gasoline (neurotoxicity) ~1924: Dangers of low-level lead exposure were known. Experts like Alice Hamilton warned the U.S. Surgeon General that adding lead to gasoline would cause widespread public poisoning. 1973 (US): The Environmental Protection Agency (EPA) ordered the first phasedown of lead in gasoline, following the Clean Air Act of 1970. A full ban for on-road vehicles took effect in 1996. ~49 years
Harms of Smoking (causes lung cancer) 1939: Franz Müller (Germany) published the first case-control epidemiological study strongly linking tobacco smoking to lung cancer. This was followed by major U.S. & U.K. studies in the 1950s. 1964 (US): The U.S. Surgeon General's report, "Smoking and Health," was released. It was the first U.S. government report to definitively link smoking to lung cancer and heart disease. 25 years
Heterogeneity in COVID-19 studies arises from many factors including:
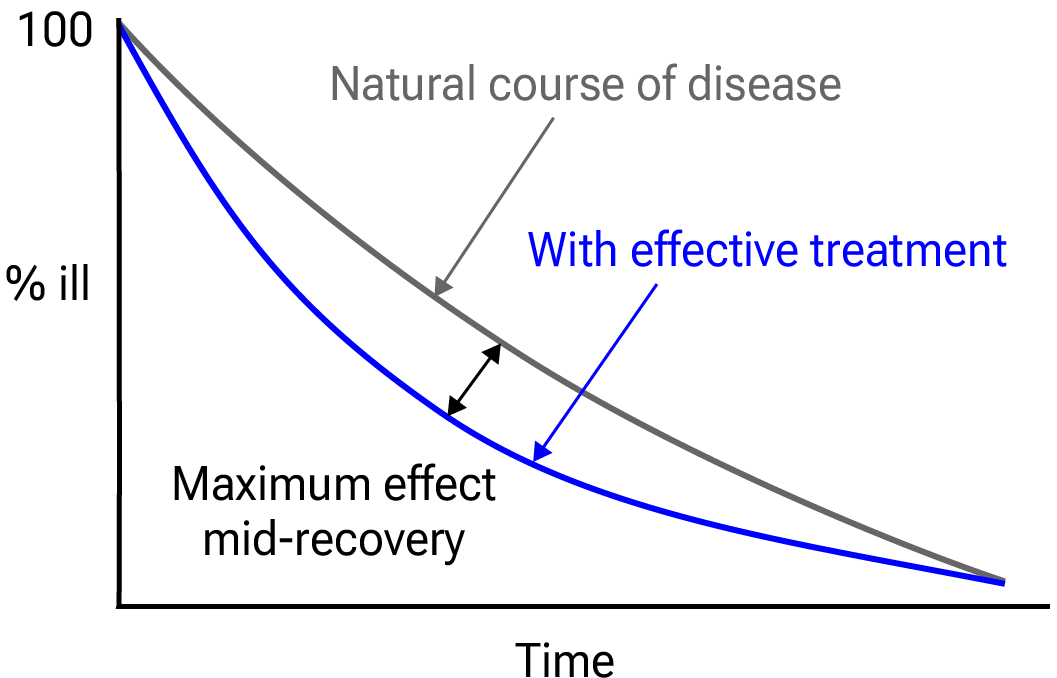
The time between infection or the onset of symptoms and treatment may critically affect how well a treatment works. For example an antiviral may be very effective when used early but may not be effective in late stage disease, and may even be harmful. Oseltamivir, for example, is generally only considered effective for influenza when used within 0-36 or 0-48 hours73,74. Baloxavir marboxil studies for influenza also show that treatment delay is critical — Ikematsu et al. report an 86% reduction in cases for post-exposure prophylaxis, Hayden et al. show a 33 hour reduction in the time to alleviation of symptoms for treatment within 24 hours and a reduction of 13 hours for treatment within 24-48 hours, and Kumar et al. report only 2.5 hours improvement for inpatient treatment.
Table 3. Studies of baloxavir marboxil for influenza show that early treatment is more effective.
Treatment delayResult
Post-exposure prophylaxis86% fewer cases75
<24 hours-33 hours symptoms76
24-48 hours-13 hours symptoms76
Inpatients-2.5 hours to improvement77
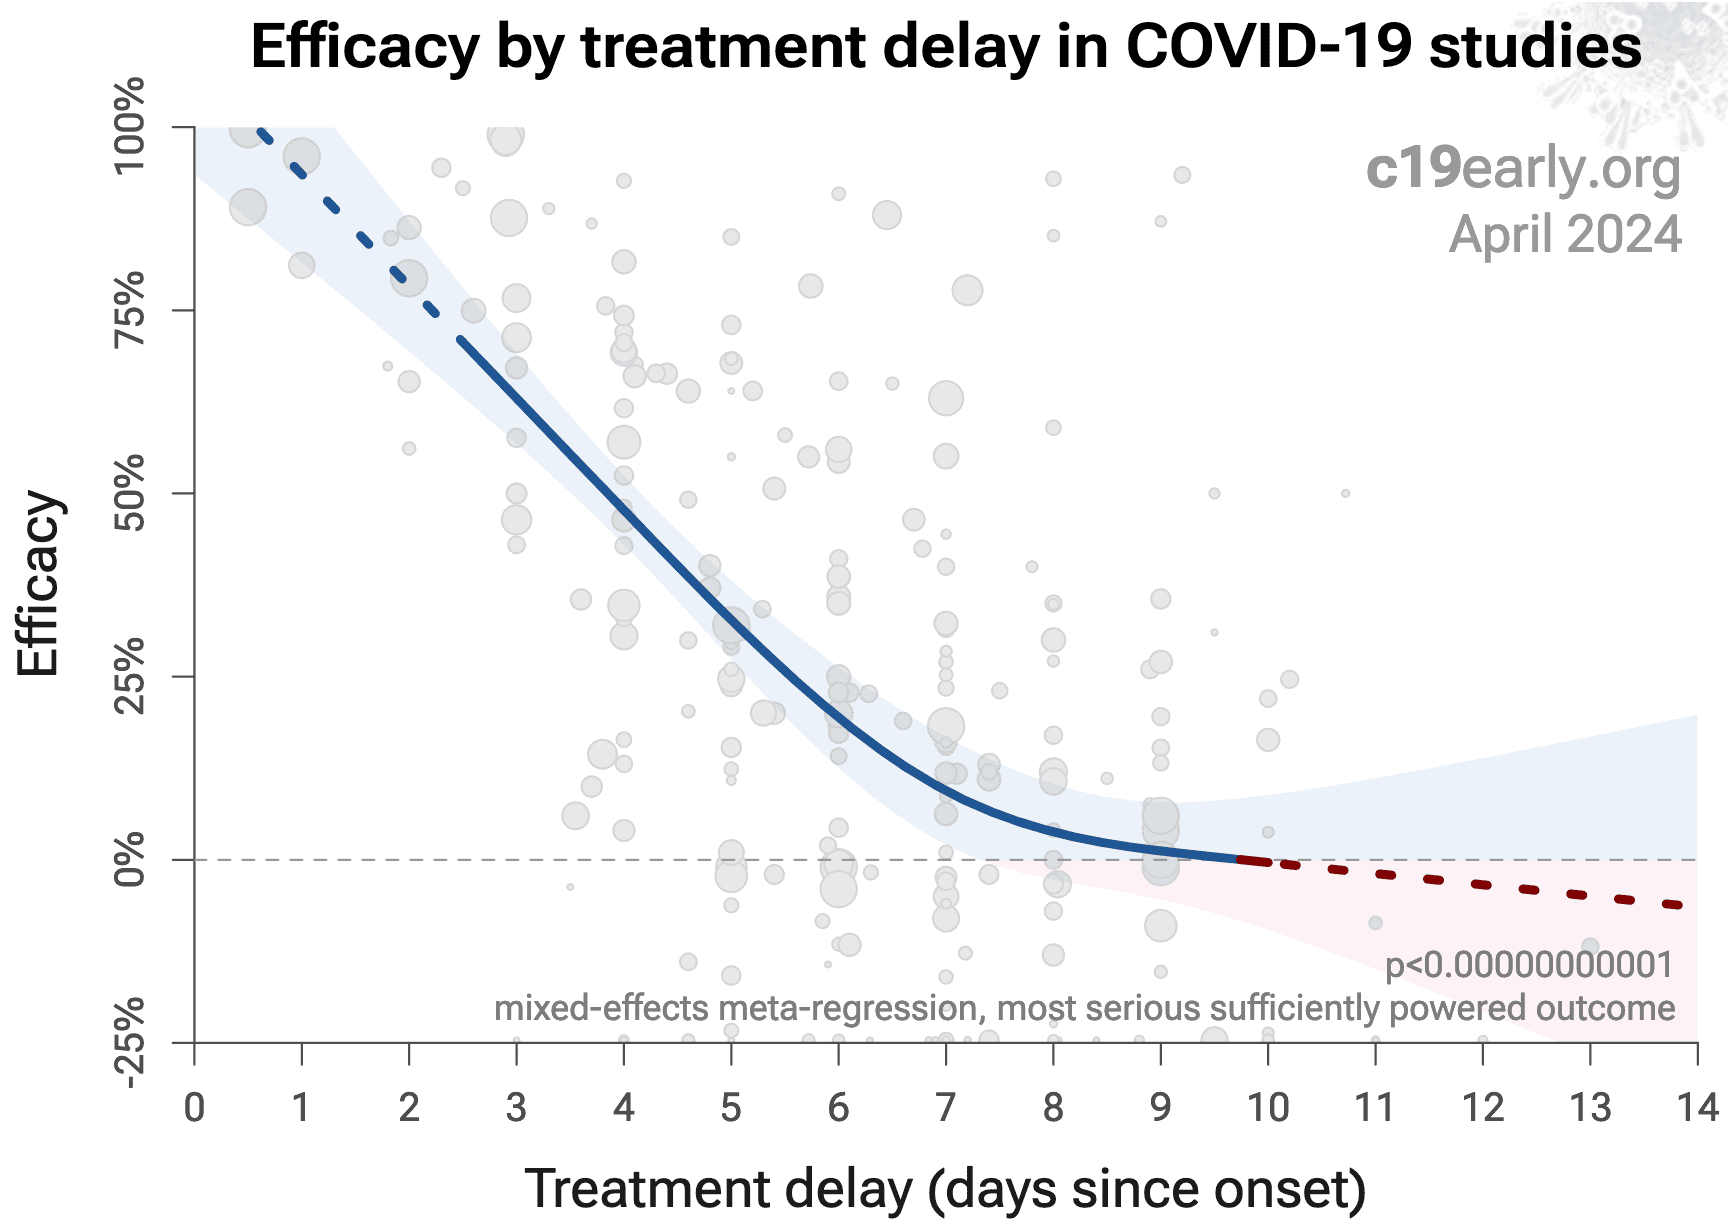
Fig. 24 shows a mixed-effects meta-regression for efficacy as a function of treatment delay in COVID-19 studies from 226 treatments, showing that efficacy declines rapidly with treatment delay. Early treatment is critical for COVID-19.
Loading..
Fig. 24. Early treatment is more effective. Meta-regression showing efficacy as a function of treatment delay in COVID-19 studies from 226 treatments.
Details of the patient population including age and comorbidities may critically affect how well a treatment works. For example, many COVID-19 studies with relatively young low-comorbidity patients show all patients recovering quickly with or without treatment. In such cases, there is little room for an effective treatment to improve results, for example as in López-Medina et al.
Efficacy may depend critically on the distribution of SARS-CoV-2 variants encountered by patients. Risk varies significantly across variants79, for example the Gamma variant shows significantly different characteristics80-83. Different mechanisms of action may be more or less effective depending on variants, for example the degree to which TMPRSS2 contributes to viral entry can differ across variants84,85.
Effectiveness may depend strongly on the dosage and treatment regimen.
The quality of medications may vary significantly between manufacturers and production batches, which may significantly affect efficacy and safety. Williams et al. analyze ivermectin from 11 different sources, showing highly variable antiparasitic efficacy across different manufacturers. Xu et al. analyze a treatment from two different manufacturers, showing 9 different impurities, with significantly different concentrations for each manufacturer.
The use of other treatments may significantly affect outcomes, including supplements, other medications, or other interventions such as prone positioning. Treatments may be synergistic88-112, therefore efficacy may depend strongly on combined treatments.
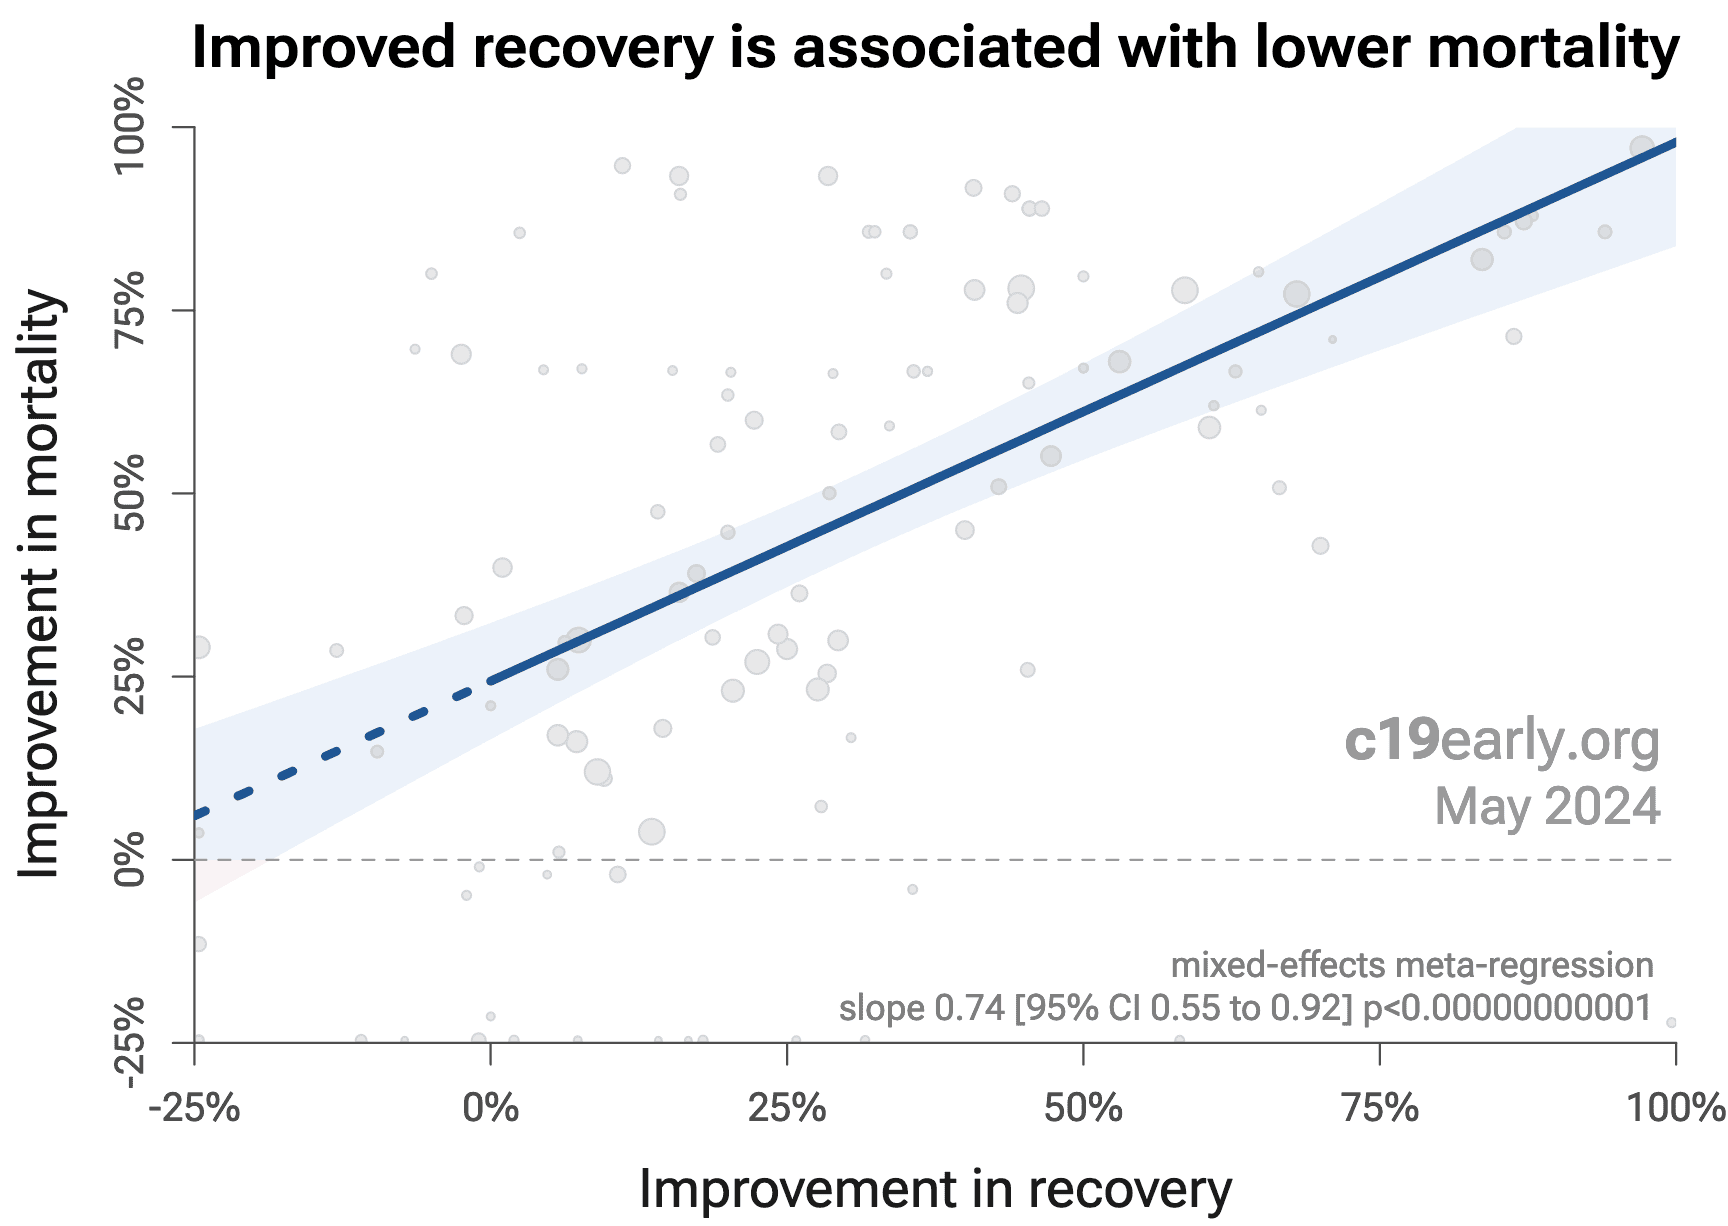
Across all studies there is a strong association between different outcomes, for example improved recovery is strongly associated with lower mortality. However, efficacy may differ depending on the effect measured, for example a treatment may be more effective against secondary complications and have minimal effect on viral clearance.
The distribution of studies will alter the outcome of a meta-analysis. Consider a simplified example where everything is equal except for the treatment delay, and effectiveness decreases to zero or below with increasing delay. If there are many studies using very late treatment, the outcome may be negative, even though early treatment is very effective. All meta-analyses combine heterogeneous studies, varying in population, variants, and potentially all factors above, and therefore may obscure efficacy by including studies where treatment is less effective. Generally, we expect the estimated effect size from meta-analysis to be less than that for the optimal case. Looking at all studies is valuable for providing an overview of all research, important to avoid cherry-picking, and informative when a positive result is found despite combining less-optimal situations. However, the resulting estimate does not apply to specific cases such as early treatment in high-risk populations. While we present results for all studies, we also present treatment time and individual outcome analyses, which may be more informative for specific use cases.
This section validates the use of pooled effects for COVID-19, which enables earlier detection of efficacy, however pooled effects are no longer required for antiandrogens as of September 2021. Efficacy is now known based on specific outcomes for all studies and when restricted to RCTs. Efficacy based on specific outcomes was delayed by 11.6 months compared to using pooled outcomes.
For COVID-19, delay in clinical results translates into additional death and morbidity, as well as additional economic and societal damage. Combining the results of studies reporting different outcomes is required. There may be no mortality in a trial with low-risk patients, however a reduction in severity or improved viral clearance may translate into lower mortality in a high-risk population. Different studies may report lower severity, improved recovery, and lower mortality, and the significance may be very high when combining the results. "The studies reported different outcomes" is not a good reason for disregarding results. Pooling the results of studies reporting different outcomes allows us to use more of the available information. Logically we should, and do, use additional information when evaluating treatments—for example dose-response and treatment delay-response relationships provide additional evidence of efficacy that is considered when reviewing the evidence for a treatment.
We present both specific outcome and pooled analyses. In order to combine the results of studies reporting different outcomes we use the most serious outcome reported in each study, based on the thesis that improvement in the most serious outcome provides comparable measures of efficacy for a treatment. A critical advantage of this approach is simplicity and transparency. There are many other ways to combine evidence for different outcomes, along with additional evidence such as dose-response relationships, however these increase complexity.
Trials with high-risk patients may be restricted due to ethics for treatments that are known or expected to be effective, and they increase difficulty for recruiting. Using less severe outcomes as a proxy for more serious outcomes allows faster and safer collection of evidence.
For many COVID-19 treatments, a reduction in mortality logically follows from a reduction in hospitalization, which follows from a reduction in symptomatic cases, which follows from a reduction in PCR positivity. We can directly test this for COVID-19.
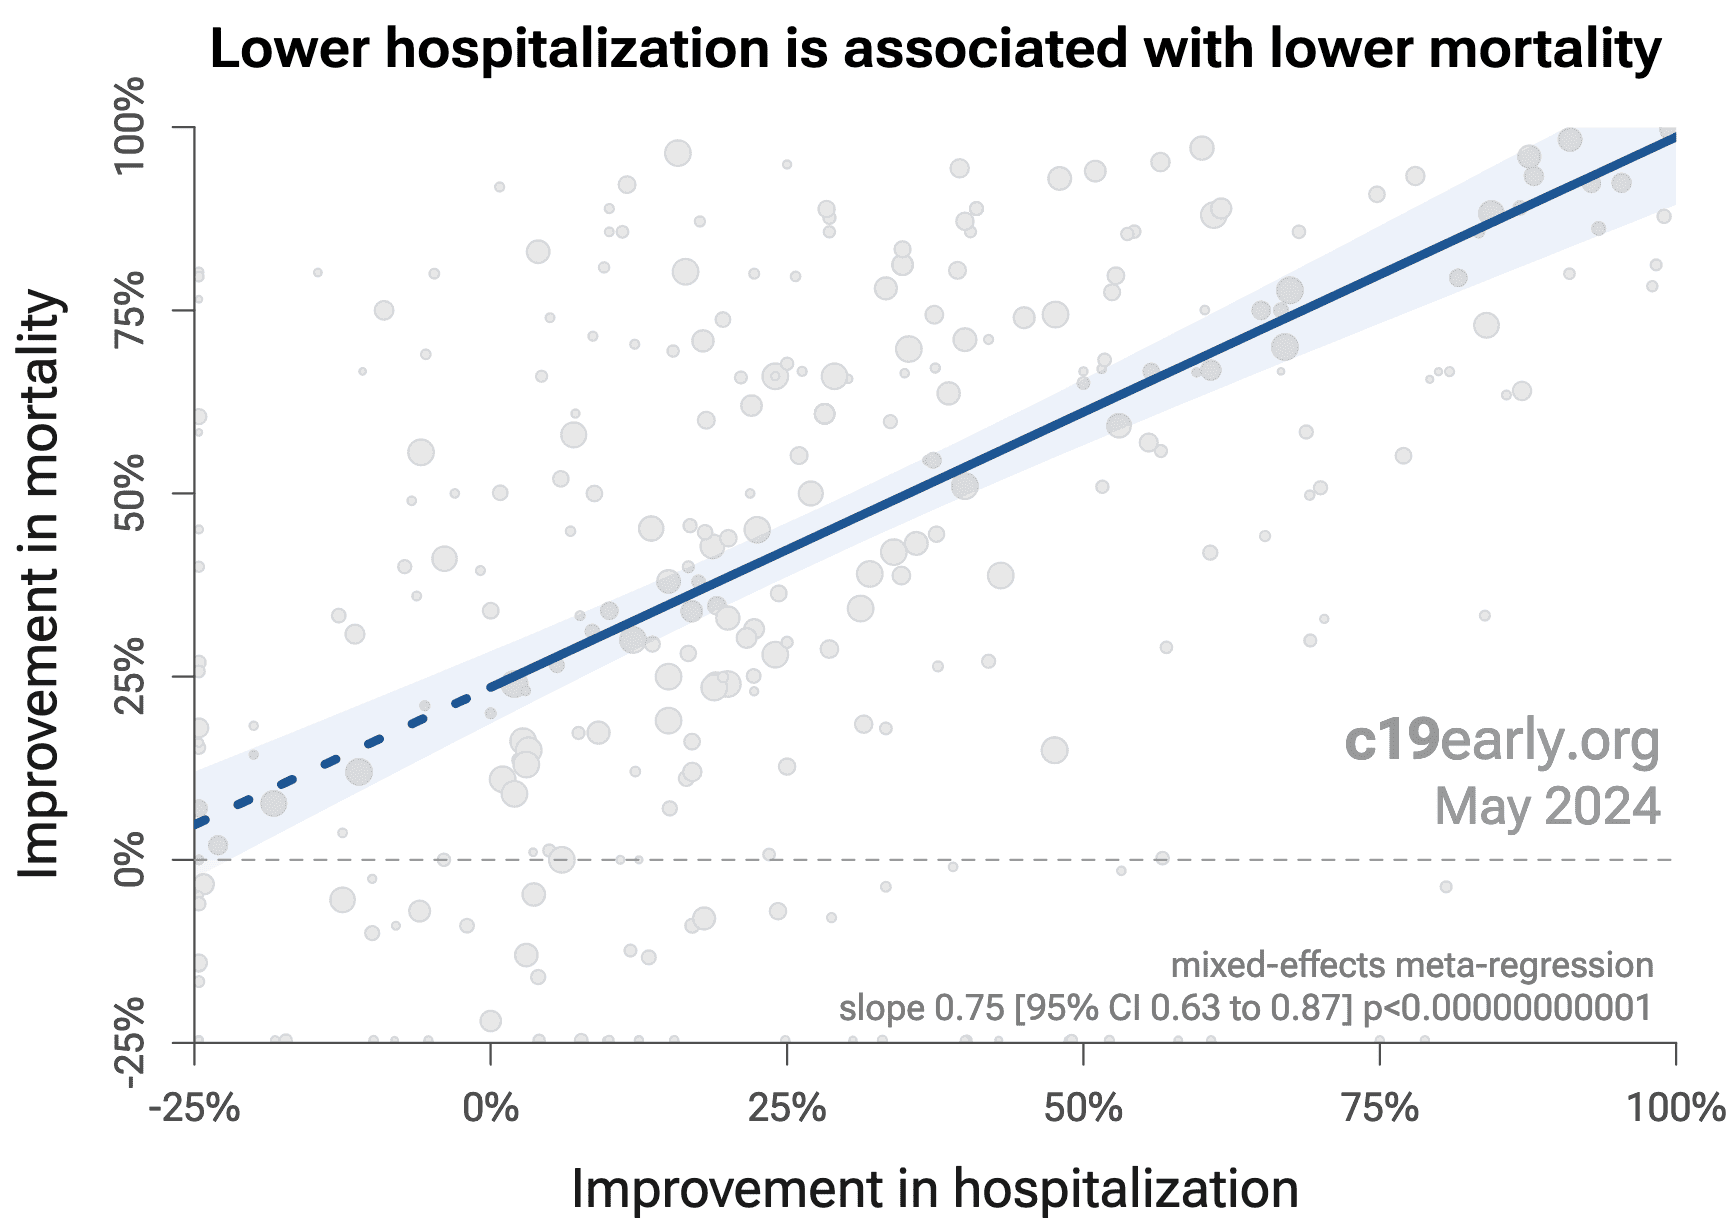
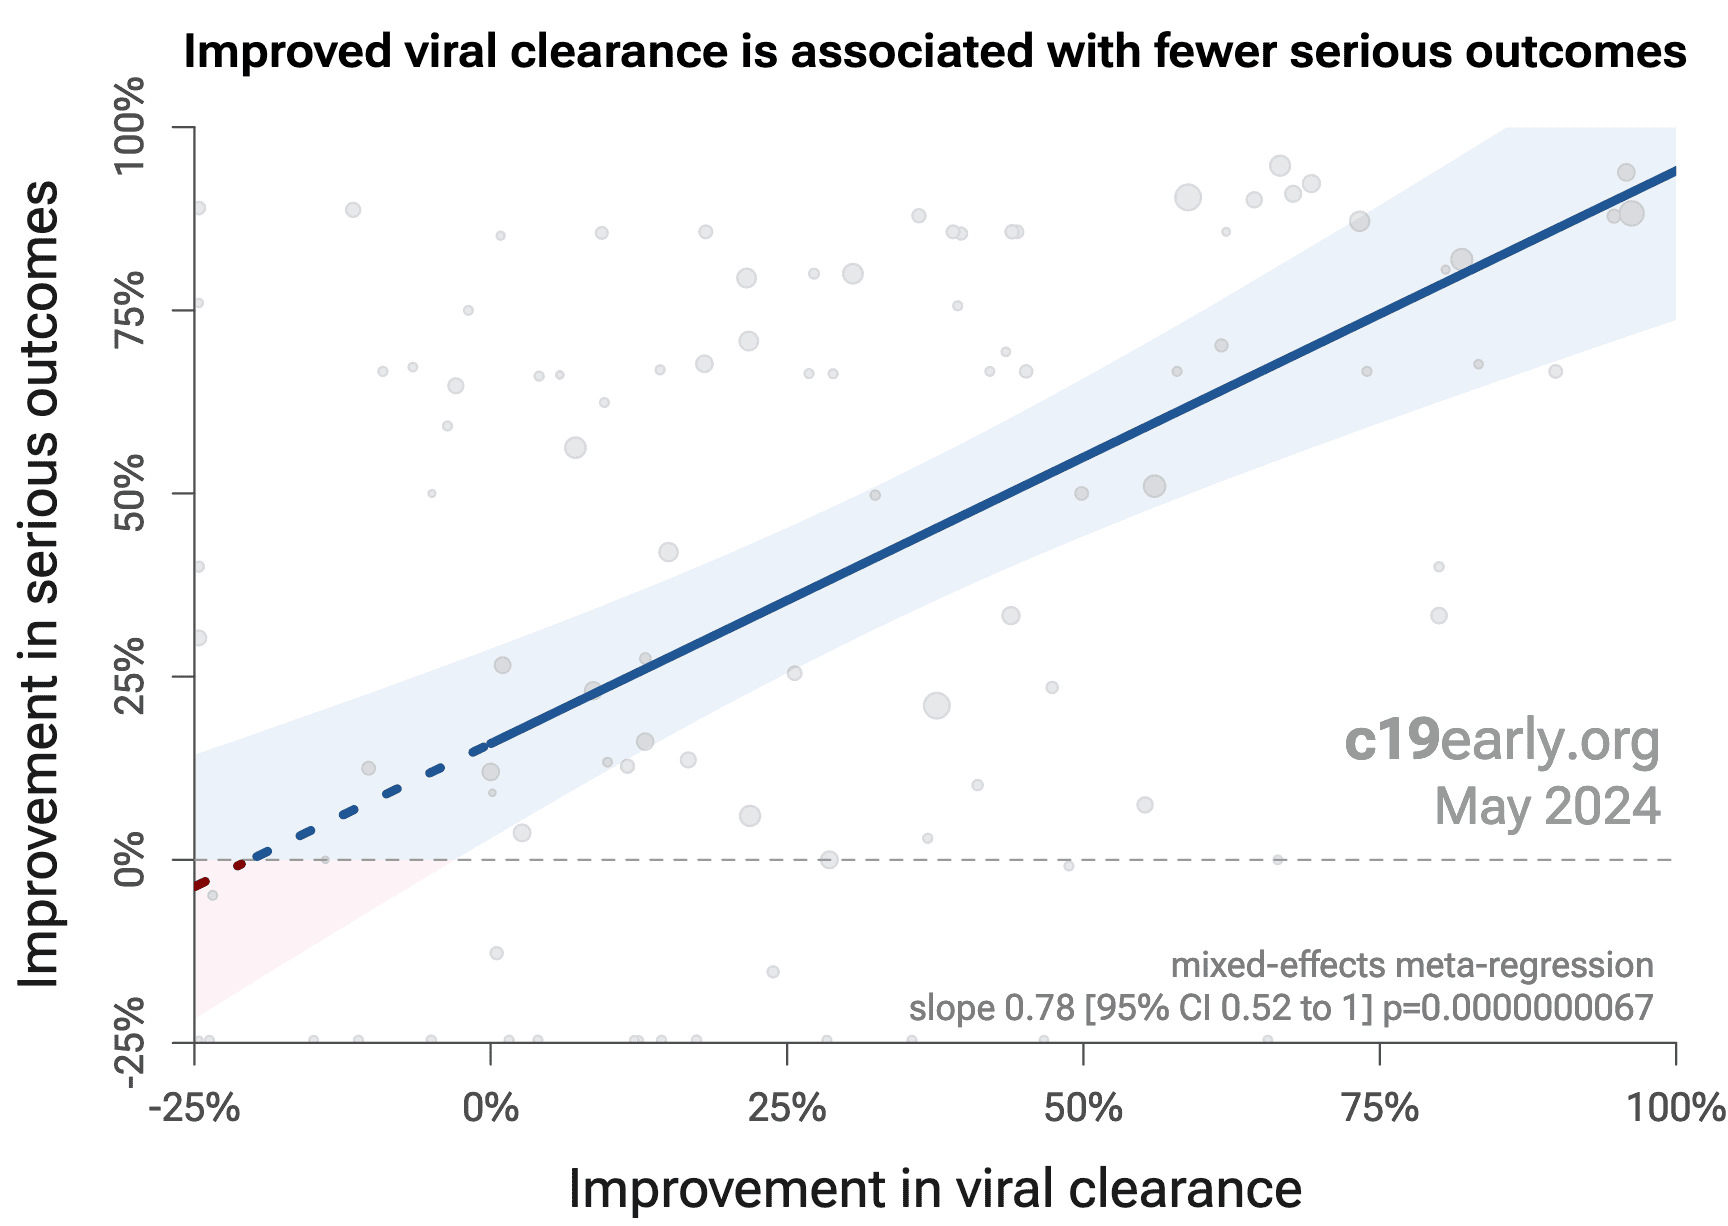
Analysis of the the association between different outcomes across studies from all 226 treatments we cover confirms the validity of pooled outcome analysis for COVID-19. Fig. 25 shows that lower hospitalization is very strongly associated with lower mortality (p < 0.0000000001). Similarly, Fig. 26 shows that improved recovery is very strongly associated with lower mortality (p < 0.0000000001). Considering the extremes, Singh et al. show an association between viral clearance and hospitalization or death, with p = 0.003 after excluding one large outlier from a mutagenic treatment, and based on 44 RCTs including 52,384 patients. Fig. 27 shows that improved viral clearance is strongly associated with fewer serious outcomes. The association is very similar to Singh et al., with higher confidence due to the larger number of studies. As with Singh et al., the confidence increases when excluding the outlier treatment, from p = 0.0000000074 to p = 0.00000000015.
Loading..
Fig. 25. Lower hospitalization is associated with lower mortality, supporting pooled outcome analysis.
Loading..
Fig. 26. Improved recovery is associated with lower mortality, supporting pooled outcome analysis.
Loading..
Fig. 25. Improved viral clearance is associated with fewer serious outcomes, supporting pooled outcome analysis.
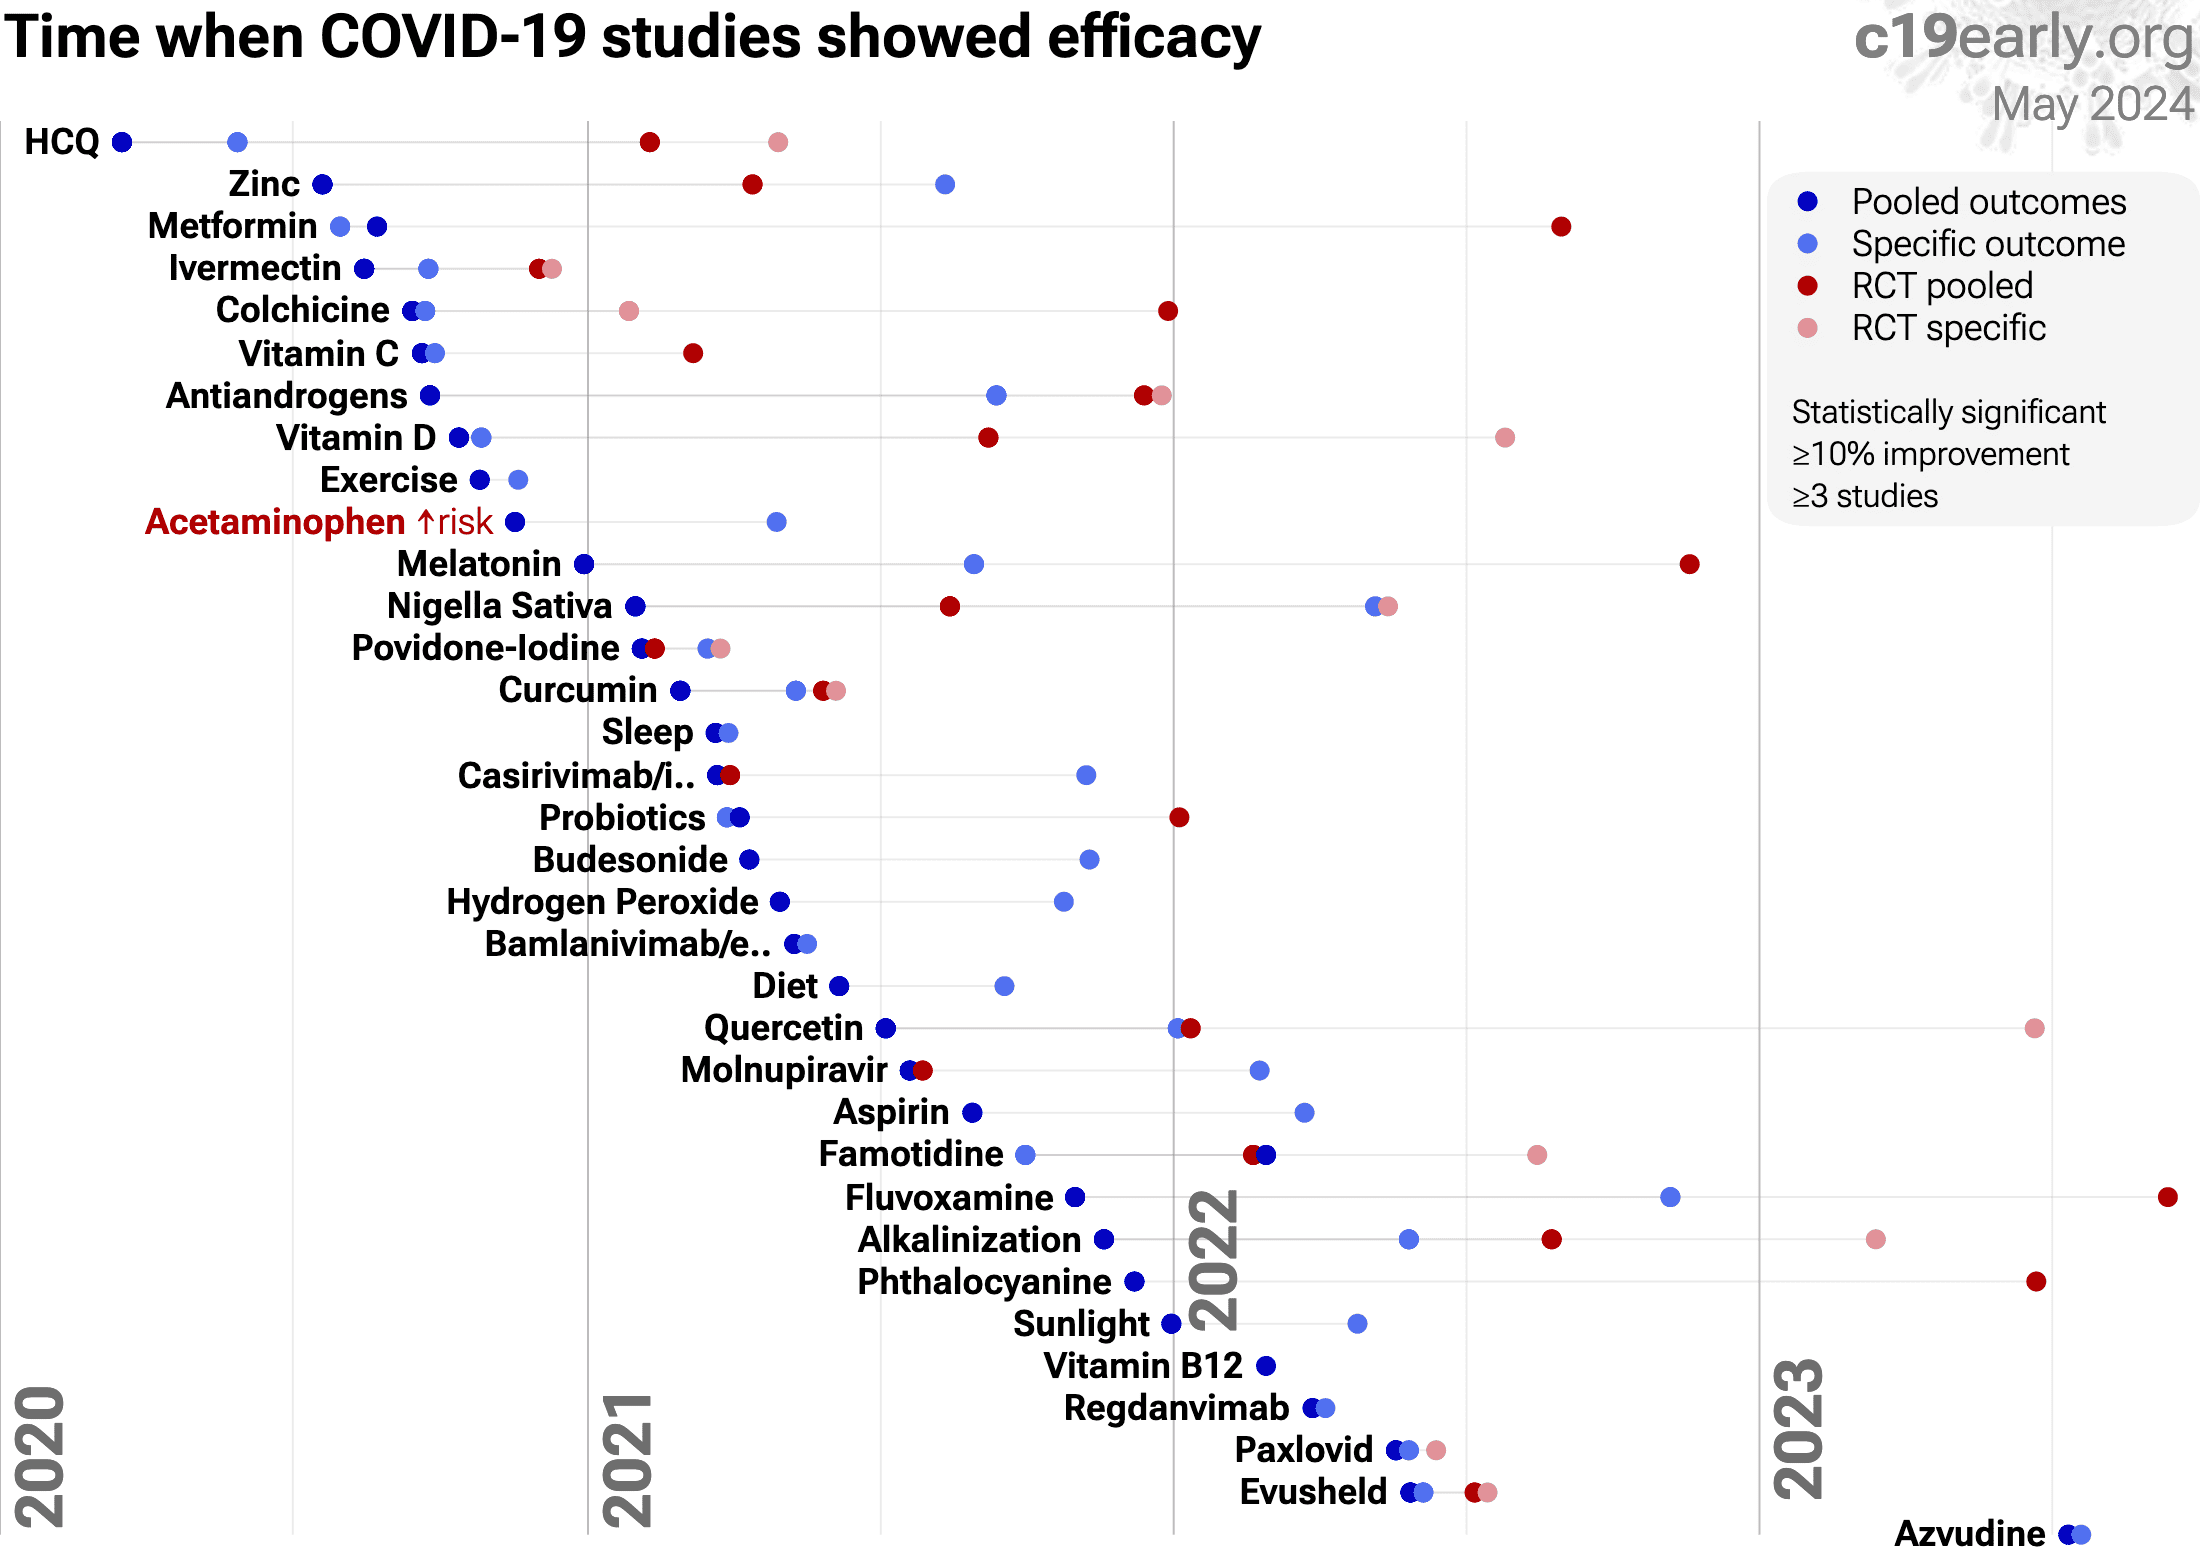
Currently, 59 of the treatments we analyze show statistically significant efficacy or harm, defined as ≥10% decreased risk or >0% increased risk from ≥3 studies. 85% of these have been confirmed with one or more specific outcomes, with a mean delay of 4.6 months. When restricting to RCTs only, 53% of treatments showing statistically significant efficacy/harm with pooled effects have been confirmed with one or more specific outcomes, with a mean delay of 7.5 months. Fig. 28 shows when treatments were found effective during the pandemic. Pooled outcomes often resulted in earlier detection of efficacy.
Loading..
Loading..
Fig. 28. The time when studies showed that treatments were effective, defined as statistically significant improvement of ≥10% from ≥3 studies. Pooled results typically show efficacy earlier than specific outcome results. Results from all studies often shows efficacy much earlier than when restricting to RCTs. Results reflect conditions as used in trials to date, these depend on the population treated, treatment delay, and treatment regimen.
Pooled analysis could hide efficacy, for example a treatment that is beneficial for late stage patients but has no effect on viral clearance may show no efficacy if most studies only examine viral clearance. In practice, it is rare for a non-antiviral treatment to report viral clearance and to not report clinical outcomes; and in practice other sources of heterogeneity such as differences in treatment delay are more likely to hide efficacy.
Analysis validates the use of pooled effects and shows significantly faster detection of efficacy on average. However, as with all meta-analyses, it is important to review the different studies included. We also present individual outcome analyses, which may be more informative for specific use cases.
Publishing is often biased towards positive results, however evidence suggests that there may be a negative bias for inexpensive treatments for COVID-19. Both negative and positive results are very important for COVID-19, media in many countries prioritizes negative results for inexpensive treatments (inverting the typical incentive for scientists that value media recognition), and there are many reports of difficulty publishing positive results114-117.
One method to evaluate bias is to compare prospective vs. retrospective studies. Prospective studies are more likely to be published regardless of the result, while retrospective studies are more likely to exhibit bias. For example, researchers may perform preliminary analysis with minimal effort and the results may influence their decision to continue. Retrospective studies also provide more opportunities for the specifics of data extraction and adjustments to influence results.
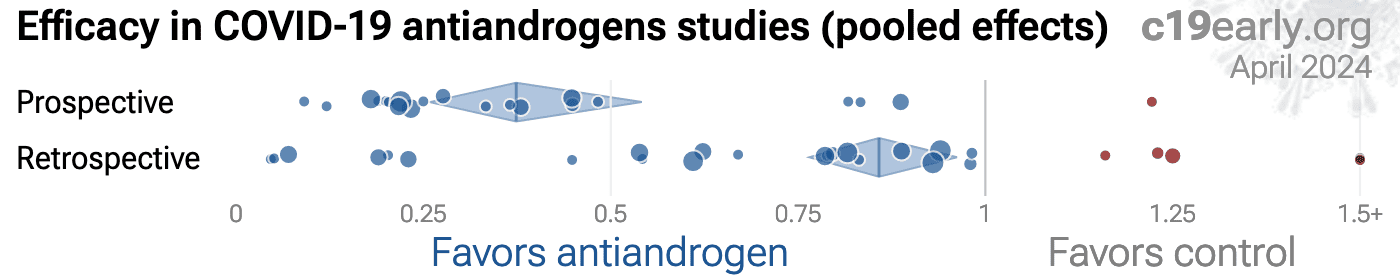
Fig. 29 shows a scatter plot of results for prospective and retrospective studies. 46% of retrospective studies report a statistically significant positive effect for one or more outcomes, compared to 76% of prospective studies, consistent with a bias toward publishing negative results. The median effect size for retrospective studies is 21% improvement, compared to 72% for prospective studies, suggesting a potential bias towards publishing results showing lower efficacy.
Loading..
Fig. 29. Prospective vs. retrospective studies. The diamonds show the results of random-effects meta-analysis.
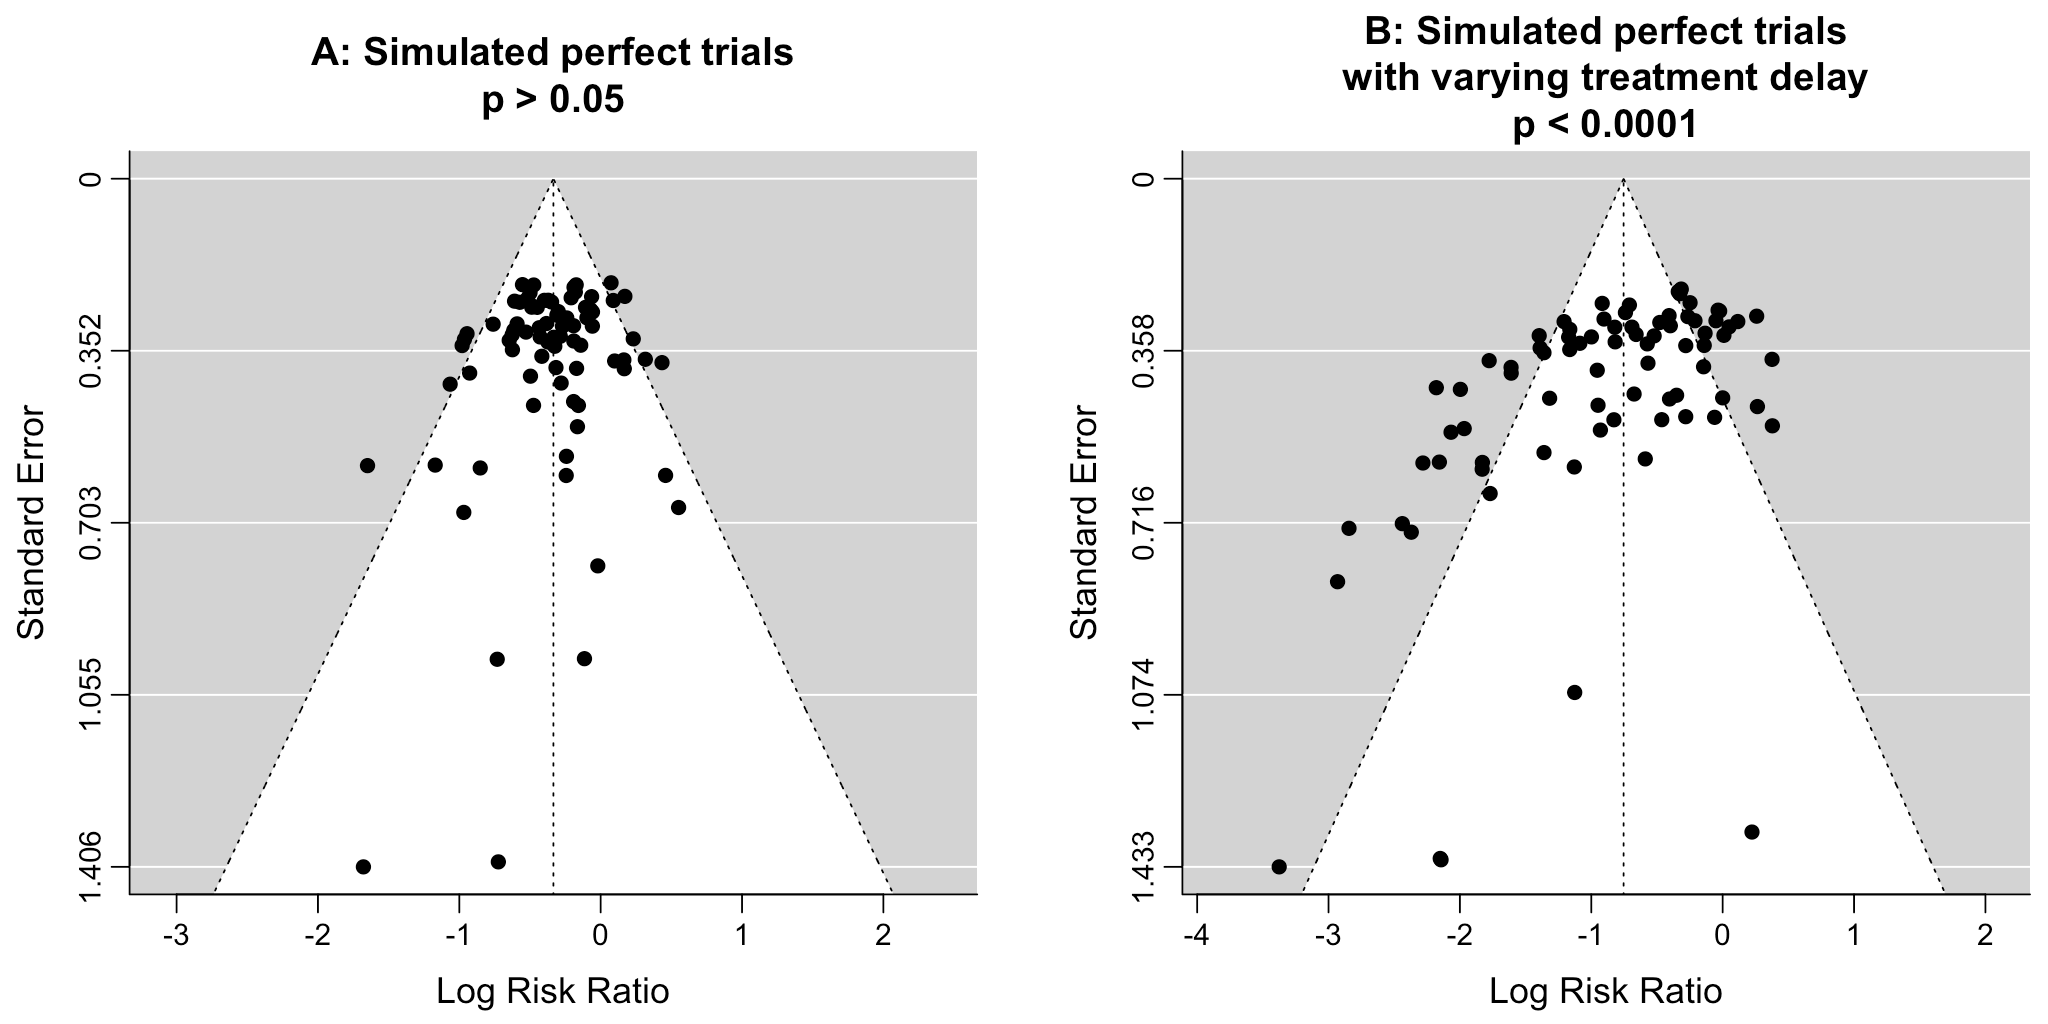
Funnel plots have traditionally been used for analyzing publication bias. This is invalid for COVID-19 acute treatment trials — the underlying assumptions are invalid, which we can demonstrate with a simple example. Consider a set of hypothetical perfect trials with no bias. Fig. 30 plot A shows a funnel plot for a simulation of 80 perfect trials, with random group sizes, and each patient's outcome randomly sampled (10% control event probability, and a 30% effect size for treatment). Analysis shows no asymmetry (p > 0.05). In plot B, we add a single typical variation in COVID-19 treatment trials — treatment delay. Consider that efficacy varies from 90% for treatment within 24 hours, reducing to 10% when treatment is delayed 3 days. In plot B, each trial's treatment delay is randomly selected. Analysis now shows highly significant asymmetry, p < 0.0001, with six variants of Egger's test all showing p < 0.05118-125. Note that these tests fail even though treatment delay is uniformly distributed. In reality treatment delay is more complex — each trial has a different distribution of delays across patients, and the distribution across trials may be biased (e.g., late treatment trials may be more common). Similarly, many other variations in trials may produce asymmetry, including dose, administration, duration of treatment, differences in SOC, comorbidities, age, variants, and bias in design, implementation, analysis, and reporting.
Log Risk Ratio Standard Error 1.406 1.055 0.703 0.352 0 -3 -2 -1 0 1 2 A: Simulated perfect trials p > 0.05 Log Risk Ratio Standard Error 1.433 1.074 0.716 0.358 0 -4 -3 -2 -1 0 1 2 B: Simulated perfect trials with varying treatment delay p < 0.0001
Fig. 30. Example funnel plot analysis for simulated perfect trials.
Summary statistics from meta-analysis necessarily lose information. As with all meta-analyses, studies are heterogeneous, with differences in treatment delay, treatment regimen, patient demographics, variants, conflicts of interest, standard of care, and other factors. We provide analyses for specific outcomes and by treatment delay, and we aim to identify key characteristics in the forest plots and summaries. Results should be viewed in the context of study characteristics.
Some analyses classify treatment based on early or late administration, as done here, while others distinguish between mild, moderate, and severe cases. Viral load does not indicate degree of symptoms — for example patients may have a high viral load while being asymptomatic. With regard to treatments that have antiviral properties, timing of treatment is critical — late administration may be less helpful regardless of severity.
Details of treatment delay per patient is often not available. For example, a study may treat 90% of patients relatively early, but the events driving the outcome may come from 10% of patients treated very late. Our 5 day cutoff for early treatment may be too conservative, 5 days may be too late in many cases.
Comparison across treatments is confounded by differences in the studies performed, for example dose, variants, and conflicts of interest. Trials with conflicts of interest may use designs better suited to the preferred outcome.
In some cases, the most serious outcome has very few events, resulting in lower confidence results being used in pooled analysis, however the method is simpler and more transparent. This is less critical as the number of studies increases. Restriction to outcomes with sufficient power may be beneficial in pooled analysis and improve accuracy when there are few studies, however we maintain our pre-specified method to avoid any retrospective changes.
Studies show that combinations of treatments can be highly synergistic and may result in many times greater efficacy than individual treatments alone88-112. Therefore standard of care may be critical and benefits may diminish or disappear if standard of care does not include certain treatments.
This real-time analysis is constantly updated based on submissions. Accuracy benefits from widespread review and submission of updates and corrections from reviewers. Less popular treatments may receive fewer reviews.
No treatment or intervention is 100% available and effective for all current and future variants. Efficacy may vary significantly with different variants and within different populations. All treatments have potential side effects. Propensity to experience side effects may be predicted in advance by qualified physicians. We do not provide medical advice. Before taking any medication, consult a qualified physician who can compare all options, provide personalized advice, and provide details of risks and benefits based on individual medical history and situations.
1 of the 49 studies compare against other treatments, which may reduce the effect seen. 4 of 49 studies combine treatments. The results of antiandrogens alone may differ. 2 of 17 RCTs use combined treatment. Other meta-analyses show significant improvements with antiandrogens for mortality1,2, hospitalization2, recovery2, and progression1.
Multiple reviews cover antiandrogen for COVID-19, presenting additional background on mechanisms and related results, including126,127.
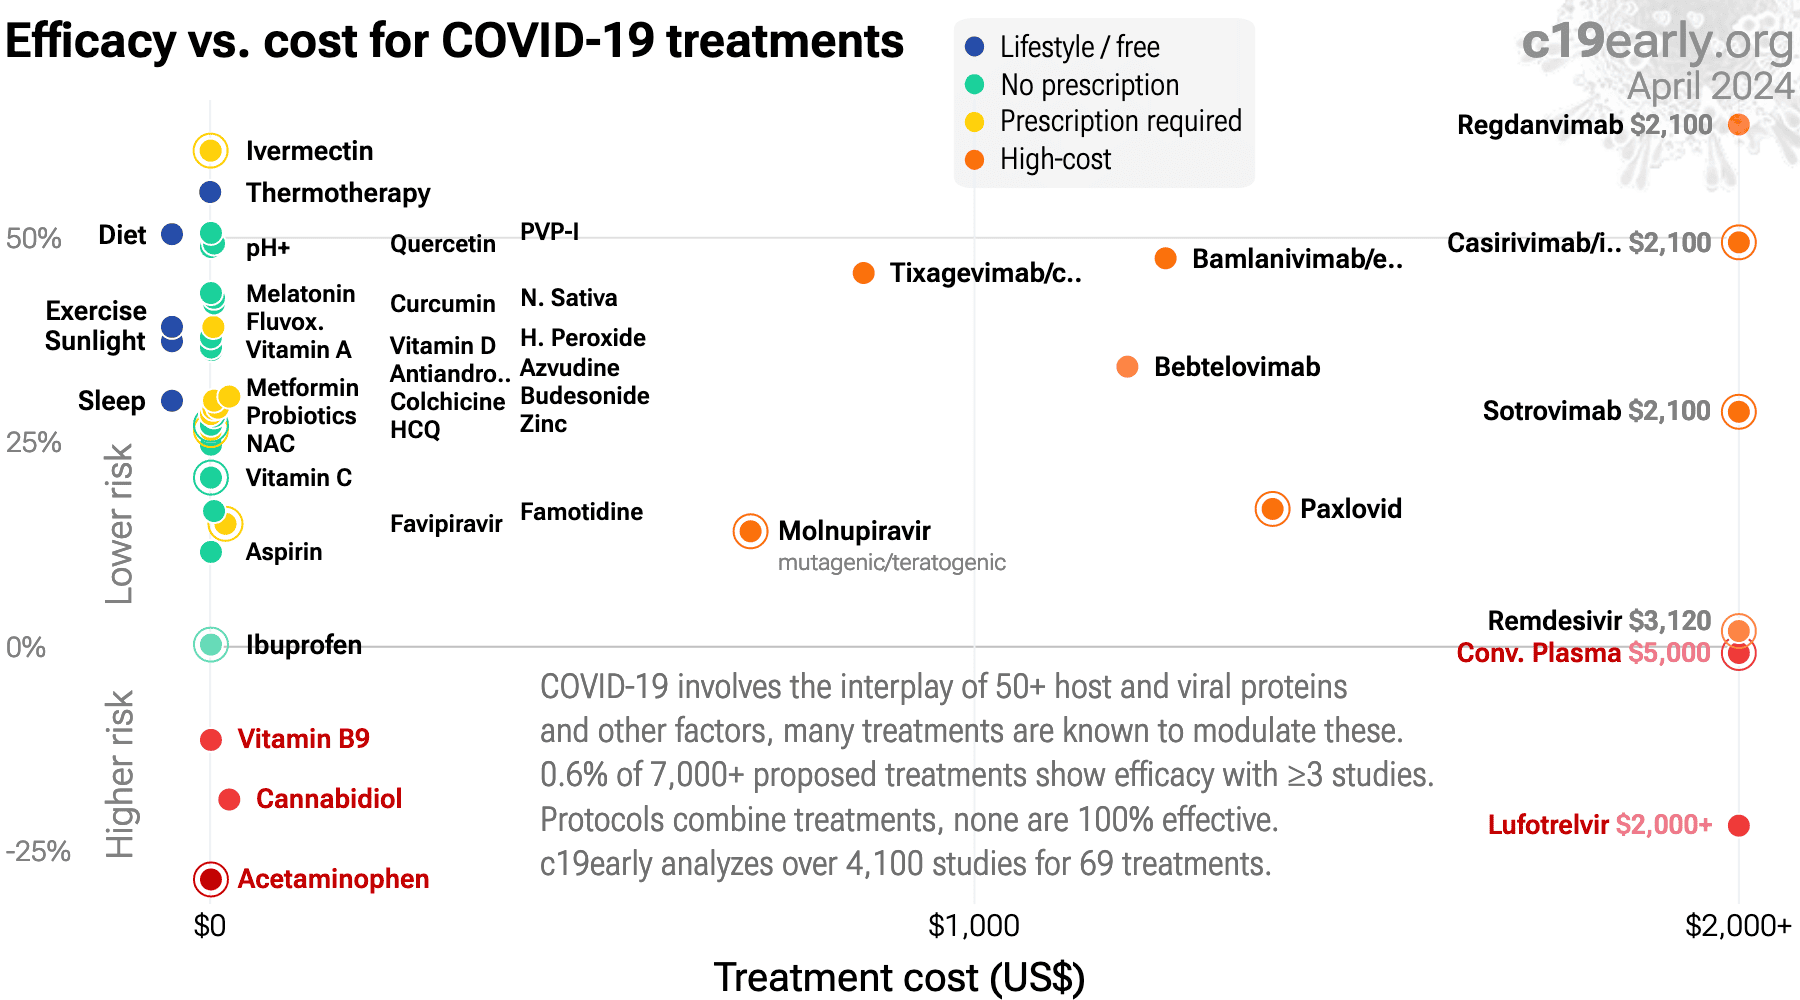
SARS-CoV-2 infection and replication involves a complex interplay of 500+ host and viral proteins and other factors33-40, providing many therapeutic targets. Over 12,000 compounds have been predicted to reduce COVID-19 risk41, either by directly minimizing infection or replication, by supporting immune system function, or by minimizing secondary complications. Fig. 31 shows an overview of the results for antiandrogens in the context of multiple COVID-19 treatments, and Fig. 32 shows a plot of efficacy vs. cost for COVID-19 treatments.
Loading..
Fig. 31. Scatter plot showing results within the context of multiple COVID-19 treatments. Diamonds shows the results of random-effects meta-analysis. 0.5% of 12,000+ proposed treatments show efficacy128.
Loading..
Loading..
Fig. 32. Efficacy vs. cost for COVID-19 treatments.
Antiandrogens are an effective treatment for COVID-19. Significantly lower risk is seen for mortality, ventilation, ICU admission, hospitalization, recovery, cases, and viral clearance. 29 studies from 23 independent teams in 12 countries show significant benefit. Meta-analysis using the most serious outcome reported shows 30% [21‑38%] lower risk. Results are similar for higher quality and peer-reviewed studies and better for Randomized Controlled Trials.
Results are robust—in worst case exclusion sensitivity analysis 23 of 49 studies must be excluded before statistical significance is lost.
This analysis combines the results of several different antiandrogens. Results for individual treatments may vary.
Other meta-analyses show significant improvements with antiandrogens for mortality1,2, hospitalization2, recovery2, and progression1.
 
Contact.
Contact us on X at @CovidAnalysis.
Funding.
We have received no funding or compensation in any form, and do not accept donations. This is entirely volunteer work.
Conflicts of interest.
We have no conflicts of interest. We have no affiliation with any pharmaceutical companies, supplement companies, governments, political parties, or advocacy organizations.
AI.
We use AI models (Gemini, Grok, Claude, and ChatGPT) tasked with functioning as additional peer-reviewers to check for errors, suggest improvements, and review spelling and grammar. Any corrections are manually verified. Our preference for em dashes is independent of AI.
Updates.
Our COVID-19 meta-analyses involve the extraction of over 228,000 datapoints from thousands of papers for 226 treatments. We thank the thousands of scientists, physicians, and other contributors that have provided updates, suggestions, feedback, and corrections. These are all welcome and can be submitted at https://c19early.org/aameta.html.
Dedication.
This work is dedicated to top evidence-based physicians that worked tirelessly to analyze evidence and greatly reduce mortality and morbidity during the pandemic. In alphabetical order: Dr. Thomas J. Borody, Dr. Mary Talley Bowden, Dr. Flavio Cadegiani, Dr. Shankara Chetty, Dr. Ryan Cole, Dr. George Fareed, Dr. Sabine Hazan, Dr. Pierre Kory, Dr. Tess Lawrie, Dr. Robert Malone, Dr. Paul Marik, Dr. Peter McCullough, Dr. Didier Raoult, Dr. Harvey Risch, Dr. Jackie Stone, Dr. Brian Tyson, Dr. Joseph Varon, and Dr. Vladimir Zelenko.
Public domain.
This is a public domain work distributed in accordance with the Creative Commons CC0 1.0 Universal license, which dedicates the work to the public domain by waiving all rights worldwide under copyright law. You can distribute, remix, adapt, and build upon this work in any medium or format, including for commercial purposes, without asking permission. Referenced material and third-party images retain any original copyrights or restrictions. See: https://creativecommons.org/publicdomain/zero/1.0/.
Late treatmentRCT · 138 patients · Iran · Dec 2020 – Apr 2021
Spironolactone for COVID-19
Outcome
Improvement
Relative Risk · 95% CI
Improved recovery with antiandrogens
p = 0.000059
RCT including 51 spironolactone patients and 87 control patients in Iran, showing improved recovery with spironolactone, sitagliptin, and the combination of both. Submit Corrections or Updates.
Late treatmentRCT · 150 patients · multinational · May 2021 – Jan 2022
Sabizabulin for COVID-19
Outcome
Improvement
Relative Risk · 95% CI
Lower mortality and shorter ventilation
p = 0.0022 (mortality) and p = 0.0013 (ventilation)
RCT with 98 hospitalized moderate/severe patients treated with sabizabulin and 52 control patients, showing lower mortality with treatment. Sabizabulin 9mg for up to 21 days. For more discussion see129130131. Submit Corrections or Updates.
ProphylaxisRetrospective · 118 patients · Italy
Antiandrogens for COVID-19
Outcome
Improvement
Relative Risk · 95% CI
Higher ICU admission with antiandrogens
Not statistically significant · p = 0.4
Retrospective 118 prostate cancer patients, 4 on androgren deprivation therapy, not showing significant differences (as expected with only 4 patients in the treatment group). Submit Corrections or Updates.
Early treatmentDouble-blind RCT · 177 patients · Brazil · Jan – Feb 2021
Proxalutamide for COVID-19
Outcome
Improvement
Relative Risk · 95% CI
Lower hospitalization with antiandrogens
p = 0.00083
RCT 177 women in Brazil, 75 treated with proxalutamide, showing significantly lower hospitalization with treatment. Submit Corrections or Updates.
RCT 130 outpatients in Brazil, 54 treated with dutasteride, showing faster recovery with treatment. All patients received nitazoxanide. There were no hospitalizations, mechanical ventilation, or deaths. Some percentages for viral clearance in Table 3 do not match the group sizes, and a third-party analysis suggests possible randomization failure. 34110420.2.0000.0008. Submit Corrections or Updates.
Early treatmentProspective · 270 patients · Brazil
Spironolactone for COVID-19
Outcome
Improvement
Relative Risk · 95% CI
Faster recovery and viral clearance
p = 0.0062 (recovery) and p = 0.015 (viral clearance)
Prospective study of 270 female COVID-19 patients in Brazil, 75 with hyperandrogenism, of which 8 were on spironolactone. Results suggest that HA patients may be at increased risk, and that spironolactone use may reduce the risk compared to both other HA patients and non-HA patients. SOC included other treatments and there was no mortality or hospitalization. Submit Corrections or Updates.
Late treatmentRCT · NCT04728802 · 778 patients · Brazil · Feb – Apr 2021
Proxalutamide for COVID-19
Lower mortality and improved recovery
p < 0.0001 (mortality) and p < 0.0001 (recovery)
RCT 778 hospitalized patients in Brazil, 423 treated with proxalutamide, showing significantly lower mortality and improved recovery with treatment. NCT04728802 and NCT05126628. Authors note that cases in this trial were predominantly the P.1 Gamma variant, for which proxalutamide may be more effective compared to other variants. Submit Corrections or Updates.
ProphylaxisPSM retrospective · 898,303 patients · USA
Spironolactone for COVID-19
Lower mortality and ventilation
p = 0.0038 (mortality) and p < 0.0001 (ventilation)
PSM retrospective 898,303 hospitalized COVID-19 patients in the USA, 16,324 on spironolactone, showing lower mortality and ventilation with spironolactone use. Submit Corrections or Updates.
ProphylaxisPSM retrospective · 64,349 patients · USA
Spironolactone for COVID-19
Outcome
Improvement
Relative Risk · 95% CI
00.511.52+
← Spironolactone
reduces risk
Spironolactone
increases risk →
Lower ventilation and ICU admission
p = 0.006 (ventilation) and p = 0.002 (ICU admission)
PSM retrospective 64,349 COVID-19 patients in the USA, showing spironolactone associated with lower ICU admission.

Authors also present in vitro research showing dose-dependent inhibition in a human lung epithelial cell line. Submit Corrections or Updates.
Late treatmentProspective · 206 patients · Iran · Jul – Sep 2021
Spironolactone for COVID-19
Outcome
Improvement
Relative Risk · 95% CI
Lower hospitalization and progression
p = 0.0008 (hospitalization) and p = 0.0034 (progression)
Prospective study of 206 outpatients in Iran, 103 treated with spironolactone and sitagliptin, showing lower hospitalization and faster recovery with treatment. spironolactone 100mg and sitagliptin 100mg daily. Submit Corrections or Updates.
Retrospective 655 prostate cancer patients in Sweden, showing no significant difference in seropositivity with ADT. Submit Corrections or Updates.
Retrospective 199 prostate cancer patients hospitalized with COVID-19 in Brazil, showing no significant difference in mortality with active ADT. Submit Corrections or Updates.
Retrospective 30 COVID-19 ARDS ICU patients and 30 control patients, showing lower mortality with treatment. Submit Corrections or Updates.
Case control study with 474 patients that died of COVID-19 in Sweden, showing higher risk with ADT, without statistical significance. Submit Corrections or Updates.
Late treatmentRCT · NCT04365127 · 40 patients · USA · Apr – Aug 2020
Antiandrogens for COVID-19
Improved recovery with antiandrogens
p = 0.024
RCT 42 hospitalized patients in the USA, showing improved recovery and lower progression with progesterone treatment. Submit Corrections or Updates.
Late treatmentRCT · NCT04487964 · 50 patients · Egypt · Jun – Nov 2021
Glycyrrhizin for COVID-19
Outcome
Improvement
Relative Risk · 95% CI
Faster recovery with antiandrogens + boswellic acid
p = 0.001
RCT with 50 hospitalized COVID+ patients in Egypt, 25 treated with glycyrrhizin and boswellic acid, showing improved recovery with treatment. Glycyrrhizin 60mg and boswellic acid 200mg bid for 2 weeks. NCT04487964. Submit Corrections or Updates.
Late treatmentDouble-blind RCT · USA
Sabizabulin for COVID-19
Outcome
Improvement
Relative Risk · 95% CI
Lower mortality and shorter ICU admission
p = 0.042 (mortality) and p = 0.026 (ICU admission)
Phase 2 RCT of sabizabulin showing lower mortality with treatment. For more discussion see132. Submit Corrections or Updates.
Late treatmentProspective · NCT04368897 · 77 patients · Brazil
Antiandrogens for COVID-19
Outcome
Improvement
Relative Risk · 95% CI
Lower ICU admission with antiandrogens
Not statistically significant · p = 0.082
Prospective study of 77 men hospitalized with COVID-19, 12 taking antiandrogens (9 dutasteride, 2 finasteride, 1 spironolactone), showing lower ICU admission with treatment (statistically significant with age-matched controls only when excluding the spironolactone patient). NCT04368897. Submit Corrections or Updates.
Retrospective 689 hospitalized COVID-19 patients in Denmark, showing higher risk of ICU/death with spironolactone use in unadjusted results subject to confounding by indication. Submit Corrections or Updates.
Late treatmentProspective · 260 patients · Taiwan · May – Aug 2021
Antiandrogens for COVID-19
Improved viral clearance with treatment
p = 0.00015
Prospective study of 260 hospitalized patients in Taiwan, 117 treated with herbal formula Jing Si Herbal Tea which includes antiandrogen glycyrrhiza glabra, showing improved recovery with treatment, with statistical significance for SpO2, Ct score, CRP, and Brixia score. Submit Corrections or Updates.
Retrospective 26,508 consecutive COVID+ veterans in the USA, showing lower mortality with multiple treatments including anti-androgens. Treatment was defined as drugs administered ≥50% of the time within 2 weeks post-COVID+, and may be a continuation of prophylactic treatment in some cases, and may be early or late treatment in other cases. Further reduction in mortality was seen with combinations of treatments. Submit Corrections or Updates.
ProphylaxisRetrospective · 12,732 patients · Brazil
Antiandrogens for COVID-19
Outcome
Improvement
Relative Risk · 95% CI
unadjusted
00.511.52+
← Antiandrogens
reduce risk
Antiandrogens
increase risk →
Lower ICU admission and hospitalization
Not statistically significant · p = 0.26 (ICU admission) and p = 0.32 (hospitalization)
Retrospective survey of 41,529 participants, including 571 on antiandrogen therapy, showing no significant association between antiandrogen use and COVID-19 incidence, hospitalization, or ICU admission/mechanical ventilation. Submit Corrections or Updates.
Case control study examining medication usage with a healthcare database in Israel, showing lower risk of hospitalization with dutasteride. Submit Corrections or Updates.
Retrospective 6,462 liver cirrhosis patients in South Korea, with 67 COVID+ cases, showing significantly lower cases with spironolactone treatment. Death and ICU results per group are not provided. Submit Corrections or Updates.
ProphylaxisRetrospective · 1,349 patients · Spain
Antiandrogens for COVID-19
Outcome
Improvement
Relative Risk · 95% CI
00.511.52+
← Antiandrogens
reduce risk
Antiandrogens
increase risk →
Lower mortality and more cases
Not statistically significant · p = 0.41 (mortality) and p = 0.15 (more cases)
Retrospective 1,349 prostate cancer patients in Spain, 156 on ADT, showing no significant differences in COVID-19 outcomes with treatment. Submit Corrections or Updates.
ProphylaxisRetrospective · 365 patients · Turkey · Aug 2020 – Jun 2021
Antiandrogens for COVID-19
Outcome
Improvement
Relative Risk · 95% CI
00.511.52+
← Antiandrogens
reduce risk
Antiandrogens
increase risk →
Higher hospitalization and fewer cases
Not statistically significant · p = 0.2 (hospitalization) and p = 0.32 (fewer cases)
Retrospective 365 prostate cancer patients in Turkey, 138 treated with ADT, showing no significant differences with treatment. Submit Corrections or Updates.
Early treatmentRCT · 730 patients · USA · Mar 2021 – Apr 2022
Proxalutamide for COVID-19
Improved viral clearance with antiandrogens
p = 0.0001
RCT 733 outpatients, 99% in the USA, showing lower hospitalization/death, and significantly reduced viral load with proxalutamide treatment. The viral clearance result is from Ma et al. Submit Corrections or Updates.
ProphylaxisRetrospective · 1,779 patients · USA · Mar – Jun 2020
Antiandrogens for COVID-19
Outcome
Improvement
Relative Risk · 95% CI
00.511.52+
← Antiandrogens
reduce risk
Antiandrogens
increase risk →
Higher mortality with antiandrogens
Not statistically significant · p = 0.12
Retrospective 1,779 prostate cancer patients, showing no significant differences in COVID-19 outcomes with ADT. Submit Corrections or Updates.
Retrospective 352 prostate cancer patients in Finland, showing no significant differences in COVID-19 with ADT. Submit Corrections or Updates.
Late treatmentRCT · 49 patients · Poland · Dec 2020 – Aug 2021
Potassium canrenoate for COVID-19
Outcome
Improvement
Relative Risk · 95% CI
Improved recovery with antiandrogens
Not statistically significant · p = 0.51
RCT with 24 patients treated with potassium canrenoate and 25 placebo patients in Poland, showing no significant differences. Submit Corrections or Updates.
Retrospective 5,211 prostate cancer patients, 799 on ADT, showing no significant differences in COVID-19 outcomes with treatment. Submit Corrections or Updates.
Retrospective case-control study in Italy with 943 male COVID-19 patients, 45 on chronic 5ARI treatment (finasteride/dutasteride). There was significantly fewer COVID-19 patients >55 on 5ARI treatment compared to age-matched controls (5.57 vs. 8.14%, p=0.0083). The difference was greater for men aged >65 (7.14 vs. 12.31%, p=0.0001). There was no significant difference for ICU admission or death. Submit Corrections or Updates.
ProphylaxisRetrospective · 39,153 patients · USA · Feb – Jul 2020
Antiandrogens for COVID-19
Outcome
Improvement
Relative Risk · 95% CI
00.511.52+
← Antiandrogens
reduce risk
Antiandrogens
increase risk →
Lower severe cases and fewer cases
p = 0.025 (severe cases) and p = 0.001 (fewer cases)
Retrospective 3,057 androgen deprivation therapy patients in the USA, and 36,096 control patients with cancer, showing lower risk of cases and severity with ADT. Submit Corrections or Updates.
Retrospective 944 5ARI users in the USA and 944 matched controls, showing lower risk of COVID-19 cases with treatment. Submit Corrections or Updates.
Retrospective 26,121 cases and 2,369,020 controls ≥65yo in Canada, showing lower cases with chronic use of spironolactone. Submit Corrections or Updates.
Late treatmentRCT · NCT04424134 · 66 patients · Russia
Spironolactone for COVID-19
Improved recovery and viral clearance
Not statistically significant · p = 0.47 (recovery) and p = 0.077 (viral clearance)
Prospective 103 PCR+ patients in Russia, 33 treated with bromexhine+spironolactone, showing lower PCR+ at day 10 or hospitalization >10 days with treatment. Bromhexine 8mg 4 times daily, spironolactone 25-50 mg/day for 10 days. Submit Corrections or Updates.
Early treatmentRCT · NCT04446429 · 268 patients · Brazil · Jun – Jul 2020
Proxalutamide for COVID-19
Outcome
Improvement
Relative Risk · 95% CI
Lower ventilation and hospitalization
p < 0.0001 (ventilation) and p < 0.0001 (hospitalization)
RCT 268 male patients in Brazil, 134 treated with proxalutamide, showing significantly lower hospitalization and mechanical ventilation.

This paper was retracted, however no specific reason is provided, the editors have ignored the authors, and the "external expert" was reportedly funded by Pfizer. For details see134.

The retraction notice states: "The investigation found that the claims made in the conclusions were not adequately supported by the methodology of the study. In particular, as confirmed by an external expert, the process of allocation to treatment and control was not sufficiently random."

The lack of any detail on what conclusion is not supported and why, or details of any issues in randomization, suggests the paper was censored rather than retracted. Submit Corrections or Updates.
ProphylaxisRetrospective · 42,434 patients · Italy
Antiandrogens for COVID-19
Outcome
Improvement
Relative Risk · 95% CI
00.511.52+
← Antiandrogens
reduce risk
Antiandrogens
increase risk →
Lower severe cases and fewer cases
p = 0.014 (severe cases) and p = 0.0044 (fewer cases)
Retrospective 5,273 prostate cancer patients on androgen-deprivation therapy (ADT), and 37,161 not on ADT, showing lower risk of cases with treatment. Submit Corrections or Updates.
Late treatmentRCT · NCT05172050 · 41 patients · Italy · Oct 2020 – Jun 2021
Raloxifene for COVID-19
Lower need for oxygen therapy and improved viral clearance
Not statistically significant · p = 0.43 (need for oxygen) and p = 0.22 (viral clearance)
RCT 68 patients in Italy showing improved viral clearance with raloxifene. Submit Corrections or Updates.
Late treatmentRCT · NCT04397718 · 96 patients · USA · Jul 2020 – Apr 2021
Degarelix for COVID-19
Trial underpowered for serious outcomes
Early terminated RCT with 62 very late stage (79% on oxygen) degarelix patients and 34 placebo patients, showing no significant differences with treatment.

For discussion of many issues with this study see135. Submit Corrections or Updates.
ProphylaxisRetrospective · 58 patients · USA · Mar – Jun 2020
Antiandrogens for COVID-19
Outcome
Improvement
Relative Risk · 95% CI
Lower hospitalization with antiandrogens
p = 0.02
Retrospective 58 prostate cancer patients in the USA, showing lower risk of hospitalization with ADT. Submit Corrections or Updates.
ProphylaxisPSM retrospective · 477 patients · USA · Mar 2020 – Feb 2021
Antiandrogens for COVID-19
Outcome
Improvement
Relative Risk · 95% CI
00.511.52+
← Antiandrogens
reduce risk
Antiandrogens
increase risk →
Lower mortality with antiandrogens
Not statistically significant · p = 0.41
Retrospective 1,106 prostate cancer patients, showing no significant differences in COVID-19 outcomes with ADT. Submit Corrections or Updates.
ProphylaxisRetrospective · 465 patients · USA · Mar – May 2020
Antiandrogens for COVID-19
Outcome
Improvement
Relative Risk · 95% CI
Higher mortality with antiandrogens
Not statistically significant · p = 0.59
Retrospective 465 prostate cancer patients, showing no significant difference in COVID-19 outcomes with ADT. Submit Corrections or Updates.
PSM retrospective 144 alopecia patients in the USA, showing no significant difference in COVID-19 cases with anti-androgen use. The supplemental appendix is not available. Submit Corrections or Updates.
Late treatmentRetrospective · 69 patients · Italy
Canrenone for COVID-19
Outcome
Improvement
Relative Risk · 95% CI
00.511.52+
← Canrenone
reduces risk
Canrenone
increases risk →
Lower mortality and death/intubation
p < 0.0001 (mortality) and p = 0.002 (death/intubation) Study compares with RAAS inhibitors or vasodilator agents
Retrospective 69 consecutive hospitalized COVID-19 patients in Italy, 30 patients receiving canrenone, and 39 treated with vasodilator agents or renin-angiotensin-aldosterone system (RAAS) inhibitors, showing lower mortality with canrenone. Submit Corrections or Updates.
Late treatmentRCT · 120 patients · India · Feb – Apr 2021
Spironolactone for COVID-19
Outcome
Improvement
Relative Risk · 95% CI
00.511.52+
← Spironolactone
reduces risk
Spironolactone
increases risk →
Lower progression and higher discharge
p = 0.031 (progression) and p = 0.048 (discharge)
RCT 120 hospitalized patients in India, 74 treated with spironolactone and dexamethasone, and 46 with dexamethasone, showing lower progression with treatment. Spironolactone 50mg once daily day 1, 25mg once daily until day 21. Submit Corrections or Updates.
ProphylaxisRetrospective · NCT04475601 · 5,338 patients · Sweden
Antiandrogens for COVID-19
Higher ICU admission and hospitalization
Not statistically significant · p = 0.28 (ICU admission) and p = 0.094 (hospitalization)
Retrospective 7,894 COVID+ prostate cancer patients, analyzing patients on antiandrogen treatment, ADT, and ADT + abiraterone acetate or enzalutamide, showing mixed results and higher mortality for ADT + abiraterone acetate or enzalutamide. This paper also includes a small RCT which is listed separately, and an in vitro HBEC study showing no significant differences (p = 0.084). The supplementary data is not currently available.

For discussion of issues with this study see136137138139. Submit Corrections or Updates.
Late treatmentRCT · 39 patients · Sweden · Jul 2020 – May 2021
Enzalutamide for COVID-19
Outcome
Improvement
Relative Risk · 95% CI
Lower discharge and longer hospitalization
p = 0.032 (discharge) and p = 0.01 (hospitalization)
Very small late stage RCT with 10 control patients and 29 enzalutamide patients, showing mixed results. Discharge and hospitalization time favored the control group, while viral load reduction was better with treatment on days 4&6 (day 4 ΔCt -5.6 p = 0.084), and the only death occurred in the control group. 27% of enzalutamide patients had diabetes compared to 0% of the control group. This paper also includes a retrospective study which is listed separately, and an in vitro HBEC study showing no significant differences (p = 0.084). The supplementary data is not currently available.

For discussion of issues with this study see136137138139. Submit Corrections or Updates.
Late treatmentRCT · 80 patients · Iran
Finasteride for COVID-19
Outcome
Improvement
Relative Risk · 95% CI
00.511.52+
← Finasteride
reduces risk
Finasteride
increases risk →
Lower mortality with antiandrogens
Not statistically significant · p = 0.36
RCT 80 hospitalized COVID-19 patients in Iran, 40 treated with finasteride, showing no significant differences other than improved oxygen saturation on the 5th day with treatment. There was significantly more patients with diabetes in the control group. 5mg finasteride for 7 days. IRCT20200505047318N1. Submit Corrections or Updates.
We perform ongoing searches of PubMed, medRxiv, Europe PMC, ClinicalTrials.gov, The Cochrane Library, Google Scholar, Research Square, ScienceDirect, Oxford University Press, the reference lists of other studies and meta-analyses, and submissions to the site c19early.org, which regularly receives notification of studies upon publication. Search terms are antiandrogen and COVID-19 or SARS-CoV-2. Automated searches are performed twice daily, with all matches reviewed for inclusion. All studies regarding the use of antiandrogen for COVID-19 that report a comparison with a control group are included in the main analysis. Sensitivity analysis is performed, excluding studies with major issues, epidemiological studies, and studies with minimal available information. Studies with major unexplained data issues, for example major outcome data that is impossible to be correct with no response from the authors, are excluded.
Fig. 33. Mid-recovery results can more accurately reflect efficacy when almost all patients recover. Mateja et al. confirm that intermediate viral load results more accurately reflect hospitalization/death.
We extracted effect sizes and associated data from all studies. If studies report multiple kinds of effects then the most serious outcome is used in pooled analysis, while other outcomes are included in the outcome-specific analyses. For example, if effects for mortality and cases are reported then they are both used in specific outcome analyses, while mortality is used for pooled analysis. If symptomatic results are reported at multiple times, we use the latest time, for example if mortality results are provided at 14 days and 28 days, the results at 28 days have preference. Mortality alone is preferred over combined outcomes. Outcomes with zero events in both arms are not used, the next most serious outcome with one or more events is used. For example, in low-risk populations with no mortality, a reduction in mortality with treatment is not possible, however a reduction in hospitalization, for example, is still valuable. Clinical outcomes are considered more important than viral outcomes. When basically all patients recover in both treatment and control groups, preference for viral clearance and recovery is given to results mid-recovery where available. After most or all patients have recovered there is little or no room for an effective treatment to do better, however faster recovery is valuable. An IPD meta-analysis confirms that intermediate viral load reduction is more closely associated with hospitalization/death than later viral load reduction140. If only individual symptom data is available, the most serious symptom has priority, for example difficulty breathing or low SpO2 is more important than cough.
Forest plots are computed using PythonMeta141 with the DerSimonian and Laird random-effects model (the fixed effect assumption is not plausible in this case) and inverse variance weighting. Results are presented with 95% confidence intervals. Heterogeneity among studies was assessed using the I2 statistic. When results provide an odds ratio, we compute the relative risk when possible, or convert to a relative risk according to Zhang et al. Reported confidence intervals and p-values are used when available, and adjusted values are used when provided. If multiple types of adjustments are reported propensity score matching and multivariable regression has preference over propensity score matching or weighting, which has preference over multivariable regression. Adjusted results have preference over unadjusted results for a more serious outcome when the adjustments significantly alter results. When needed, conversion between reported p-values and confidence intervals followed Altman, Altman (B), and Fisher's exact test was used to calculate p-values for event data. If continuity correction for zero values is required, we use the reciprocal of the opposite arm with the sum of the correction factors equal to 1145. Results are expressed with RR < 1.0 favoring treatment, and using the risk of a negative outcome when applicable (for example, the risk of death rather than the risk of survival). If studies only report relative continuous values such as relative times, the ratio of the time for the treatment group versus the time for the control group is used. Calculations are done in Python (3.14.7) with scipy (1.18.1), pythonmeta (1.26), numpy (2.5.3), statsmodels (0.15.0), and plotly (6.9.0). Mixed-effects meta-regression results are computed with R (4.4.0) using the metafor (4.6-0) and rms (6.8-0) packages, and using the most serious sufficiently powered outcome. For all statistical tests, a p-value less than 0.05 was considered statistically significant. Grobid 0.8.2 is used to parse PDF documents.
When evaluating potential effect modification across groups, we use an interaction test as described by Altman (C) et al. We compared the log-transformed relative risks using a z-test, deriving the standard error of the difference from the 95% confidence intervals. A two-sided interaction p-value of < 0.05 was considered a statistically significant difference in treatment effect between the groups.
Cochrane RoB 2/ROBINS-I are often used to evaluate studies, and have the advantage of providing standardized rules that can be applied with minimal understanding of the domain and study. However, the rules do not account for many real-world issues, often overemphasize or underemphasize others, and studies show low inter-rater reliability153. Certain domains are more applicable for these tools, however the time-sensitive nature of a pandemic, with significant mortality for every day of delay in evidence assessment, and the characteristics of COVID-19 make them inappropriate for this domain. This can be demonstrated with examples where expert RoB 2/ROBINS-I ratings do not match reality for COVID-19. Popp et al. use RoB 2 to classify Reis et al. as low risk of bias, however this is the opposite of reality—the trial not only has very high risk of bias, but has very high actual known bias, refusing to release data despite pledging to, reporting multiple impossible numbers, having blinding and randomization failure, and many other issues155. Axfors et al. use RoB 2 to classify Horby et al. as low risk of bias, however this is the opposite of reality—the very late treatment and excessive dosage used produces results with no relevance to recommended usage. HCQ shows poor results with late treatment and excessive dosage, and the combination shows harmD. Hempenius et al. use ROBINS-I to classify 33 studies for HCQ. The two rated as having the lowest risk of bias151,152 are far from the most informative. Both involve very late treatment, providing no information on recommended usage, and ROBINS-I does a very poor job of accounting for the impact of confounding factorsE.
Our quality evaluation focuses on known issues and bias, and the potential impact on outcomes, rather than just the risk of bias. The estimated potential impact of each confounding factor, and the direction of the impact is considered. For example, consider a study that shows significantly lower risk, the value of the study varies significantly if confounding points to an underestimate or an overestimate of efficacy. In one case, the real effect may be null, while the other case provides stronger evidence of efficacy (which may be greater than the study shows). Analysis focusing on the risk of bias, while simpler, may penalize studies for theoretical or technical issues that have no or minimal impact on outcomes. Analysis also depends on the outcome, for example certain issues are less relevant for objective outcomes such as mortality. Inaccurate penalization, and inaccurate high-quality evaluation in the face of known major issues affecting outcomes, increases in significance during a pandemic when immediate recognition of new evidence is critical, and when considering all global studies, as required during a pandemic. Investigators in other countries may have different customs for design, analysis, and reporting, and different English language skills, however they may not be less diligent or have greater bias. Investigators in lower-pharmaceutical-profit countries may have lower bias towards profitable interventions.
We have classified studies as early treatment if most patients are not already at a severe stage at the time of treatment (for example based on oxygen status or lung involvement), and treatment started within 5 days of the onset of symptoms. If studies contain a mix of early treatment and late treatment patients, we consider the treatment time of patients contributing most to the events (for example, consider a study where most patients are treated early but late treatment patients are included, and all mortality events were observed with late treatment patients). We note that a shorter time may be preferable. Antivirals are typically only considered effective when used within a shorter timeframe, for example 0-36 or 0-48 hours for oseltamivir, with longer delays not being effective73,74.
This is a living analysis and is updated regularly. Submit updates or corrections with the form below. We received no funding, this research is done in our spare time. We have no affiliation with any pharmaceutical companies, supplement companies, governments, political parties, or advocacy organizations.
A summary of study results is below. Please submit updates and corrections at the bottom of this page.
A summary of study results is below. Please submit updates and corrections at https://c19early.org/aameta.html.
Effect extraction follows pre-specified rules as detailed above and gives priority to more serious outcomes. For pooled analyses, the first (most serious) outcome is used, which may differ from the effect a paper focuses on. Other outcomes are used in outcome specific analyses.
Cadegiani (C), 7/10/2021, Double Blind Randomized Controlled Trial, Brazil, preprint, 7 authors, study period 4 January, 2021 - 28 February, 2021. risk of death, 63.4% lower, RR 0.37, p = 1.00, treatment 0 of 75 (0.0%), control 1 of 102 (1.0%), NNT 102, relative risk is not 0 because of continuity correction due to zero events (with reciprocal of the contrasting arm).
risk of mechanical ventilation, 89.7% lower, RR 0.10, p = 0.07, treatment 0 of 75 (0.0%), control 5 of 102 (4.9%), NNT 20, relative risk is not 0 because of continuity correction due to zero events (with reciprocal of the contrasting arm).
risk of hospitalization, 85.7% lower, RR 0.14, p < 0.001, treatment 2 of 75 (2.7%), control 19 of 102 (18.6%), NNT 6.3.
Cadegiani, 2/1/2021, Double Blind Randomized Controlled Trial, Brazil, peer-reviewed, 4 authors, excluded in exclusion analyses: potential randomization failure. risk of no recovery, 62.0% lower, RR 0.38, p = 0.009, treatment 7 of 44 (15.9%), control 18 of 43 (41.9%), NNT 3.9.
recovery time, 43.6% lower, relative time 0.56, p < 0.001, treatment 44, control 43, all symptoms.
recovery time, 40.2% lower, relative time 0.60, p < 0.001, treatment 44, control 43, all symptoms except loss of smell or taste.
Cadegiani (B), 10/6/2020, prospective, Brazil, preprint, 4 authors, average treatment delay 3.0 days, excluded in exclusion analyses: significant unadjusted differences between groups. recovery time, 76.7% lower, relative time 0.23, p = 0.006, treatment 8, control 262, excluding anosmia.
recovery time, 82.8% lower, relative time 0.17, p = 0.002, treatment 8, control 262, including anosmia.
time to viral-, 37.9% lower, relative time 0.62, p = 0.02, treatment 8, control 262.
Hunt, 6/29/2022, retrospective, USA, peer-reviewed, 8 authors, study period 1 March, 2020 - 10 September, 2020. risk of death, 39.0% lower, RR 0.61, p < 0.001, treatment 167 of 1,788 (9.3%), control 1,445 of 24,720 (5.8%), adjusted per study, day 30.
Kintor, 4/5/2022, Double Blind Randomized Controlled Trial, placebo-controlled, USA, preprint, 1 author, study period 5 March, 2021 - 1 April, 2022, trial NCT04870606 (history). risk of death, 66.7% lower, RR 0.33, p = 1.00, treatment 0 of 365 (0.0%), control 1 of 365 (0.3%), NNT 365, relative risk is not 0 because of continuity correction due to zero events (with reciprocal of the contrasting arm), 1+ days of treatment, group sizes approximated.
risk of hospitalization, 50.0% lower, RR 0.50, p = 0.38, treatment 4 of 365 (1.1%), control 8 of 365 (2.2%), NNT 91, 1+ days of treatment, group sizes approximated.
risk of death, 66.6% lower, RR 0.33, p = 1.00, treatment 0 of 360 (0.0%), control 1 of 361 (0.3%), NNT 361, relative risk is not 0 because of continuity correction due to zero events (with reciprocal of the contrasting arm), >1 day of treatment, group sizes approximated.
risk of hospitalization, 71.3% lower, RR 0.29, p = 0.18, treatment 2 of 360 (0.6%), control 7 of 361 (1.9%), NNT 72, >1 day of treatment, group sizes approximated.
risk of death, 66.6% lower, RR 0.33, p = 1.00, treatment 0 of 346 (0.0%), control 1 of 347 (0.3%), NNT 347, relative risk is not 0 because of continuity correction due to zero events (with reciprocal of the contrasting arm), >7 days of treatment, group sizes approximated.
risk of hospitalization, 92.3% lower, RR 0.08, p = 0.03, treatment 0 of 346 (0.0%), control 6 of 347 (1.7%), NNT 58, relative risk is not 0 because of continuity correction due to zero events (with reciprocal of the contrasting arm), >7 days of treatment, group sizes approximated.
risk of no viral clearance, 73.9% lower, RR 0.26, p < 0.001, treatment 365, control 365, group sizes approximated, day 7.
McCoy, 12/30/2020, Double Blind Randomized Controlled Trial, Brazil, peer-reviewed, 15 authors, study period 15 June, 2020 - 28 July, 2020, censored, see details, trial NCT04446429 (history). risk of death, 80.0% lower, RR 0.20, p = 0.50, treatment 0 of 134 (0.0%), control 2 of 134 (1.5%), NNT 67, relative risk is not 0 because of continuity correction due to zero events (with reciprocal of the contrasting arm).
risk of mechanical ventilation, 97.1% lower, RR 0.03, p < 0.001, treatment 0 of 134 (0.0%), control 17 of 134 (12.7%), NNT 7.9, relative risk is not 0 because of continuity correction due to zero events (with reciprocal of the contrasting arm).
risk of hospitalization, 91.0% lower, RR 0.09, p < 0.001, treatment 3 of 134 (2.2%), control 35 of 134 (26.1%), NNT 4.2.
Effect extraction follows pre-specified rules as detailed above and gives priority to more serious outcomes. For pooled analyses, the first (most serious) outcome is used, which may differ from the effect a paper focuses on. Other outcomes are used in outcome specific analyses.
Abbasi, 2/7/2022, Single Blind Randomized Controlled Trial, Iran, peer-reviewed, 11 authors, study period December 2020 - April 2021. risk of death, 55.1% lower, RR 0.45, p = 0.10, treatment 5 of 51 (9.8%), control 19 of 87 (21.8%), NNT 8.3, day 5.
risk of mechanical ventilation, 33.7% lower, RR 0.66, p = 0.36, treatment 7 of 51 (13.7%), control 18 of 87 (20.7%), NNT 14, day 5.
risk of ICU admission, 18.8% lower, RR 0.81, p = 0.67, treatment 10 of 51 (19.6%), control 21 of 87 (24.1%), NNT 22, day 5.
risk of no recovery, 47.3% lower, RR 0.53, p < 0.001, treatment mean 1.64 (±0.81) n=51, control mean 3.11 (±2.45) n=87, relative clinical score, day 5.
Barnette, 7/6/2022, Double Blind Randomized Controlled Trial, placebo-controlled, multiple countries, peer-reviewed, 12 authors, study period 18 May, 2021 - 31 January, 2022. risk of death, 55.2% lower, RR 0.45, p = 0.002, treatment 19 of 94 (20.2%), control 23 of 51 (45.1%), NNT 4.0.
ventilation time, 49.5% lower, relative time 0.51, p = 0.001, treatment 98, control 52.
ICU time, 43.5% lower, relative time 0.56, p = 0.001, treatment 98, control 52.
hospitalization time, 26.0% lower, relative time 0.74, p = 0.03, treatment 98, control 52.
Cadegiani (D), 12/25/2021, Double Blind Randomized Controlled Trial, Brazil, peer-reviewed, 15 authors, study period 1 February, 2021 - 15 April, 2021, trial NCT04728802 (history). risk of death, 78.0% lower, RR 0.22, p < 0.001, treatment 45 of 423 (10.6%), control 171 of 355 (48.2%), NNT 2.7, adjusted per study, 28 days, Cox proportional hazards.
risk of death, 79.0% lower, RR 0.21, p < 0.001, treatment 34 of 423 (8.0%), control 138 of 355 (38.9%), NNT 3.2, adjusted per study, 14 days, Cox proportional hazards.
recovery rate, RR 0.55, p < 0.001, treatment 423, control 355, adjusted per study, inverted to make RR<1 favor treatment, 28 days, Cox proportional hazards.
recovery rate, RR 0.45, p < 0.001, treatment 423, control 355, adjusted per study, inverted to make RR<1 favor treatment, 14 days, Cox proportional hazards, primary outcome.
hospitalization time, 33.3% lower, relative time 0.67, p < 0.001, treatment 423, control 355.
Davarpanah, 1/21/2022, prospective, Iran, peer-reviewed, 9 authors, study period July 2021 - September 2021, average treatment delay 5.74 days, this trial uses multiple treatments in the treatment arm (combined with sitagliptin) - results of individual treatments may vary. risk of hospitalization, 78.3% lower, RR 0.22, p < 0.001, treatment 6 of 103 (5.8%), control 23 of 103 (22.3%), NNT 6.1, adjusted per study, odds ratio converted to relative risk, multivariable.
ER visit, 66.7% lower, RR 0.33, p = 0.003, treatment 8 of 103 (7.8%), control 24 of 103 (23.3%), NNT 6.4.
recovery time, 64.4% lower, relative time 0.36, p < 0.001, treatment 103, control 103.
Ersoy, 10/13/2021, retrospective, Turkey, peer-reviewed, 7 authors. risk of death, 46.2% lower, RR 0.54, p = 0.002, treatment 14 of 30 (46.7%), control 26 of 30 (86.7%), NNT 2.5.
Ghandehari, 7/31/2021, Randomized Controlled Trial, USA, peer-reviewed, mean age 55.3, 14 authors, study period April 2020 - August 2020, trial NCT04365127 (history). risk of death, 22.2% higher, RR 1.22, p = 1.00, treatment 1 of 18 (5.6%), control 1 of 22 (4.5%), day 15.
risk of mechanical ventilation, 84.5% lower, RR 0.15, p = 0.24, treatment 0 of 18 (0.0%), control 3 of 22 (13.6%), NNT 7.3, relative risk is not 0 because of continuity correction due to zero events (with reciprocal of the contrasting arm), peak value day 7 and 15.
risk of progression, 75.6% lower, RR 0.24, p = 0.20, treatment 1 of 18 (5.6%), control 5 of 22 (22.7%), NNT 5.8, day 15.
risk of progression, 38.9% lower, RR 0.61, p = 0.48, treatment 3 of 18 (16.7%), control 6 of 22 (27.3%), NNT 9.4, day 7.
Gomaa, 3/1/2022, Double Blind Randomized Controlled Trial, placebo-controlled, Egypt, peer-reviewed, median age 60.0, 5 authors, study period June 2021 - November 2021, average treatment delay 6.0 days, this trial uses multiple treatments in the treatment arm (combined with boswellic acid) - results of individual treatments may vary, trial NCT04487964 (history). risk of death, 90.9% lower, RR 0.09, p = 0.05, treatment 0 of 25 (0.0%), control 5 of 25 (20.0%), NNT 5.0, relative risk is not 0 because of continuity correction due to zero events (with reciprocal of the contrasting arm), day 14.
risk of mechanical ventilation, 90.9% lower, RR 0.09, p = 0.05, treatment 0 of 25 (0.0%), control 5 of 25 (20.0%), NNT 5.0, relative risk is not 0 because of continuity correction due to zero events (with reciprocal of the contrasting arm), day 14.
recovery time, 44.0% lower, relative time 0.56, p < 0.001, treatment 25, control 25.
risk of no recovery, 33.3% lower, RR 0.67, p < 0.001, treatment 25, control 25, relative clinical status, day 14.
Gordon, 4/25/2022, Double Blind Randomized Controlled Trial, placebo-controlled, USA, peer-reviewed, 1 author. risk of death, 82.0% lower, RR 0.18, p = 0.04, ITT.
ventilation time, 76.5% lower, relative time 0.24, p = 0.14.
ICU time, 72.9% lower, relative time 0.27, p = 0.03.
Goren, 9/25/2020, prospective, Brazil, peer-reviewed, 15 authors, trial NCT04368897 (history). risk of ICU admission, 81.0% lower, RR 0.19, p = 0.08, treatment 1 of 12 (8.3%), control 17 of 36 (47.2%), NNT 2.6, adjusted per study, age-matched controls.
risk of ICU admission, 86.0% lower, RR 0.14, p = 0.04, treatment 1 of 12 (8.3%), control 38 of 65 (58.5%), NNT 2.0, adjusted per study, all controls.
risk of death, 50.0% higher, RR 1.50, p = 1.00, treatment 1 of 12 (8.3%), control 2 of 36 (5.6%), age-matched controls.
risk of death, 35.4% higher, RR 1.35, p = 0.58, treatment 1 of 12 (8.3%), control 4 of 65 (6.2%), all controls.
Hsieh, 3/14/2022, prospective, Taiwan, peer-reviewed, 7 authors, study period 1 May, 2021 - 31 August, 2021, this trial uses multiple treatments in the treatment arm (combined with multi-herbal formula) - results of individual treatments may vary. risk of death, 87.9% lower, RR 0.12, p = 0.13, treatment 0 of 117 (0.0%), control 4 of 143 (2.8%), NNT 36, relative risk is not 0 because of continuity correction due to zero events (with reciprocal of the contrasting arm).
risk of mechanical ventilation, 51.1% lower, RR 0.49, p = 0.46, treatment 2 of 117 (1.7%), control 5 of 143 (3.5%), NNT 56.
risk of ICU admission, 30.2% lower, RR 0.70, p = 0.76, treatment 4 of 117 (3.4%), control 7 of 143 (4.9%), NNT 68.
risk of no recovery, 87.9% lower, RR 0.12, p = 0.13, treatment 0 of 117 (0.0%), control 4 of 143 (2.8%), NNT 36, relative risk is not 0 because of continuity correction due to zero events (with reciprocal of the contrasting arm).
relative increase in Ct score, 36.1% better, RR 0.64, p < 0.001, treatment mean 8.14 (±4.9) n=117, control mean 5.2 (±6.99) n=143.
Kotfis, 2/5/2022, Randomized Controlled Trial, placebo-controlled, Poland, peer-reviewed, 10 authors, study period December 2020 - August 2021, trial NCT04912011 (history). risk of death, 16.7% lower, RR 0.83, p = 1.00, treatment 4 of 24 (16.7%), control 5 of 25 (20.0%), NNT 30.
risk of ICU admission, 10.7% lower, RR 0.89, p = 1.00, treatment 6 of 24 (25.0%), control 7 of 25 (28.0%), NNT 33.
relative TFS score, 30.4% better, RR 0.70, p = 0.51, treatment 24, control 25.
Mareev, 12/3/2020, Randomized Controlled Trial, Russia, peer-reviewed, 20 authors, this trial uses multiple treatments in the treatment arm (combined with bromhexine) - results of individual treatments may vary, trial NCT04424134 (history). relative SHOKS-COVID score, 11.3% better, RR 0.89, p = 0.47, treatment mean 2.12 (±1.39) n=33, control mean 2.39 (±1.59) n=33.
risk of PCR+ on day 10 or hospitalization >10 days, 38.8% lower, RR 0.61, p = 0.02, treatment 14 of 24 (58.3%), control 20 of 21 (95.2%), NNT 2.7, odds ratio converted to relative risk.
hospitalization time, 8.2% lower, relative time 0.92, p = 0.35, treatment 33, control 33.
risk of no viral clearance, 87.4% lower, RR 0.13, p = 0.08, treatment 0 of 17 (0.0%), control 3 of 13 (23.1%), NNT 4.3, relative risk is not 0 because of continuity correction due to zero events (with reciprocal of the contrasting arm), day 10.
Nicastri, 6/30/2022, Double Blind Randomized Controlled Trial, placebo-controlled, Italy, peer-reviewed, 17 authors, study period October 2020 - June 2021, trial NCT05172050 (history). risk of oxygen therapy, 51.7% lower, OR 0.48, p = 0.43, treatment 20, control 19, inverted to make OR<1 favor treatment, oxygen supplementation or mechanical ventilation, day 28, 120mg, RR approximated with OR.
risk of oxygen therapy, 6.5% lower, OR 0.93, p = 0.94, treatment 22, control 19, inverted to make OR<1 favor treatment, oxygen supplementation or mechanical ventilation, day 28, 60mg, RR approximated with OR.
risk of oxygen therapy, 4.2% higher, OR 1.04, p = 0.96, treatment 20, control 19, inverted to make OR<1 favor treatment, oxygen supplementation or mechanical ventilation, day 14, 120mg, primary outcome, RR approximated with OR.
risk of oxygen therapy, 39.8% lower, OR 0.60, p = 0.56, treatment 22, control 19, inverted to make OR<1 favor treatment, oxygen supplementation or mechanical ventilation, day 14, 60mg, primary outcome, RR approximated with OR.
risk of no viral clearance, 68.8% lower, OR 0.31, p = 0.22, treatment 20, control 19, inverted to make OR<1 favor treatment, mid-recovery, day 14, 120mg, RR approximated with OR.
risk of no viral clearance, 9.9% lower, OR 0.90, p = 0.91, treatment 22, control 19, inverted to make OR<1 favor treatment, mid-recovery, day 14, 60mg, RR approximated with OR.
Nickols, 4/19/2022, Double Blind Randomized Controlled Trial, placebo-controlled, USA, peer-reviewed, 34 authors, study period 22 July, 2020 - 8 April, 2021, trial NCT04397718 (history) (HITCH). risk of death, 18.3% lower, RR 0.82, p = 0.66, treatment 11 of 62 (17.7%), control 7 of 34 (20.6%), NNT 35, adjusted per study, odds ratio converted to relative risk, multivariable.
risk of mechanical ventilation, 18.8% higher, RR 1.19, p = 0.70, treatment 13 of 62 (21.0%), control 6 of 34 (17.6%).
risk of ongoing hospitalization, mortality, or mechanical ventilation, 16.7% higher, RR 1.17, p = 0.70, treatment 15 of 62 (24.2%), control 7 of 34 (20.6%), adjusted per study, odds ratio converted to relative risk, multivariable, primary outcome.
hospitalization time, 20.0% higher, relative time 1.20, p = 0.94, treatment 62, control 34.
Vicenzi, 9/11/2020, retrospective, Italy, peer-reviewed, 10 authors, this trial compares with another treatment - results may be better when compared to placebo. risk of death, 93.0% lower, HR 0.07, p < 0.001, treatment 30, control 39, adjusted per study, model 2, multivariable.
risk of death/intubation, 81.0% lower, HR 0.19, p = 0.002, treatment 30, control 39, adjusted per study, model 2, multivariable.
Wadhwa, 7/2/2022, Randomized Controlled Trial, placebo-controlled, India, preprint, 18 authors, study period 1 February, 2021 - 30 April, 2021, trial CTRI/2021/03/031721. risk of progression, 72.4% lower, RR 0.28, p = 0.03, treatment 4 of 74 (5.4%), control 9 of 46 (19.6%), NNT 7.1, progression to WHO >4.
risk of no hospital discharge, 49.5% lower, RR 0.51, p = 0.048, treatment 13 of 74 (17.6%), control 16 of 46 (34.8%), NNT 5.8.
recovery time, 18.2% lower, relative time 0.82, p = 0.06, treatment 74, control 46.
Welén, 12/14/2021, Randomized Controlled Trial, Sweden, peer-reviewed, 27 authors, study period 15 July, 2020 - 29 May, 2021, average treatment delay 9.5 days, trial NCT04475601 (history). risk of death, 79.6% lower, RR 0.20, p = 0.26, treatment 0 of 29 (0.0%), control 1 of 10 (10.0%), NNT 10.0, relative risk is not 0 because of continuity correction due to zero events (with reciprocal of the contrasting arm).
risk of mechanical ventilation, 31.0% lower, RR 0.69, p = 1.00, treatment 2 of 29 (6.9%), control 1 of 10 (10.0%), NNT 32.
risk of no hospital discharge, 132.6% higher, RR 2.33, p = 0.03, treatment 29, control 10, inverted to make RR<1 favor treatment, primary outcome.
hospitalization time, 50.0% higher, relative time 1.50, p = 0.01, treatment 29, control 10.
Zarehoseinzade, 4/30/2021, Randomized Controlled Trial, Iran, peer-reviewed, 5 authors. risk of death, 75.0% lower, RR 0.25, p = 0.36, treatment 1 of 40 (2.5%), control 4 of 40 (10.0%), NNT 13.
risk of ICU admission, no change, RR 1.00, p = 1.00, treatment 1 of 40 (2.5%), control 1 of 40 (2.5%).
Effect extraction follows pre-specified rules as detailed above and gives priority to more serious outcomes. For pooled analyses, the first (most serious) outcome is used, which may differ from the effect a paper focuses on. Other outcomes are used in outcome specific analyses.
Bennani, 8/17/2020, retrospective, Italy, peer-reviewed, 2 authors. risk of death, 94.9% lower, RR 0.05, p = 1.00, treatment 0 of 4 (0.0%), control 18 of 114 (15.8%), NNT 6.3, relative risk is not 0 because of continuity correction due to zero events (with reciprocal of the contrasting arm).
risk of ICU admission, 119.2% higher, RR 2.19, p = 0.40, treatment 1 of 4 (25.0%), control 13 of 114 (11.4%).
risk of hospitalization, 25.0% lower, RR 0.75, p = 0.60, treatment 2 of 4 (50.0%), control 76 of 114 (66.7%), NNT 6.0.
risk of severe case, 8.1% lower, RR 0.92, p = 1.00, treatment 1 of 4 (25.0%), control 31 of 114 (27.2%), NNT 46.
Cousins, 3/2/2023, retrospective, propensity score matching, USA, peer-reviewed, 2 authors. risk of death, 18.4% lower, RR 0.82, p = 0.004, treatment 390 of 12,504 (3.1%), control 479 of 12,504 (3.8%), NNT 140, odds ratio converted to relative risk, 90 day exposure window, propensity score matching.
risk of death, 11.6% lower, RR 0.88, p = 0.04, treatment 521 of 16,324 (3.2%), control 592 of 16,324 (3.6%), NNT 230, odds ratio converted to relative risk, 180 day exposure window, propensity score matching, primary outcome.
risk of death, 14.5% lower, RR 0.85, p = 0.003, treatment 671 of 20,690 (3.2%), control 783 of 20,690 (3.8%), NNT 185, odds ratio converted to relative risk, 360 day exposure window, propensity score matching.
risk of mechanical ventilation, 16.7% lower, RR 0.83, p < 0.001, treatment 936 of 12,504 (7.5%), control 1,118 of 12,504 (8.9%), NNT 69, odds ratio converted to relative risk, 90 day exposure window, propensity score matching.
risk of mechanical ventilation, 16.7% lower, RR 0.83, p < 0.001, treatment 1,212 of 16,324 (7.4%), control 1,459 of 16,324 (8.9%), NNT 66, odds ratio converted to relative risk, 180 day exposure window, propensity score matching, primary outcome.
risk of mechanical ventilation, 10.2% lower, RR 0.90, p < 0.001, treatment 1,524 of 20,690 (7.4%), control 1,701 of 20,690 (8.2%), NNT 117, odds ratio converted to relative risk, 360 day exposure window, propensity score matching.
Cousins (B), 7/6/2022, retrospective, propensity score matching, USA, peer-reviewed, 10 authors. risk of mechanical ventilation, 81.0% lower, OR 0.19, p = 0.006, treatment 731, control 731, propensity score matching, RR approximated with OR.
risk of ICU admission, 66.0% lower, OR 0.34, p = 0.002, treatment 731, control 731, propensity score matching, RR approximated with OR.
Davidsson, 1/19/2023, retrospective, Sweden, peer-reviewed, 10 authors. risk of IgG positive, 1.8% lower, RR 0.98, p = 0.95, treatment 30 of 224 (13.4%), control 45 of 431 (10.4%), adjusted per study, odds ratio converted to relative risk, multivariable.
Duarte, 11/25/2021, retrospective, Brazil, peer-reviewed, 4 authors. risk of death, 11.2% lower, RR 0.89, p = 0.37, treatment 100 of 156 (64.1%), control 32 of 43 (74.4%), NNT 9.7, adjusted per study, odds ratio converted to relative risk.
Gedeborg, 12/23/2021, retrospective, Sweden, peer-reviewed, 6 authors. risk of death, 25.0% higher, OR 1.25, p = 0.11, treatment 271 of 474 (57.2%) cases, 5,181 of 23,700 (21.9%) controls, case control OR.
Holt, 5/7/2020, retrospective, Denmark, peer-reviewed, median age 70.0, 4 authors, study period 1 March, 2020 - 1 April, 2020, excluded in exclusion analyses: unadjusted results with no group details. risk of death/ICU, 129.5% higher, RR 2.29, p < 0.001, treatment 16 of 31 (51.6%), control 148 of 658 (22.5%).
Ianhez, 9/3/2020, retrospective, Brazil, peer-reviewed, 4 authors. risk of ICU admission, 79.7% lower, RR 0.20, p = 0.26, treatment 1 of 17 (5.9%), control 28 of 357 (7.8%), adjusted per study, odds ratio converted to relative risk, multivariable.
risk of hospitalization, 65.7% lower, RR 0.34, p = 0.32, treatment 2 of 17 (11.8%), control 64 of 357 (17.9%), adjusted per study, odds ratio converted to relative risk, multivariable.
risk of case, 1.4% higher, RR 1.01, p = 0.90, treatment 17 of 571 (3.0%), control 357 of 12,161 (2.9%), unadjusted, total count not provided, estimated from percentage.
Israel, 7/27/2021, retrospective, Israel, peer-reviewed, 10 authors. risk of hospitalization, 37.7% lower, OR 0.62, p = 0.01, treatment 30 of 6,530 (0.5%) cases, 240 of 32,650 (0.7%) controls, NNT 18, case control OR.
Jeon, 2/23/2021, retrospective, South Korea, peer-reviewed, 3 authors. risk of case, 77.0% lower, OR 0.23, p = 0.005, treatment 6 of 49 (12.2%) cases, 89 of 245 (36.3%) controls, NNT 6.5, case control OR, model 2, within 3 months.
Jiménez-Alcaide, 9/13/2021, retrospective, Spain, peer-reviewed, 9 authors. risk of death, 33.0% lower, RR 0.67, p = 0.41, treatment 3 of 11 (27.3%), control 17 of 50 (34.0%), adjusted per study, multivariable.
risk of progression, 8.0% higher, RR 1.08, p = 0.77, treatment 11, control 50, adjusted per study, multivariable.
risk of case, 68.2% higher, RR 1.68, p = 0.15, treatment 11 of 156 (7.1%), control 50 of 1,193 (4.2%), excluded in exclusion analyses: excessive unadjusted differences between groups.
Kazan, 11/1/2021, retrospective, Turkey, peer-reviewed, 10 authors, study period August 2020 - June 2021, excluded in exclusion analyses: excessive unadjusted differences between groups. risk of hospitalization, 229.0% higher, RR 3.29, p = 0.20, treatment 4 of 138 (2.9%), control 2 of 227 (0.9%).
risk of case, 28.7% lower, RR 0.71, p = 0.32, treatment 13 of 138 (9.4%), control 30 of 227 (13.2%), NNT 26.
Klein, 2/1/2021, retrospective, USA, peer-reviewed, 7 authors, study period 12 March, 2020 - 10 June, 2020. risk of death, 123.9% higher, RR 2.24, p = 0.12, treatment 6 of 304 (2.0%), control 13 of 1,475 (0.9%).
risk of case, 6.6% lower, RR 0.93, p = 0.80, treatment 17 of 304 (5.6%), control 85 of 1,475 (5.8%), NNT 586, adjusted per study, odds ratio converted to relative risk, multivariable.
Koskinen, 6/29/2020, retrospective, Finland, peer-reviewed, 7 authors. risk of death, 45.8% lower, RR 0.54, p = 1.00, treatment 1 of 134 (0.7%), control 3 of 218 (1.4%), NNT 159.
risk of death/ICU, 45.8% lower, RR 0.54, p = 1.00, treatment 1 of 134 (0.7%), control 3 of 218 (1.4%), NNT 159.
risk of case, 11.3% lower, RR 0.89, p = 1.00, treatment 6 of 134 (4.5%), control 11 of 218 (5.0%), NNT 176.
Kwon, 1/29/2021, retrospective, USA, peer-reviewed, 7 authors. risk of death, 21.1% lower, RR 0.79, p = 1.00, treatment 1 of 799 (0.1%), control 7 of 4,412 (0.2%), NNT 2985.
risk of case, 17.6% higher, RR 1.18, p = 0.54, treatment 18 of 799 (2.3%), control 79 of 4,412 (1.8%), adjusted per study, odds ratio converted to relative risk, multivariable.
Lazzeri, 9/21/2020, retrospective, Italy, preprint, 11 authors. risk of death/ICU, 23.0% higher, OR 1.23, p = 0.33, multivariable, RR approximated with OR.
Lee (B), 3/7/2022, retrospective, USA, peer-reviewed, 14 authors, study period 15 February, 2020 - 15 July, 2020. risk of severe case, 21.4% lower, RR 0.79, p = 0.03, treatment 76 of 295 (25.8%), control 727 of 2,427 (30.0%), NNT 24, adjusted per study, odds ratio converted to relative risk, propensity score weighting, multivariable.
risk of case, 11.3% lower, RR 0.89, p < 0.001, treatment 295 of 3,057 (9.6%), control 2,427 of 36,096 (6.7%), adjusted per study, odds ratio converted to relative risk, propensity score weighting, multivariable.
Lyon, 1/31/2022, retrospective, USA, peer-reviewed, 8 authors, study period 8 March, 2020 - 15 February, 2021. risk of death, 16.9% lower, RR 0.83, p = 0.61, treatment 15 of 944 (1.6%), control 19 of 994 (1.9%), NNT 310.
risk of case, 7.2% lower, RR 0.93, p = 0.04, treatment 399 of 944 (42.3%), control 446 of 994 (44.9%), NNT 38, adjusted per study, odds ratio converted to relative risk, multivariable.
MacFadden, 3/29/2022, retrospective, Canada, peer-reviewed, 9 authors, study period 15 January, 2020 - 31 December, 2020. risk of case, 7.0% lower, OR 0.93, p = 0.008, RR approximated with OR.
Montopoli, 5/6/2020, retrospective, Italy, peer-reviewed, 12 authors. risk of death, 95.4% lower, RR 0.05, p = 0.15, treatment 0 of 5,273 (0.0%), control 18 of 37,161 (0.0%), NNT 2064, relative risk is not 0 because of continuity correction due to zero events (with reciprocal of the contrasting arm).
risk of severe case, 74.5% lower, RR 0.25, p = 0.01, treatment 1 of 5,273 (0.0%), control 31 of 37,161 (0.1%), NNT 1551, inverted to make RR<1 favor treatment, odds ratio converted to relative risk.
risk of case, 75.3% lower, RR 0.25, p = 0.004, treatment 4 of 5,273 (0.1%), control 114 of 37,161 (0.3%), NNT 433, inverted to make RR<1 favor treatment, odds ratio converted to relative risk.
Patel, 7/9/2020, retrospective, USA, peer-reviewed, 7 authors, study period 1 March, 2020 - 4 June, 2020. risk of death, 55.2% lower, RR 0.45, p = 0.22, treatment 4 of 22 (18.2%), control 10 of 36 (27.8%), adjusted per study, odds ratio converted to relative risk, multivariable.
risk of mechanical ventilation, 69.0% lower, OR 0.31, p = 0.19, treatment 22, control 36, adjusted per study, multivariable, RR approximated with OR.
risk of hospitalization, 77.0% lower, OR 0.23, p = 0.02, treatment 22, control 36, adjusted per study, multivariable, RR approximated with OR.
Schmidt, 11/12/2021, retrospective, USA, peer-reviewed, 42 authors, study period 17 March, 2020 - 11 February, 2021. risk of death, 20.4% lower, RR 0.80, p = 0.41, treatment 25 of 169 (14.8%), control 44 of 308 (14.3%), adjusted per study, odds ratio converted to relative risk, propensity score matching, multivariable.
risk of severe case, 2.0% lower, OR 0.98, p = 0.94, treatment 169, control 308, adjusted per study, propensity score matching, multivariable, RR approximated with OR.
Shah, 5/12/2022, retrospective, USA, peer-reviewed, median age 71.0, 22 authors, study period 1 March, 2020 - 31 May, 2020. risk of death, 16.0% higher, HR 1.16, p = 0.59, treatment 148, control 317.
risk of mechanical ventilation, 19.0% lower, HR 0.81, p = 0.73, treatment 148, control 317.
risk of severe case, 3.0% higher, HR 1.03, p = 0.91, treatment 148, control 317.
risk of hospitalization, 4.0% lower, HR 0.96, p = 0.90, treatment 148, control 317.
Shaw, 7/1/2021, retrospective, USA, peer-reviewed, 10 authors, study period 1 March, 2020 - 15 May, 2020. risk of case, 6.0% lower, OR 0.94, p = 0.006, treatment 47, control 97, adjusted per study, propensity score matching, multivariable, RR approximated with OR.
Welén (B), 12/14/2021, retrospective, Sweden, peer-reviewed, 27 authors, trial NCT04475601 (history). risk of death, 2.0% lower, HR 0.98, p = 0.94, treatment 21 of 358 (5.9%), control 167 of 4,980 (3.4%), adjusted per study, antiandrogen treatment.
risk of death, 11.0% lower, HR 0.89, p = 0.66, treatment 20 of 334 (6.0%), control 167 of 4,980 (3.4%), adjusted per study, ADT.
risk of death, 151.0% higher, HR 2.51, p < 0.001, treatment 24 of 152 (15.8%), control 167 of 4,980 (3.4%), adjusted per study, ADT and abiraterone acetate or enzalutamide.
risk of ICU admission, 28.0% higher, HR 1.28, p = 0.28, treatment 24 of 358 (6.7%), control 216 of 4,980 (4.3%), adjusted per study, antiandrogen treatment.
risk of ICU admission, 13.0% lower, HR 0.87, p = 0.62, treatment 16 of 334 (4.8%), control 216 of 4,980 (4.3%), adjusted per study, ADT.
risk of ICU admission, 21.0% lower, HR 0.79, p = 0.60, treatment 6 of 152 (3.9%), control 216 of 4,980 (4.3%), adjusted per study, ADT and abiraterone acetate or enzalutamide.
risk of hospitalization, 23.0% higher, HR 1.23, p = 0.09, treatment 126 of 358 (35.2%), control 1,108 of 4,980 (22.2%), adjusted per study, antiandrogen treatment.
risk of hospitalization, 24.0% higher, HR 1.24, p = 0.09, treatment 126 of 334 (37.7%), control 1,108 of 4,980 (22.2%), adjusted per study, ADT.
risk of hospitalization, 40.0% higher, HR 1.40, p = 0.06, treatment 66 of 152 (43.4%), control 1,108 of 4,980 (22.2%), adjusted per study, ADT and abiraterone acetate or enzalutamide.
Viral infection and replication involves attachment, entry, uncoating and release, genome replication and transcription, translation and protein processing, assembly and budding, and release. Each step can be disrupted by therapeutics.
Monoclonal antibodies were previously included. Other treatments such as dexamethasone, tocilizumab, and baricitinib were recommended for late stage hospitalized patients.
Smoking was known to cause lung cancer since at least 1939, but this was not widely recognized in the US until 1964, 25 years later. Surgeon general Leroy Burney tried publicizing the danger starting in 1957, with limited success. Surgeon general Luther Terry, appointed in 1961, prompted by President Kennedy in 1962 amid pressure from health advocates, finally got recognition in 1964. The 1964 report reviewed 7,000+ studies, but these could (and should) have been reviewed and acted upon in real-time as they were published. Historians attribute the 25 year delay to an industry campaign to manufacture doubt and controversy, through tactics like funding biased and fraudulent research from "independent" organizations, attacking scientists, and political lobbying. The success of the industry campaign is only possible because officials did not analyze the research in detail. Fraudulent industry research supported prior failures, but would have been called out as fraudulent by officials that analyzed and understood the research in real-time.
When administered late in infection, HCQ may enhance viral egress by further increasing lysosomal pH beyond the effect of ORF3a's water channel activity, thereby promoting lysosomal exocytosis, inactivating degradative enzymes, and facilitating the release of SARS-CoV-2 particles into the extracellular environment147,148. Research also suggests potential cardioprotective effects at lower doses, but cardiotoxicity with excessive dosage149. Bobrowski et al. also indicate negative effects if HCQ and remdesivir are combined.
Peters (B) et al. is subject to confounding by calendar-time (SOC evolved rapidly early in the pandemic, the linear covariate does not reflect non-linear SOC changes and hospital specific effects), hospital type (non-treatment hospitals were tertiary university centers), confounding by indication (4/7 hospitals initiated treatment on deterioration), immortal-time bias for as-treated (exposure assigned after baseline), significant differences for other experimental treatments, potential overadjustment from collider bias (steroid use and indication bias), limited baseline severity information, differences in hospice referral propensity across hospitals, unadjusted difference in time from onset to admission, difference in PCR positivity, and other factors. Mahévas et al. is subject to confounding by hospital (treatment highly dependent on the hospital, different SOC/ICU transfer practices, not included in PS), immortal time (only partly addressed in sensitivity analysis), co-treatment differences, calendar-time (SOC evolved rapidly early in the pandemic), binary coding for age (age ≥65 despite steep age-risk gradient), residual imbalance (variables dropped from PS), a composite outcome dependent on hospital triage/capacity, and other factors.