Lopinavir/ritonavir for COVID-19: real-time meta-analysis of 18 studies
 Control
Abstract
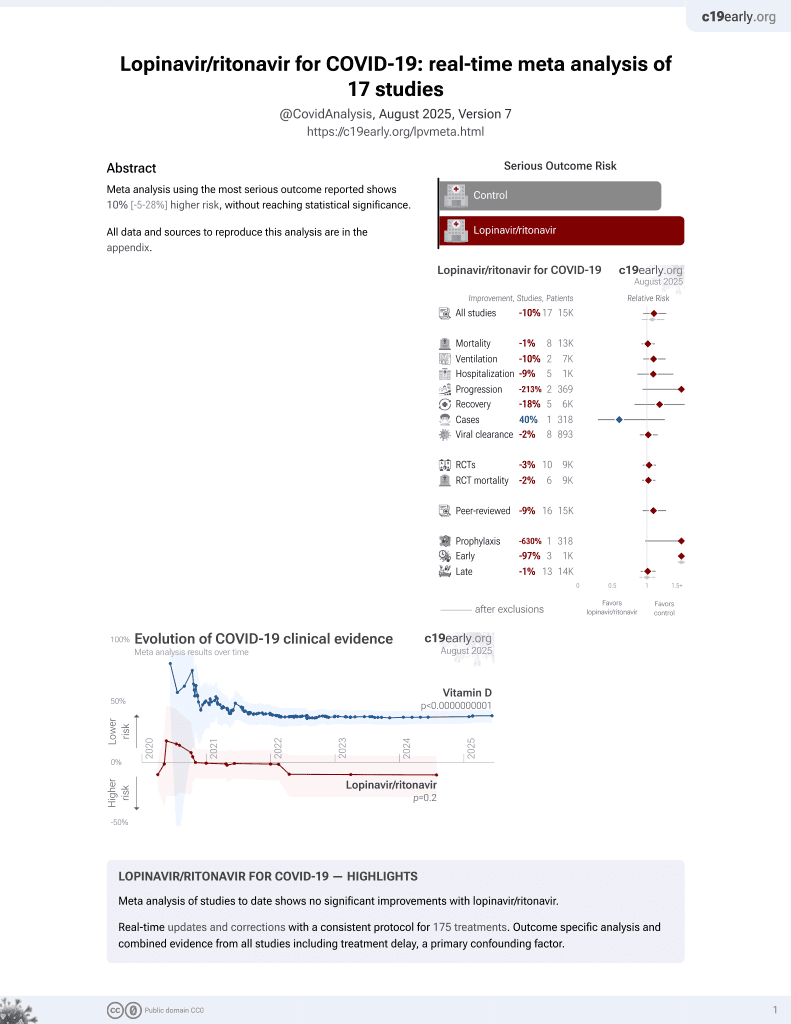
Meta-analysis using the most serious outcome reported shows
11% [-4‑28%] higher risk, without reaching statistical significance.
All data and sources to reproduce this analysis are in the appendix.
Lopinavir/ritonavir for COVID-19 — Highlights
Meta-analysis of studies to date shows no significant improvements with lopinavir/ritonavir.
Real-time updates and corrections with a consistent protocol for 226 treatments. Outcome specific analysis and combined evidence from all studies including treatment delay, a primary confounding factor.
B
Loading..
Fig. 1. A. Random-effects meta-analysis. This plot shows pooled effects,
see the specific outcome analyses for individual outcomes.
Analysis validating pooled outcomes for
COVID-19 can be found below.
Effect extraction is pre-specified, using the most serious outcome reported.
For details see the appendix.
B. Timeline of results in lopinavir/ritonavir studies.
SARS-CoV-2 infection primarily begins in the upper respiratory
tract and may progress to the lower respiratory tract, other tissues, and the
nervous and cardiovascular systems, which may lead to cytokine storm,
pneumonia, ARDS, neurological injury2-18 and
cognitive deficits5,10, cardiovascular
complications19-25, DNA
damage26-29, organ failure, and death.
Even mild untreated infections may result in persistent cognitive
deficits30—the spike protein binds to fibrin leading to
fibrinolysis-resistant blood clots, thromboinflammation, and
neuropathology.
Minimizing replication as early as possible is recommended.
SARS-CoV-2 infection and replication involves the complex interplay of 500+
host and viral proteins and other factorsA,31-38 , providing many
therapeutic targets for which many existing compounds have known activity.
Scientists have predicted that over 11,000 compounds may
reduce COVID-19 risk39, either by
directly minimizing infection or replication, by supporting immune system
function, or by minimizing secondary complications.
We analyze all significant
controlled studies of
lopinavir/ritonavir
for COVID-19.
Search methods, inclusion criteria, effect extraction criteria (more serious
outcomes have priority), all individual study data, PRISMA answers, and
statistical methods are detailed in Appendix 1. We present random-effects
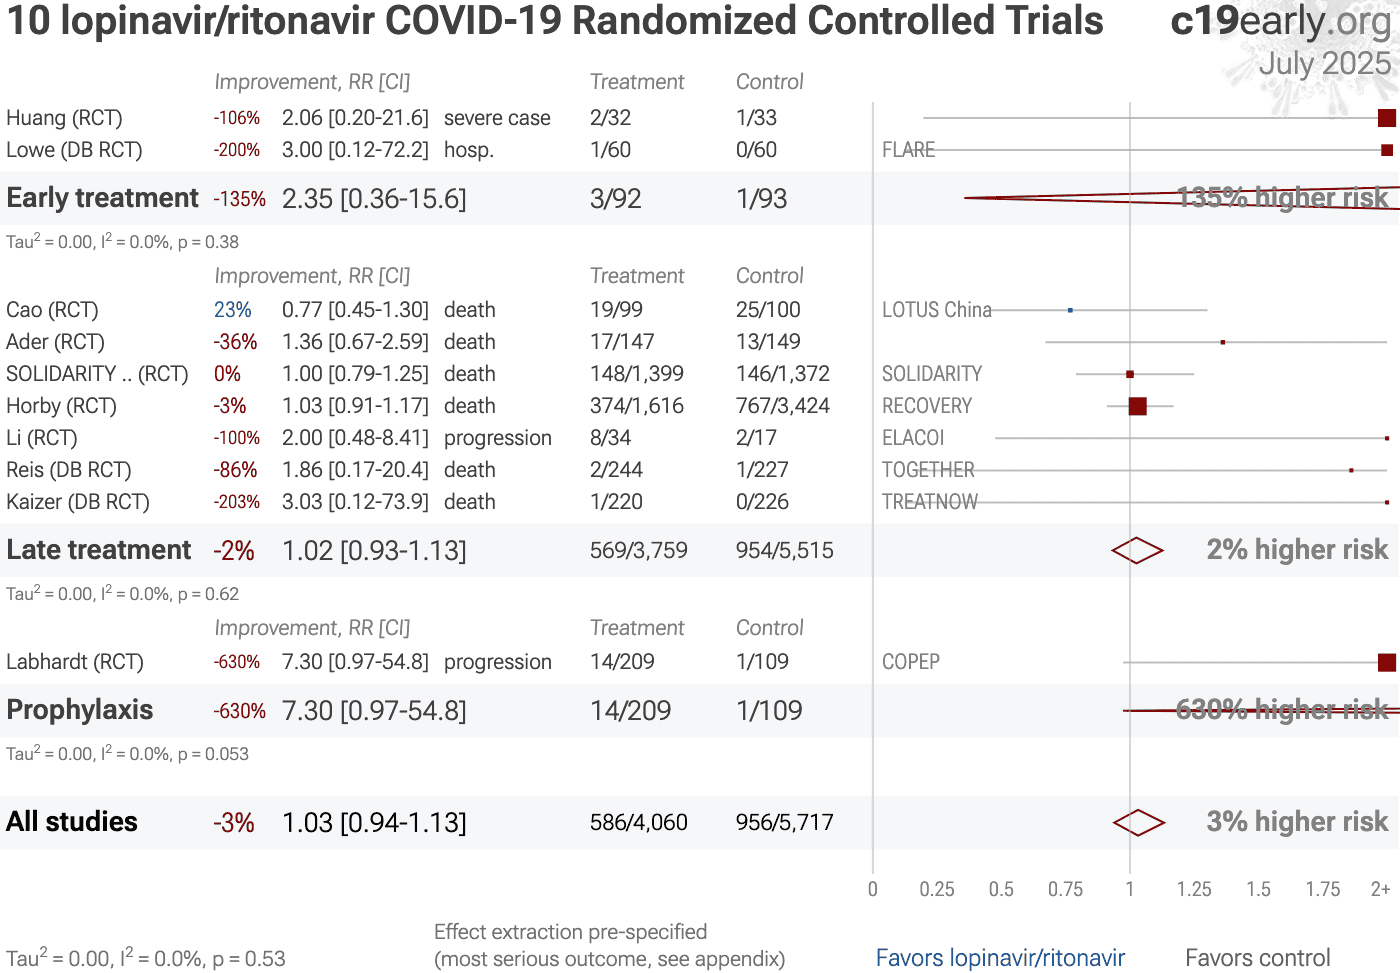
meta-analysis results for all studies, studies within each treatment stage, individual outcomes, peer-reviewed studies, Randomized Controlled Trials (RCTs), and higher quality studies.
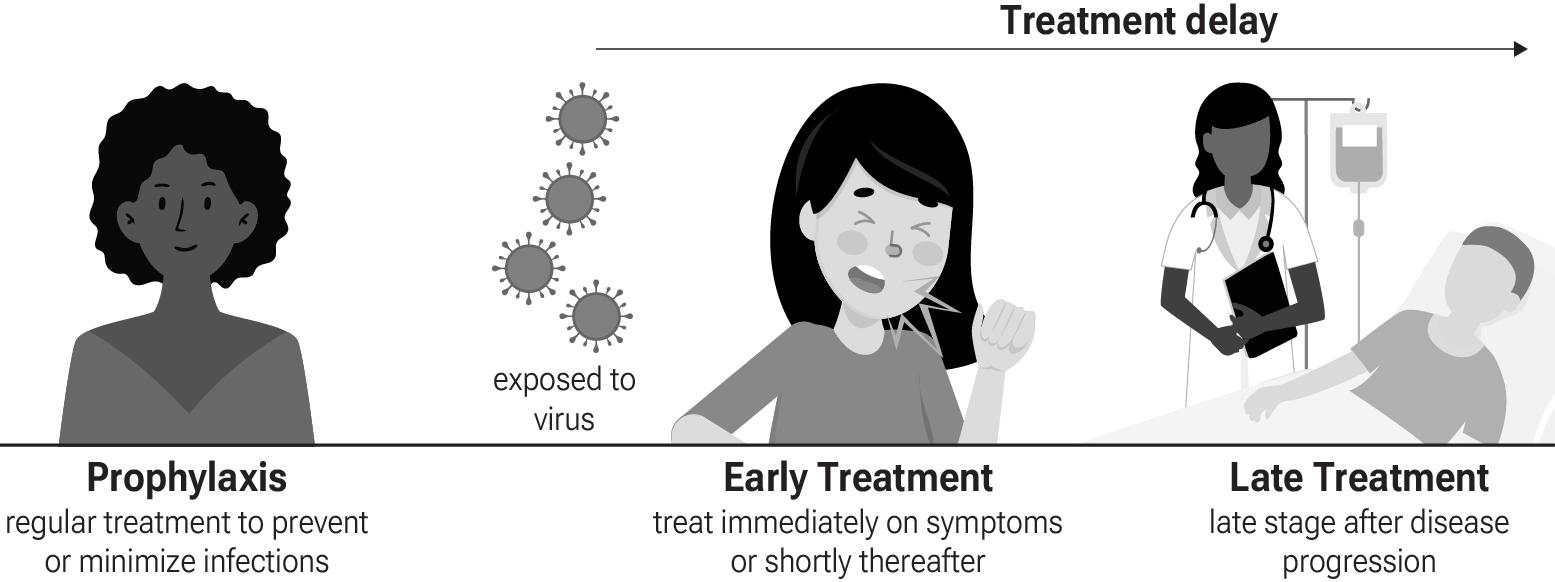
Fig. 3 shows stages of possible treatment for
COVID-19. Prophylaxis refers to regularly taking medication before
becoming sick, in order to prevent or minimize infection. Early
treatment refers to treatment immediately or soon after symptoms appear,
while late treatment refers to more delayed treatment.
Fig. 3. Treatment stages.
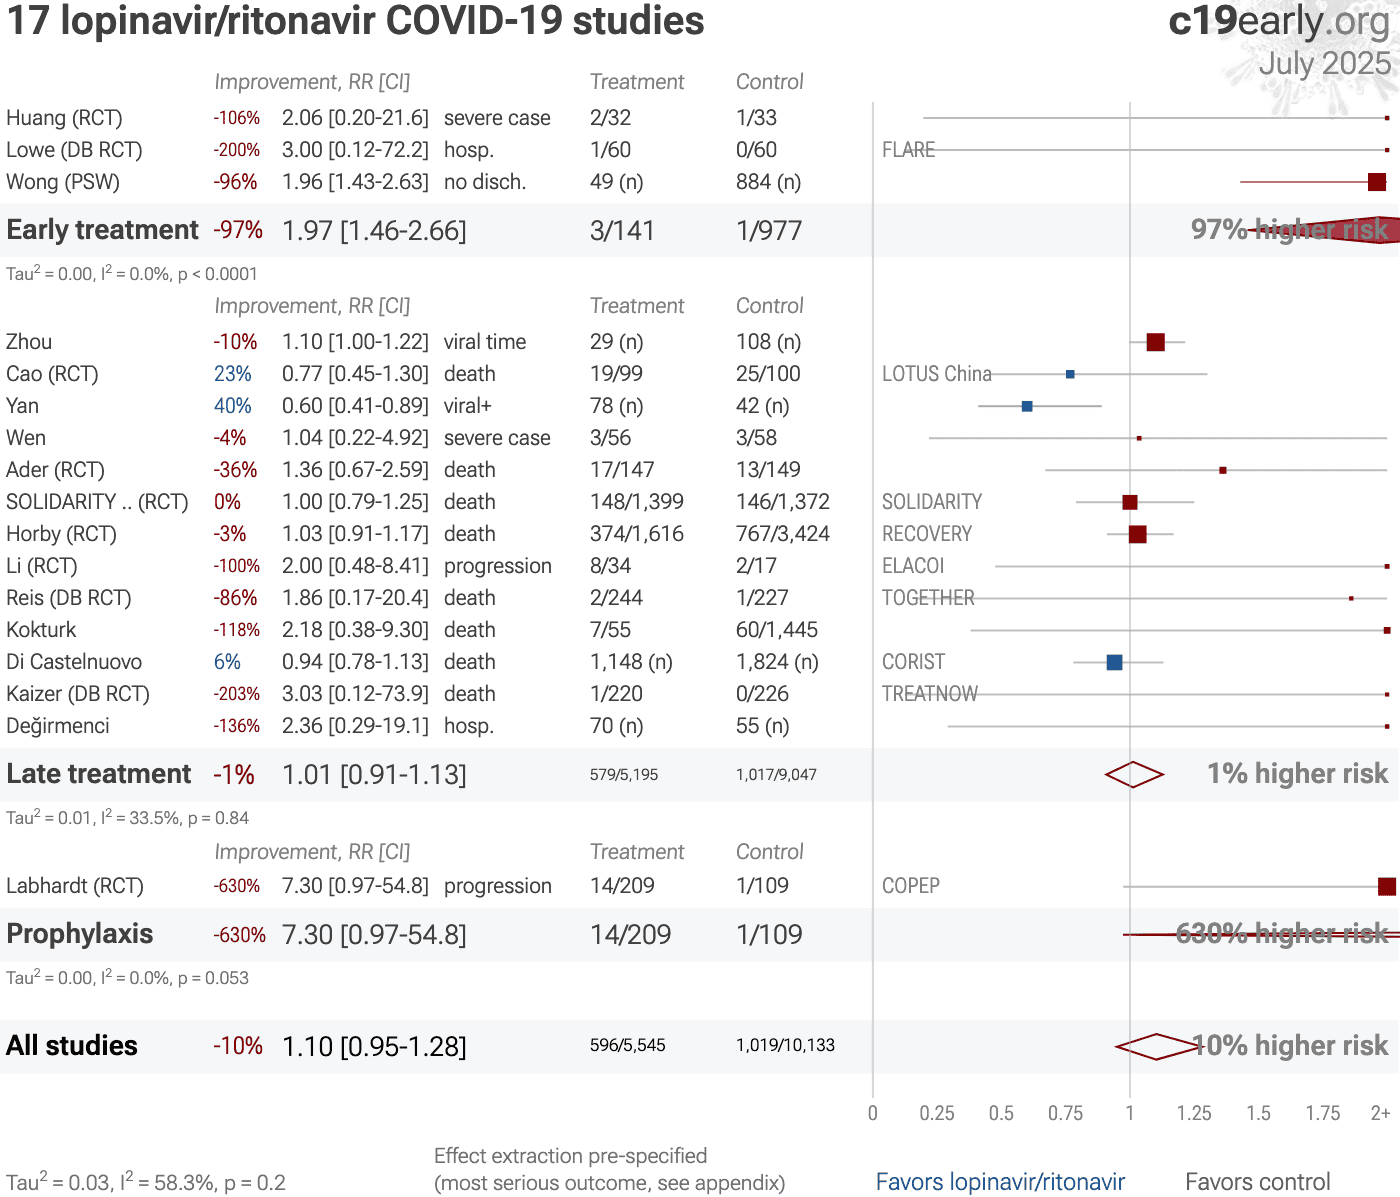
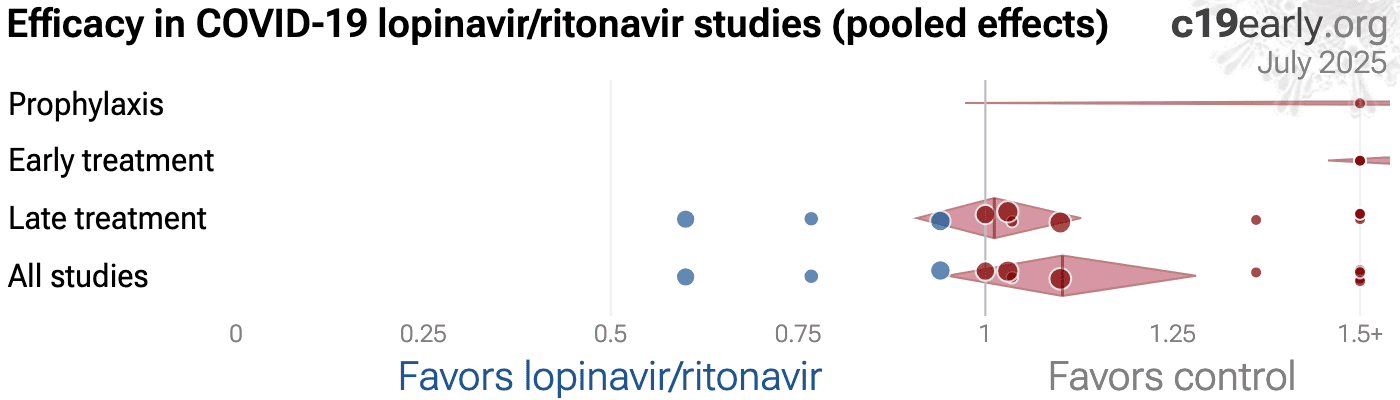
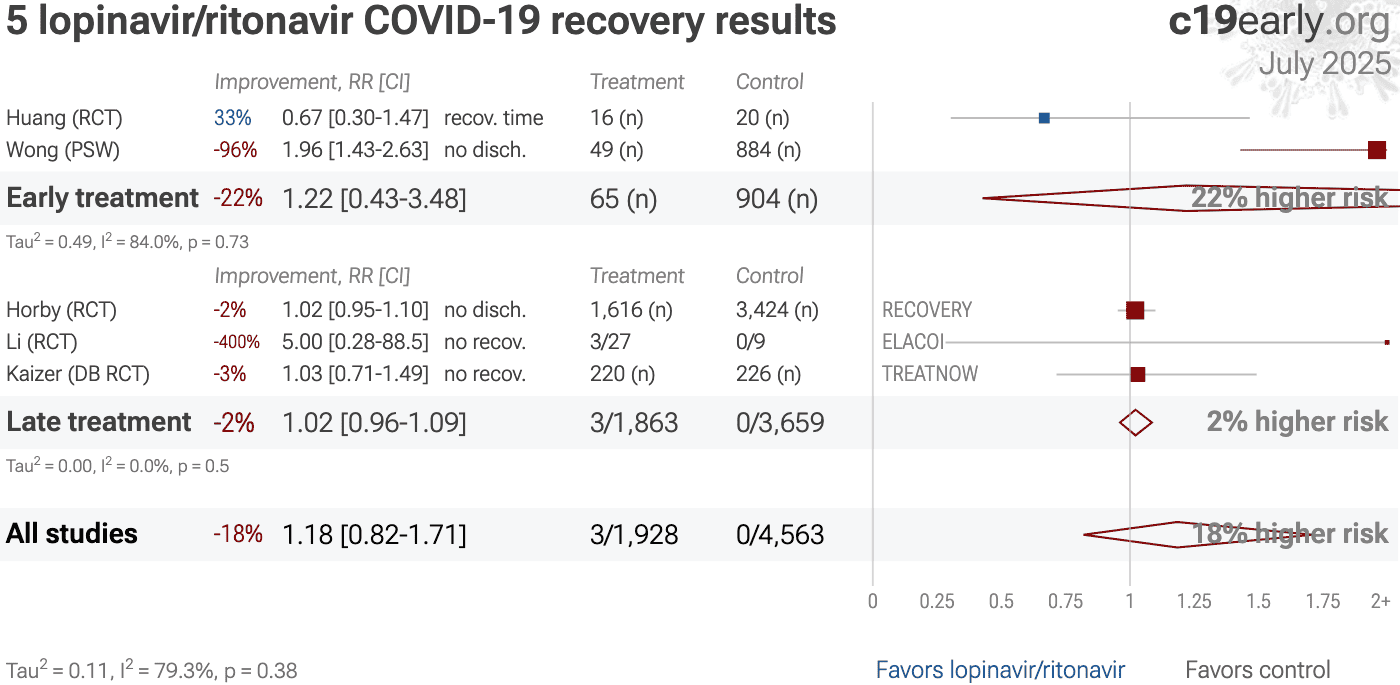
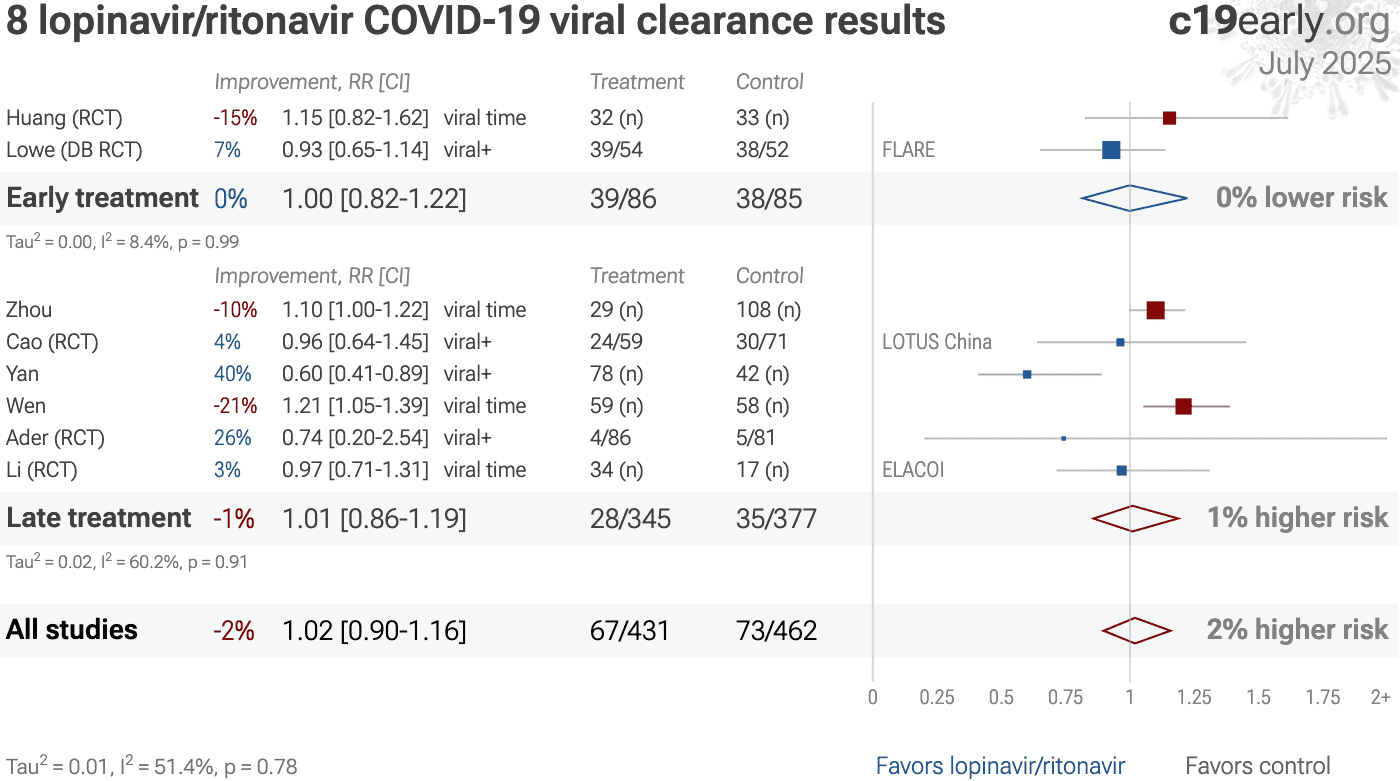
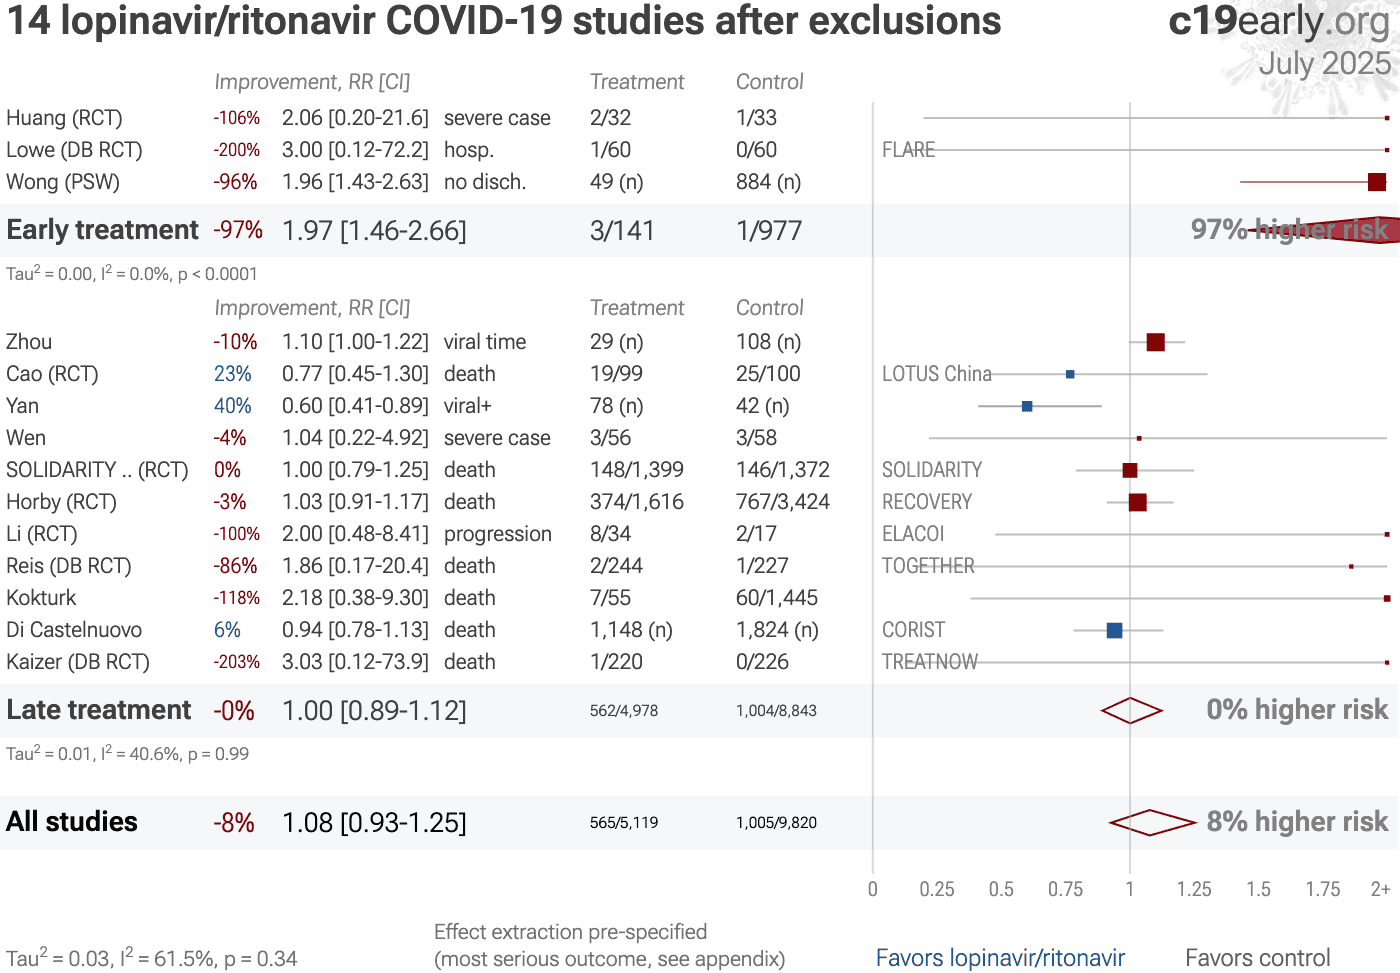
Table 1 summarizes the results for all stages combined, for Randomized Controlled Trials, for peer-reviewed studies, after exclusions, and for specific outcomes.
Table 2 shows results by treatment stage.
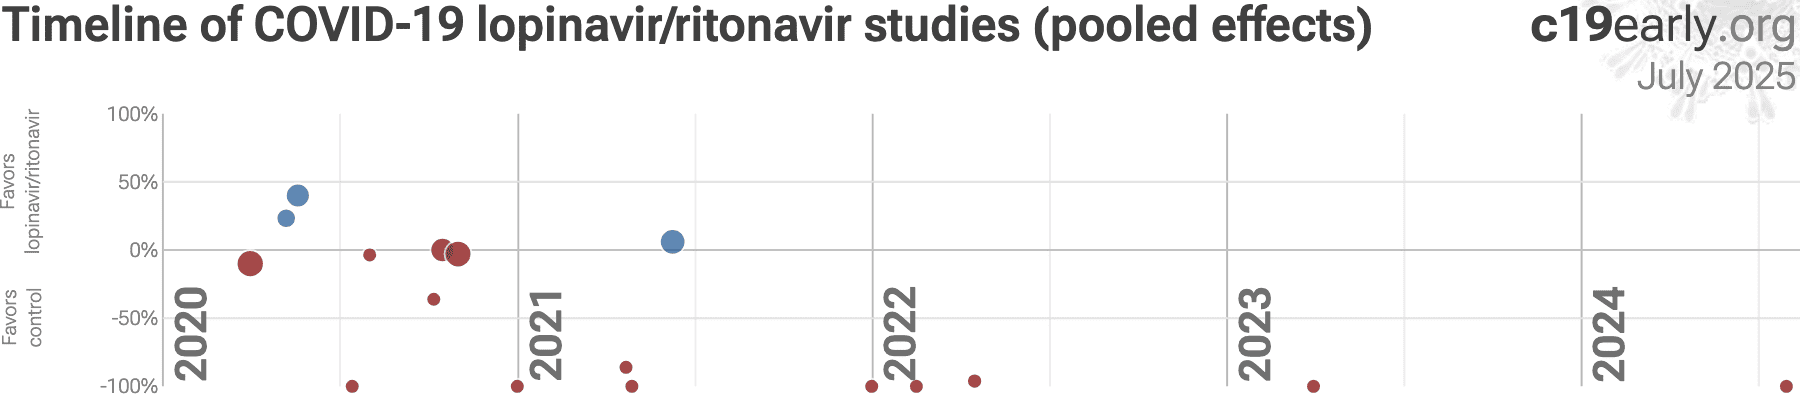
Fig. 4 plots individual results by treatment stage.
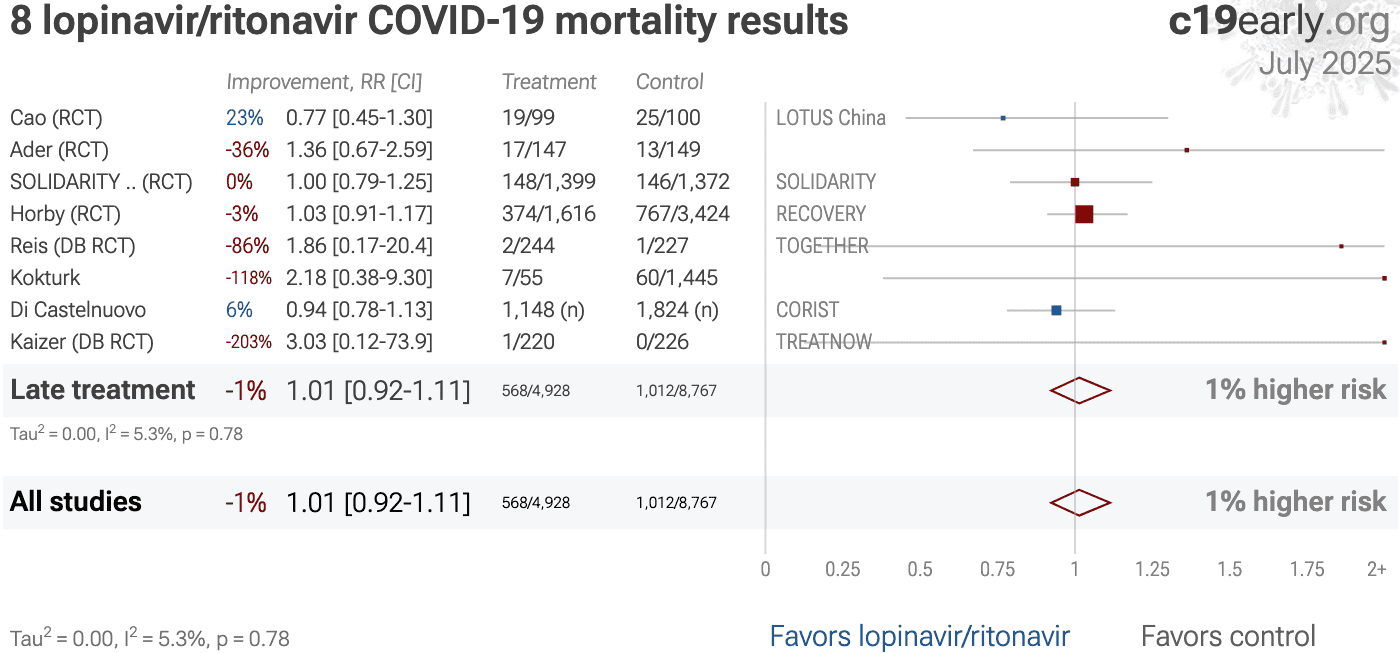
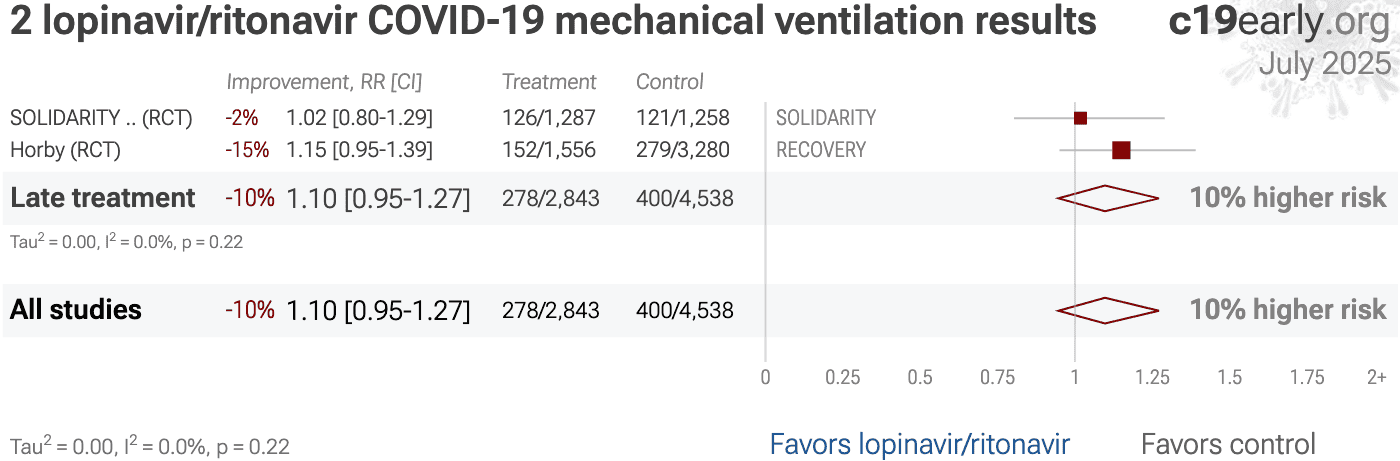
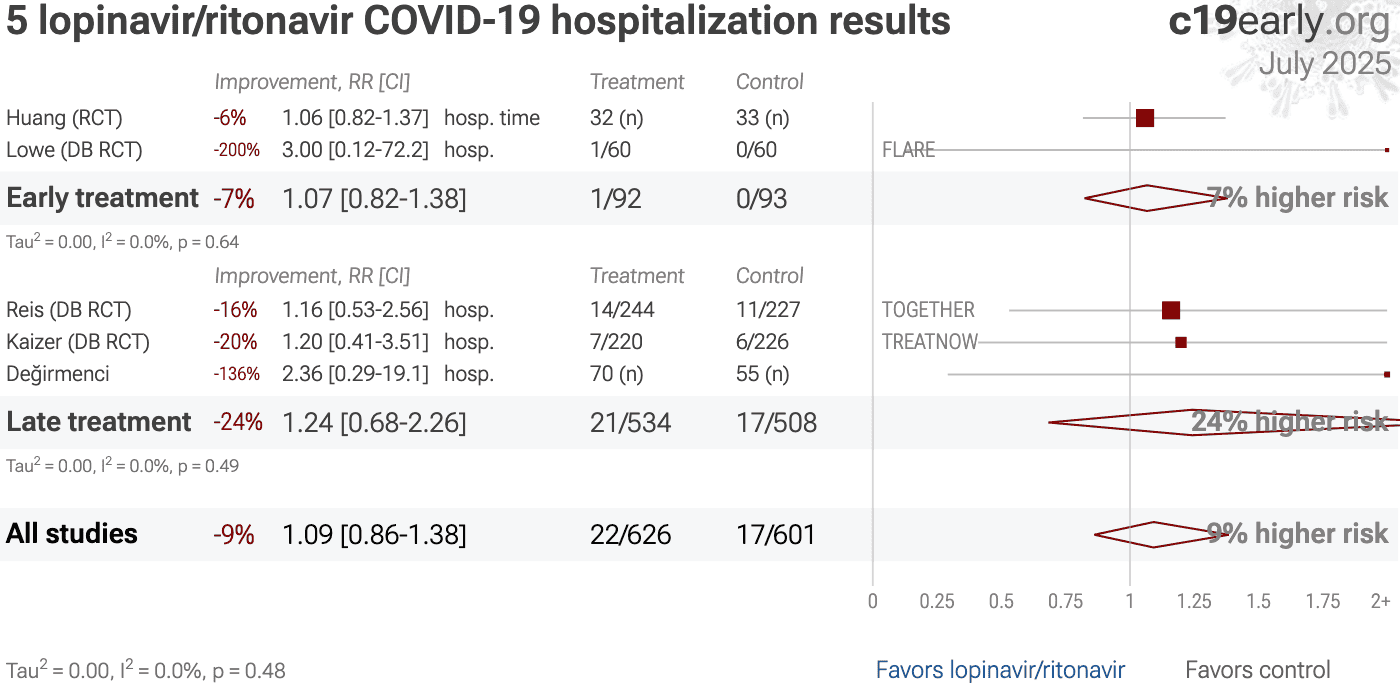
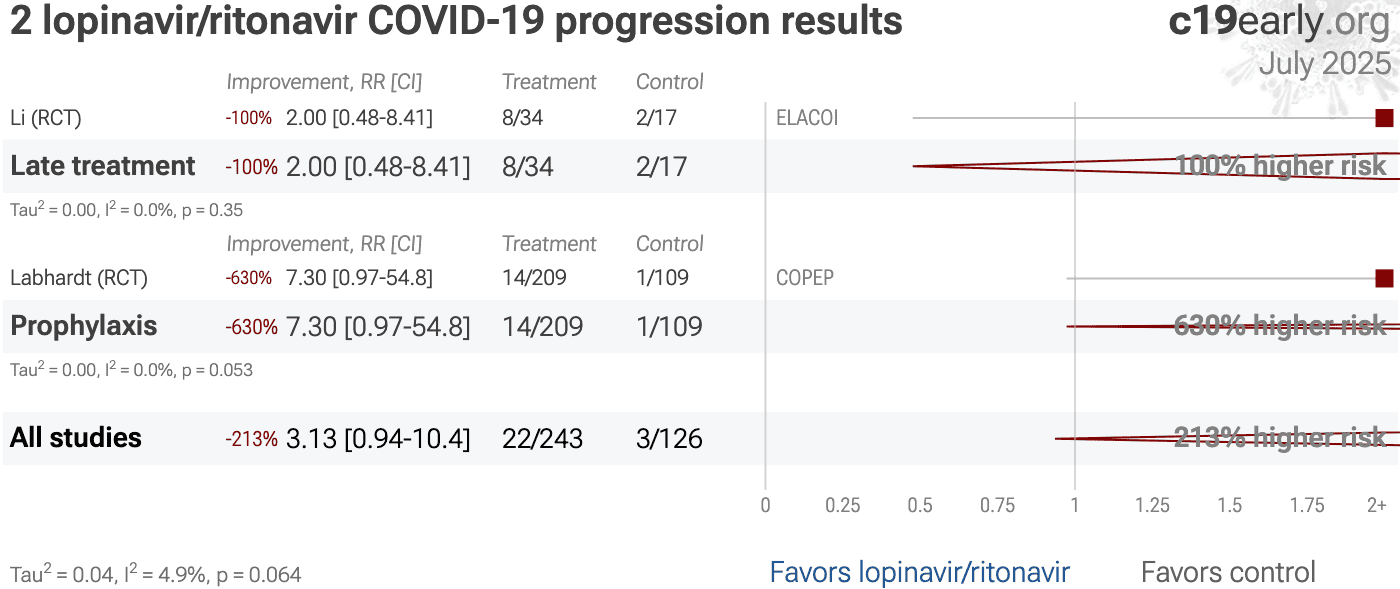
Fig. 5, 6, 7, 8, 9, 10, 11, 12, and 13
show forest plots for random-effects meta-analysis of
all studies with pooled effects, mortality results, ventilation, hospitalization, progression, recovery, cases, viral clearance, and peer reviewed studies.
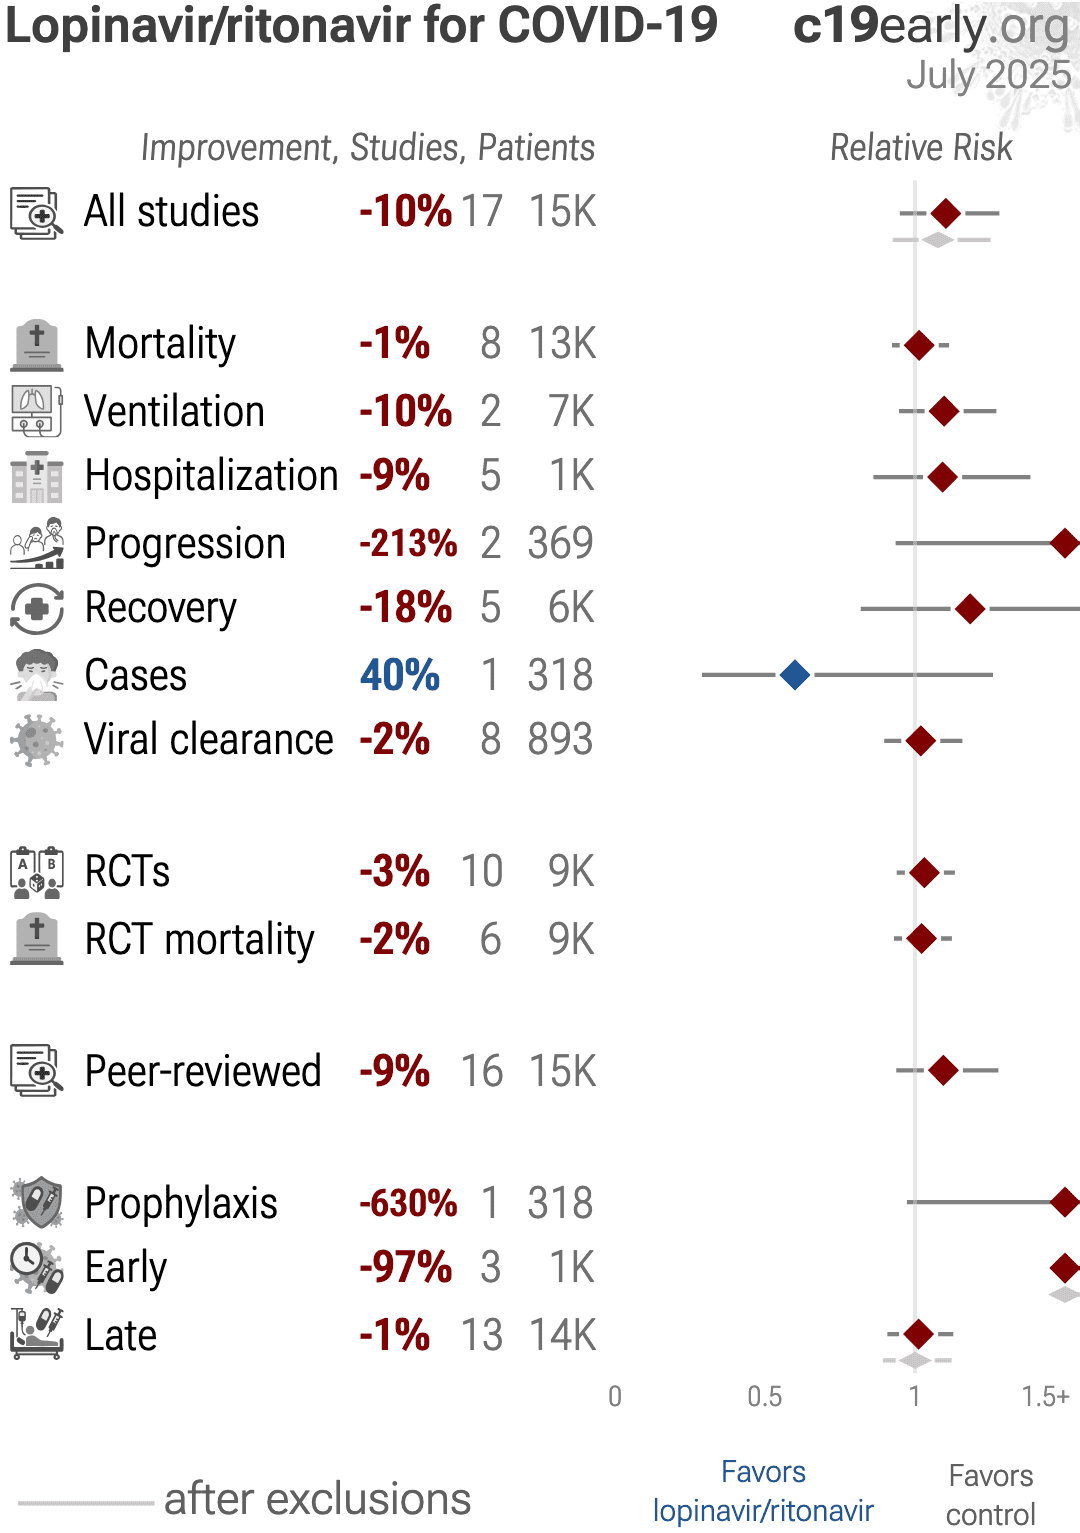
| Relative Risk | Studies | Patients | |
|---|---|---|---|
| All studies | 1.11 [0.96‑1.28] | 18 | 10K |
| After exclusions | 1.08 [0.94‑1.25] | 14 | 10K |
| Peer-reviewedPeer-reviewed | 1.10 [0.95‑1.28] | 16 | 10K |
| RCTsRCTs | 1.06 [0.98‑1.16] | 11 | 10K |
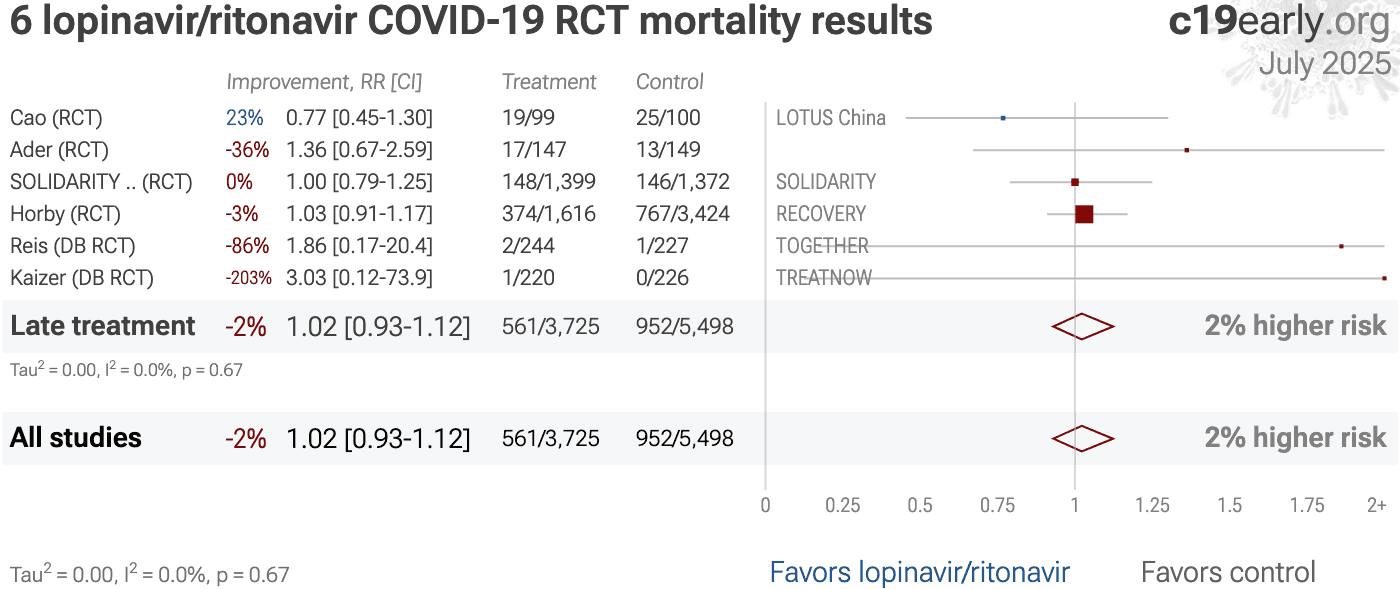
| Mortality | 1.04 [0.93‑1.15] | 8 | 10K |
| VentilationVent. | 1.10 [0.95‑1.27] | 2 | 7,381 |
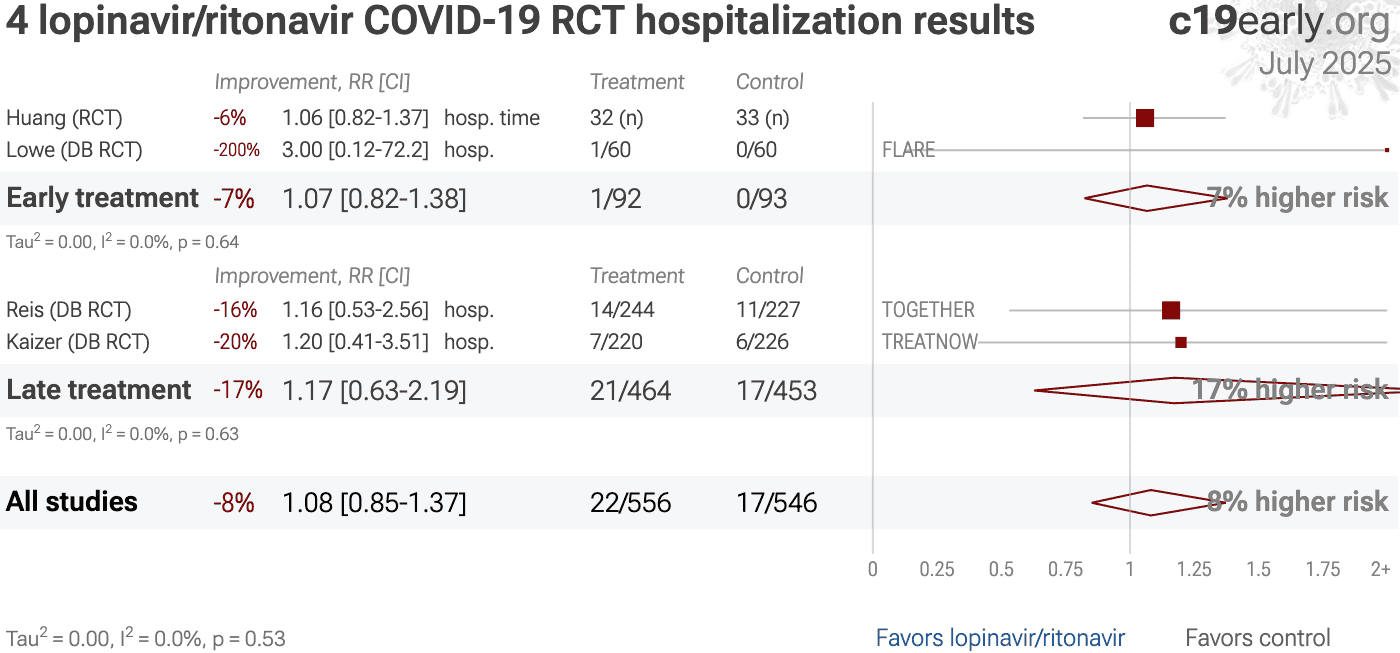
| HospitalizationHosp. | 1.09 [0.86‑1.38] | 6 | 2,121 |
| Recovery | 1.18 [0.82‑1.71] | 5 | 6,491 |
| Viral | 1.02 [0.90‑1.16] | 8 | 893 |
| RCT mortality | 1.06 [0.97‑1.15] | 6 | 9,223 |
| RCT hospitalizationRCT hosp. | 1.08 [0.85‑1.37] | 5 | 1,996 |
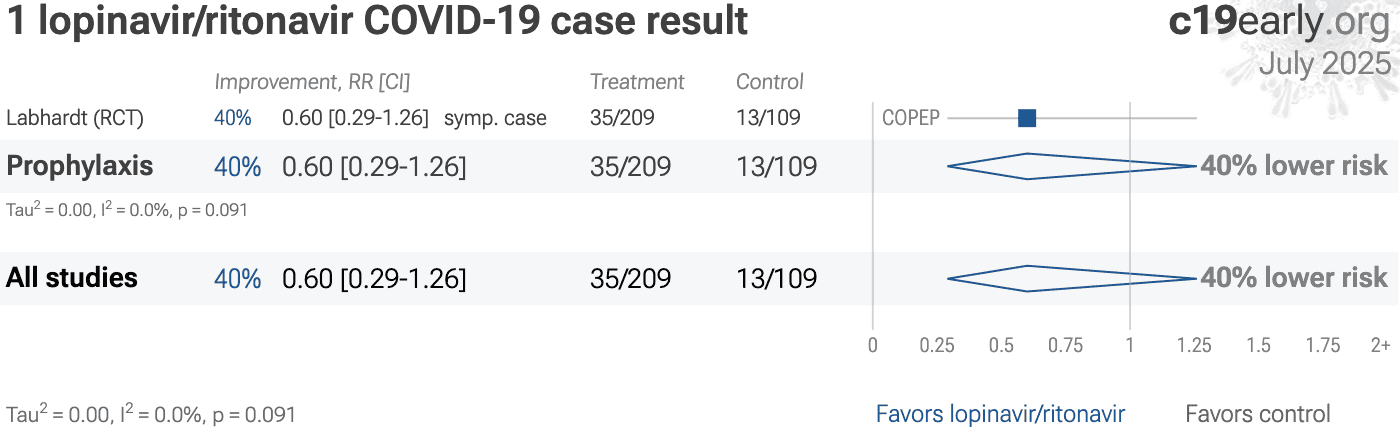
| Early treatment | Late treatment | Prophylaxis | |
|---|---|---|---|
| All studies | 1.95 [1.45‑2.63]****1.95**** [1.45‑2.63] | 1.02 [0.92‑1.14]1.02 [0.92‑1.14] | 7.30 [0.97‑54.80]7.30 [0.97‑54.80] |
| After exclusions | 1.97 [1.46‑2.66]****1.97**** [1.46‑2.66] | 1.01 [0.90‑1.13]1.01 [0.90‑1.13] | |
| Peer-reviewedPeer-reviewed | 1.97 [1.46‑2.66]****1.97**** [1.46‑2.66] | 1.02 [0.91‑1.13]1.02 [0.91‑1.13] | 7.30 [0.97‑54.80]7.30 [0.97‑54.80] |
| RCTsRCTs | 1.73 [0.43‑6.94]1.73 [0.43‑6.94] | 1.06 [0.97‑1.15]1.06 [0.97‑1.15] | 7.30 [0.97‑54.80]7.30 [0.97‑54.80] |
| Mortality | 1.04 [0.93‑1.15]1.04 [0.93‑1.15] | ||
| VentilationVent. | 1.10 [0.95‑1.27]1.10 [0.95‑1.27] | ||
| HospitalizationHosp. | 1.06 [0.82‑1.37]1.06 [0.82‑1.37] | 1.24 [0.68‑2.26]1.24 [0.68‑2.26] | |
| Recovery | 1.22 [0.43‑3.48]1.22 [0.43‑3.48] | 1.02 [0.96‑1.09]1.02 [0.96‑1.09] | |
| Viral | 1.00 [0.82‑1.22]1.00 [0.82‑1.22] | 1.01 [0.86‑1.19]1.01 [0.86‑1.19] | |
| RCT mortality | 1.06 [0.97‑1.15]1.06 [0.97‑1.15] | ||
| RCT hospitalizationRCT hosp. | 1.06 [0.82‑1.37]1.06 [0.82‑1.37] | 1.17 [0.63‑2.19]1.17 [0.63‑2.19] | |
Fig. 4. Scatter plot showing the most serious outcome in all studies, and for studies within each stage. Diamonds shows the results of random-effects meta-analysis.
Loading..
Loading..
Fig. 5. Random-effects meta-analysis for all studies.
This plot shows pooled effects,
see the specific outcome analyses for individual outcomes.
Analysis validating pooled outcomes for
COVID-19 can be found below.
Effect extraction is pre-specified, using the most serious outcome reported.
For details see the appendix.
Loading..
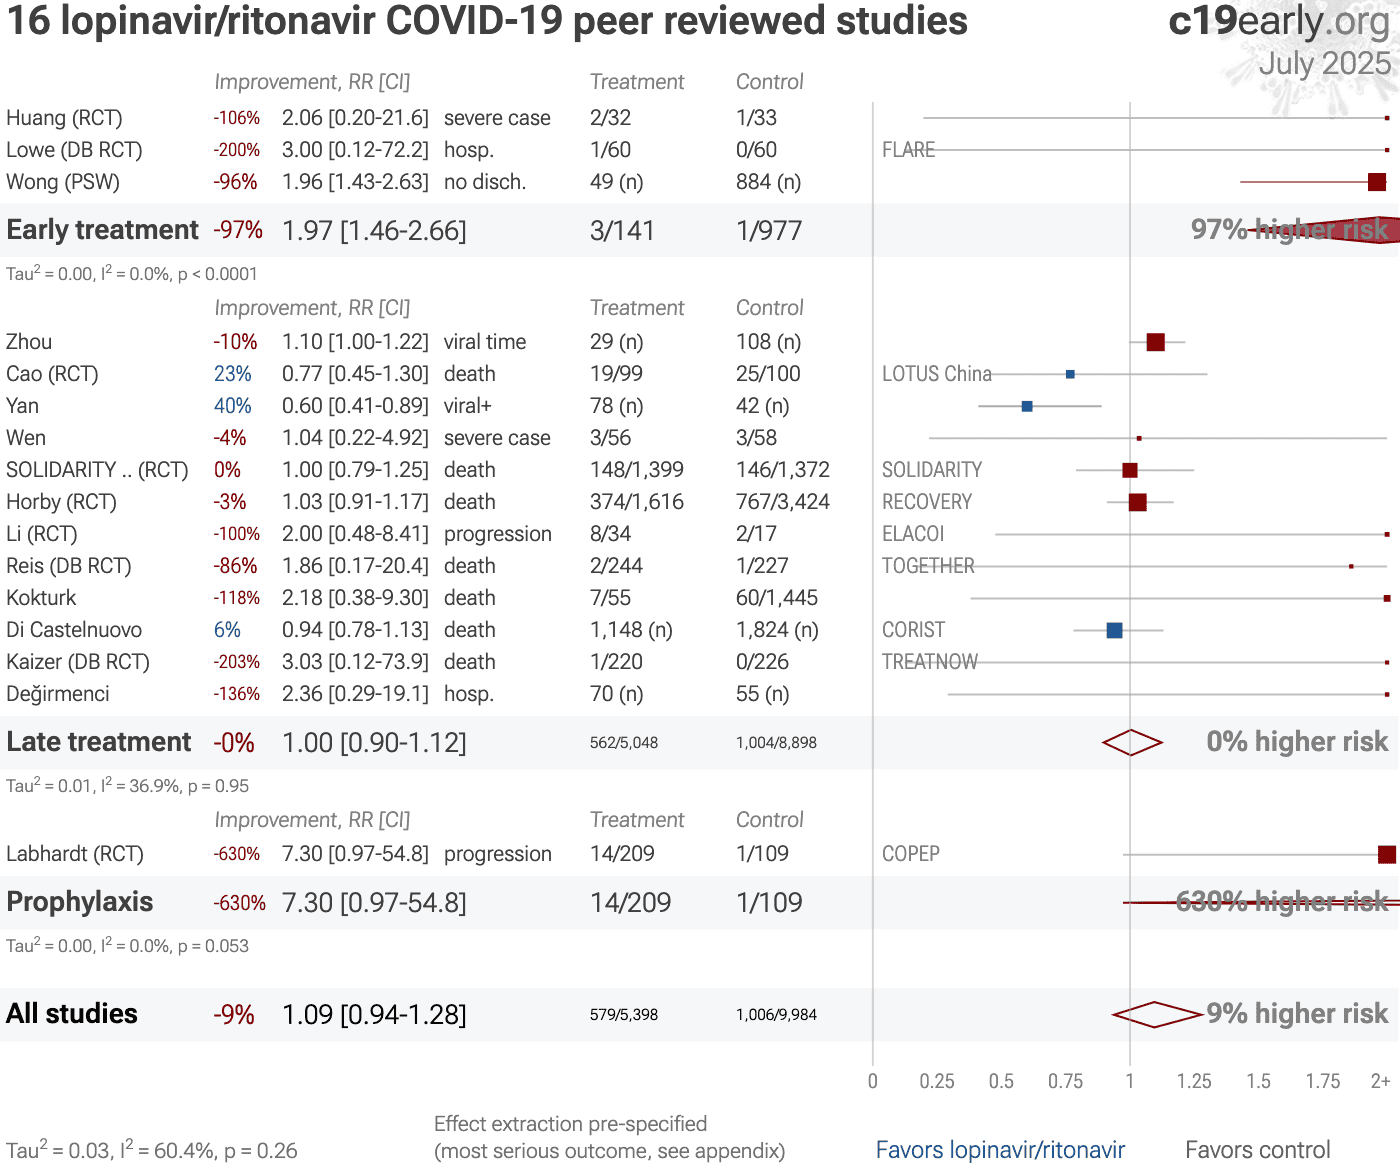
Fig. 13. Random-effects meta-analysis for peer reviewed studies.
Zeraatkar et al. analyze 356 COVID-19 trials, finding no significant
evidence that preprint results are inconsistent with peer-reviewed studies.
They also show extremely long peer-review delays, with a median of 6 months to
journal publication. A six month delay was equivalent to around 1.5 million
deaths during the first two years of the pandemic. Authors recommend using
preprint evidence, with appropriate checks for potential falsified data, which
provides higher certainty much earlier. Davidson et al. also showed no
important difference between meta-analysis results of preprints and
peer-reviewed publications for COVID-19, based on 37 meta-analyses including
114 trials.
Effect extraction is pre-specified, using the most serious outcome reported,
see the appendix for details.
Analysis validating pooled outcomes for
COVID-19 can be found below.
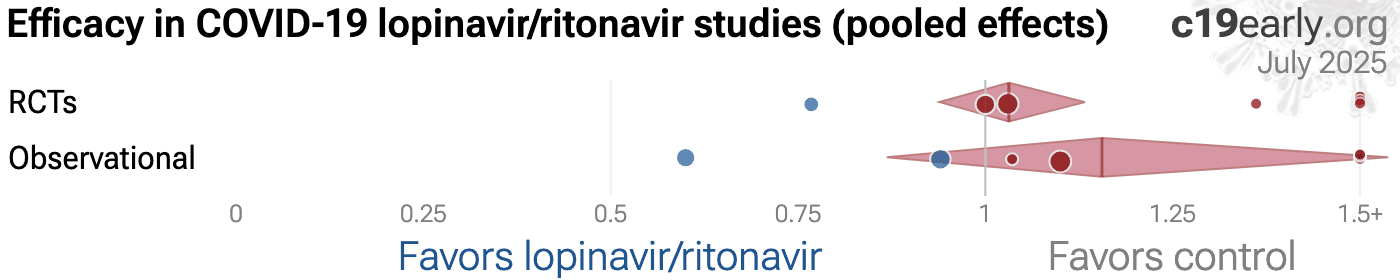
Fig. 14 shows a comparison of results for RCTs and observational studies.
Fig. 15, 16, and 17
show forest plots for random-effects meta-analysis of
all Randomized Controlled Trials, RCT mortality results, and RCT hospitalization results.
RCT results are included in Table 1 and Table 2.
Fig. 14. Results for RCTs and observational studies.
RCTs help to make study groups more similar and can provide a higher level of
evidence, however they are subject to many biases42, and
analysis of double-blind RCTs has identified extreme levels of bias43.
For COVID-19, the overhead may delay treatment, dramatically compromising
efficacy; they may encourage monotherapy for simplicity at the cost of
efficacy which may rely on combined or synergistic effects; the participants
that sign up may not reflect real world usage or the population that benefits
most in terms of age, comorbidities, severity of illness, or other factors;
standard of care may be compromised and unable to evolve quickly based on
emerging research for new diseases; errors may be made in randomization and
medication delivery; and investigators may have hidden agendas or vested
interests influencing design, operation, analysis, reporting, and the
potential for fraud. All of these biases have been observed with COVID-19
RCTs. There is no guarantee that a specific RCT provides a higher level of
evidence.
RCTs are expensive and many RCTs are funded
by pharmaceutical companies or other organizations with conflicts of interest, for example
governments that previously denied treatment with the study drug.
For COVID-19, this creates an incentive to show efficacy for
patented commercial products, and an incentive to show a lack of efficacy for
inexpensive treatments. The bias is expected to be significant, for example
Als-Nielsen et al. analyzed 370 RCTs from Cochrane reviews, showing that
trials funded by for-profit organizations were 5 times more likely to
recommend the experimental drug compared with those funded by nonprofit
organizations. Bekelman et al. and Lundh et al. show that
industry-sponsored studies are more likely to be favorable.
For COVID-19, some major philanthropic organizations are
largely funded by investments with extreme conflicts of interest for and
against specific COVID-19 interventions.
High quality RCTs for novel acute diseases are more challenging, with
increased ethical issues due to the urgency of treatment, increased risk due
to enrollment delays, and more difficult design with a rapidly evolving
evidence base. For COVID-19, the most common site of initial infection is the
upper respiratory tract. Immediate treatment is likely to be most successful
and may prevent or slow progression to other parts of the body. For a
non-prophylaxis RCT, it makes sense to provide treatment in advance and
instruct patients to use it immediately on symptoms, just as some governments
have done by providing medication kits in advance. Unfortunately, no RCTs have
been done in this way. Every treatment RCT to date involves delayed treatment.
Among the 226 treatments we have analyzed,
67% of RCTs involve very late treatment 5+ days after
onset. No non-prophylaxis COVID-19 RCTs match the potential real-world use of
early treatments. They may more accurately represent results for treatments
that require visiting a medical facility, e.g., those requiring intravenous
administration.
Concato et al. report a paradoxical finding—RCT results had higher
variability, and only RCTs were found to sometimes report significant results the opposite
of the overall result. The same trend is seen for the most popular (most politicized)
COVID-19 treatments—considering all statistically significant results reported in
studies, RCTs are slightly more likely to report a result in the opposite direction. In
other words, for these COVID-19 treatments and for the topics covered by Concato et al., assuming causality from a single study is more likely to result in an incorrect conclusion for
RCTs.
Increased risk of inconsistent results for RCTs suggests higher prevalence of
bias, which may arise due to many issues including design bias, conflicts of interest,
treatment differences by physicians aware of allocation, attrition bias, ascertainment
bias, randomization failures, errors, or fraud.
Currently, 59 of the treatments we analyze show statistically significant efficacy or harm, defined as ≥10% decreased risk or >0% increased risk from ≥3 studies. Of these, 54% have been confirmed in RCTs, with a mean delay of 7.8 months (62% with 8.7 months delay for low-cost treatments). The remaining treatments either have no RCTs, or the point estimate is consistent.
Neither observational studies nor RCTs prove causation—any study can be
flawed or fraudulent. We need much more, for example a combination of results from many
independent teams, detailed understanding of each study, knowledge of conflicts/team
reliability, dose-response relationships, delay-response relationships, logical results across outcomes, or details consistent with preclinical expectations.
All studies must be evaluated individually. RCTs for a
given medication and disease may be more reliable, however they may also be
less reliable. For off-patent medications, very high conflict of interest
trials may be more likely to be RCTs, and more likely to be large trials that
dominate meta-analyses.
Loading..
Fig. 15. Random-effects meta-analysis for all Randomized Controlled Trials.
This plot shows pooled effects,
see the specific outcome analyses for individual outcomes.
Analysis validating pooled outcomes for
COVID-19 can be found below.
Effect extraction is pre-specified, using the most serious outcome reported.
For details see the appendix.
To avoid bias in the selection of studies, we analyze all
non-retracted studies. Here we show the results after excluding
studies with major issues likely to alter results, non-standard studies, and
studies where very minimal detail is currently available. Our bias evaluation
is based on analysis of each study and identifying when there is a significant
chance that limitations will substantially change the outcome of the study. We
believe this can be more valuable than checklist-based approaches such as
Cochrane GRADE, which can be easily influenced by potential bias, may ignore
or underemphasize serious issues not captured in the checklists, and may
overemphasize issues unlikely to alter outcomes in specific cases (for example
certain specifics of randomization with a very large effect size and
well-matched baseline characteristics).
The studies excluded are as below.
Fig. 18 shows a forest plot for random-effects
meta-analysis of all studies after exclusions.
Ader, very late stage, >50% on oxygen/ventilation at baseline.
Değirmenci, unadjusted results with no group details.
Labhardt, significant confounding by time possible.
Strub-Wourgaft, significant confounding by time possible.
Loading..
Fig. 18. Random-effects meta-analysis for all studies after exclusions.
This plot shows pooled effects,
see the specific outcome analyses for individual outcomes.
Analysis validating pooled outcomes for
COVID-19 can be found below.
Effect extraction is pre-specified, using the most serious outcome reported.
For details see the appendix.
Heterogeneity in COVID-19 studies arises from many factors including:
The time between infection or the onset of symptoms and
treatment may critically affect how well a treatment works. For example an
antiviral may be very effective when used early but may not be effective in
late stage disease, and may even be harmful. Oseltamivir, for example, is
generally only considered effective for influenza when used within 0-36 or
0-48 hours52,53. Baloxavir marboxil studies for influenza
also show that treatment delay is critical — Ikematsu et al. report
an 86% reduction in cases for post-exposure prophylaxis, Hayden et al.
show a 33 hour reduction in the time to alleviation of symptoms for treatment
within 24 hours and a reduction of 13 hours for treatment within 24-48 hours,
and Kumar et al. report only 2.5 hours improvement for inpatient
treatment.
| Treatment delay | Result |
| Post-exposure prophylaxis | 86% fewer cases54 |
| <24 hours | -33 hours symptoms55 |
| 24-48 hours | -13 hours symptoms55 |
| Inpatients | -2.5 hours to improvement56 |
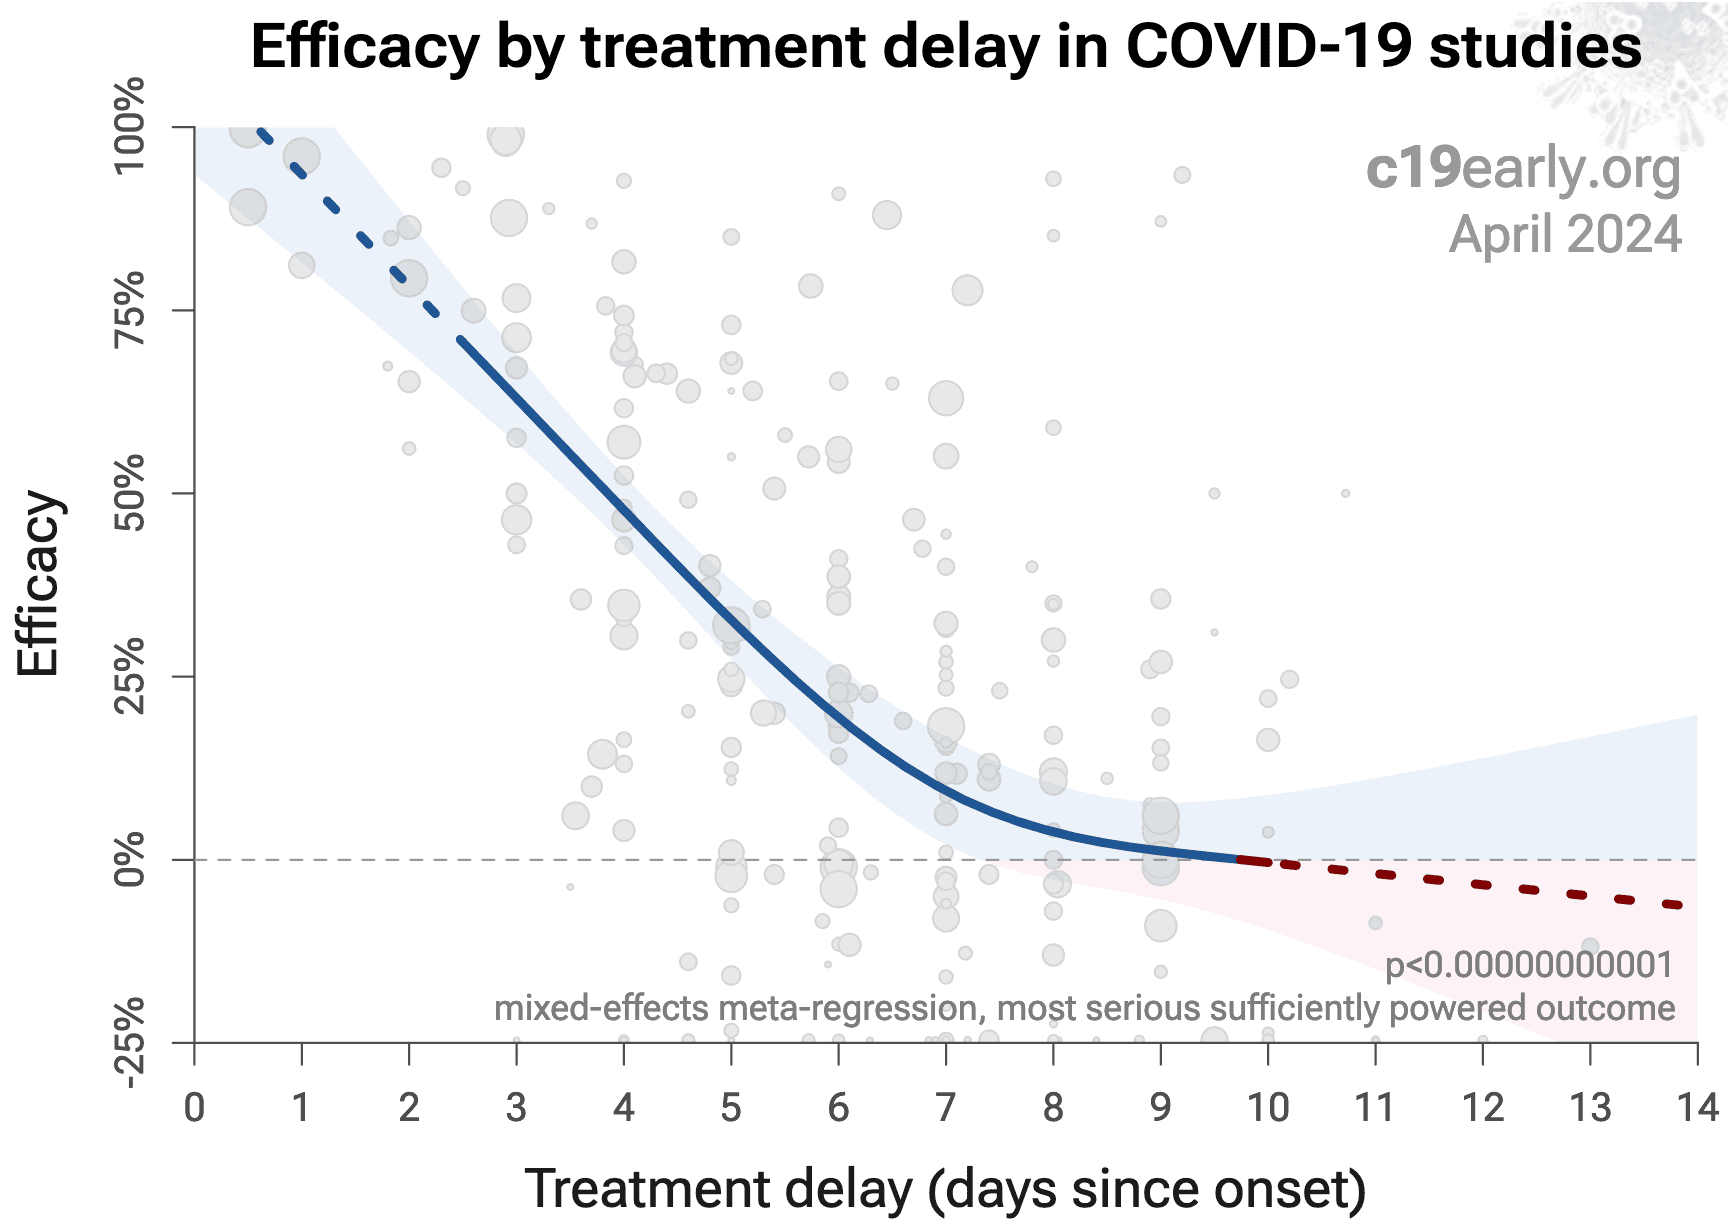
Fig. 19 shows a mixed-effects meta-regression for
efficacy as a function of treatment delay in COVID-19 studies from 226 treatments, showing that efficacy
declines rapidly with treatment delay. Early treatment is critical for COVID-19.
Fig. 19. Early treatment is more effective. Meta-regression showing efficacy as a function of treatment delay in COVID-19 studies from 226 treatments.
Details of the patient population including age and comorbidities may
critically affect how well a treatment works. For example, many COVID-19
studies with relatively young low-comorbidity patients show all patients
recovering quickly with or without treatment. In such cases, there is little
room for an effective treatment to improve results, for example as in
López-Medina et al.
Efficacy may depend critically on the distribution of
SARS-CoV-2 variants encountered by patients. Risk varies significantly across
variants58, for example the Gamma variant shows significantly
different characteristics59-62. Different
mechanisms of action may be more or less effective depending on variants, for
example the degree to which TMPRSS2 contributes to viral entry can differ
across variants63,64.
Effectiveness may depend strongly on the dosage and treatment regimen.
The quality of medications may vary significantly between
manufacturers and production batches, which may significantly affect efficacy
and safety. Williams et al. analyze ivermectin from 11 different sources,
showing highly variable antiparasitic efficacy across different manufacturers.
Xu et al. analyze a treatment from two different manufacturers, showing 9
different impurities, with significantly different concentrations for each
manufacturer.
Across all
studies there is a strong association between different outcomes, for example
improved recovery is strongly associated with lower mortality. However,
efficacy may differ depending on the effect measured, for example a treatment
may be more effective against secondary complications and have minimal effect
on viral clearance.
The
distribution of studies will alter the outcome of a meta-analysis. Consider a
simplified example where everything is equal except for the treatment delay,
and effectiveness decreases to zero or below with increasing delay. If there
are many studies using very late treatment, the outcome may be negative, even
though early treatment is very effective.
All meta-analyses combine heterogeneous studies, varying in population,
variants, and potentially all factors above, and therefore may obscure
efficacy by including studies where treatment is less effective. Generally, we
expect the estimated effect size from meta-analysis to be less than that for
the optimal case.
Looking at all studies is valuable for providing an overview of all research,
important to avoid cherry-picking, and informative when a positive result is
found despite combining less-optimal situations. However, the resulting
estimate does not apply to specific cases such as
early treatment in high-risk populations.
While we present results for all studies, we also present treatment time and
individual outcome analyses, which may be more informative for specific use
cases.
For COVID-19, delay in clinical results translates into
additional death and morbidity, as well as additional economic and societal
damage. Combining the results of studies reporting different outcomes is
required.
There may be no mortality in a trial with low-risk patients,
however a reduction in severity or improved viral clearance may translate
into lower mortality in a high-risk population.
Different studies may report lower severity, improved recovery, and lower mortality,
and the significance may be very high when combining the results.
"The studies reported different outcomes" is not a good reason for
disregarding results.
Pooling the results of studies reporting different outcomes allows us to use
more of the available information. Logically we should, and do, use additional
information when evaluating treatments—for example dose-response and
treatment delay-response relationships provide additional evidence of efficacy
that is considered when reviewing the evidence for a treatment.
We present both specific outcome and pooled analyses.
In order to combine the results of studies reporting different outcomes we use
the most serious outcome reported in each study, based on the thesis that
improvement in the most serious outcome provides comparable measures of
efficacy for a treatment. A critical advantage of this approach is
simplicity and transparency.
There are many other ways to combine evidence for different outcomes, along
with additional evidence such as dose-response relationships, however these
increase complexity.
Trials with high-risk patients may be restricted due to ethics for treatments
that are known or expected to be effective, and they increase difficulty for
recruiting. Using less severe outcomes as a proxy for more serious outcomes
allows faster and safer collection of evidence.
For many COVID-19 treatments, a reduction in mortality logically
follows from a reduction in hospitalization, which follows from a reduction in
symptomatic cases, which follows from a reduction in PCR positivity. We can
directly test this for COVID-19.
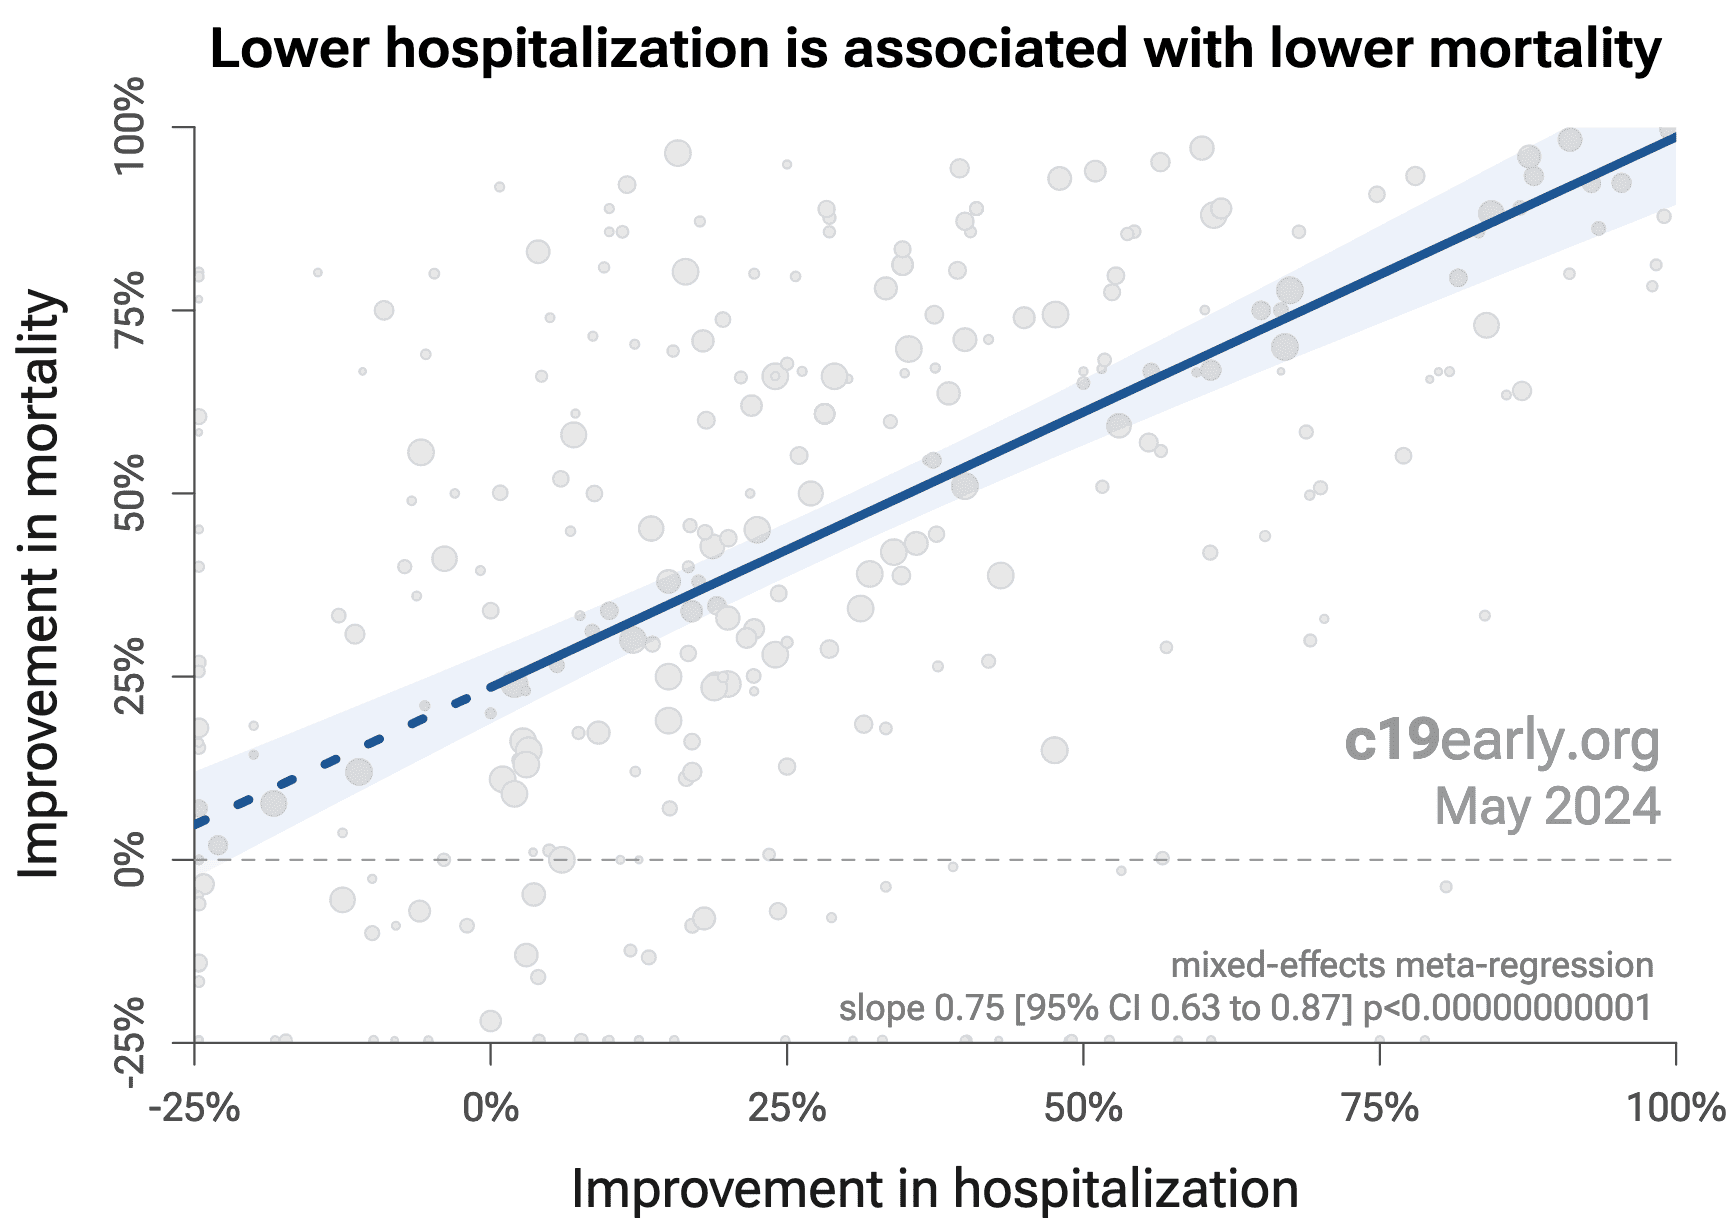
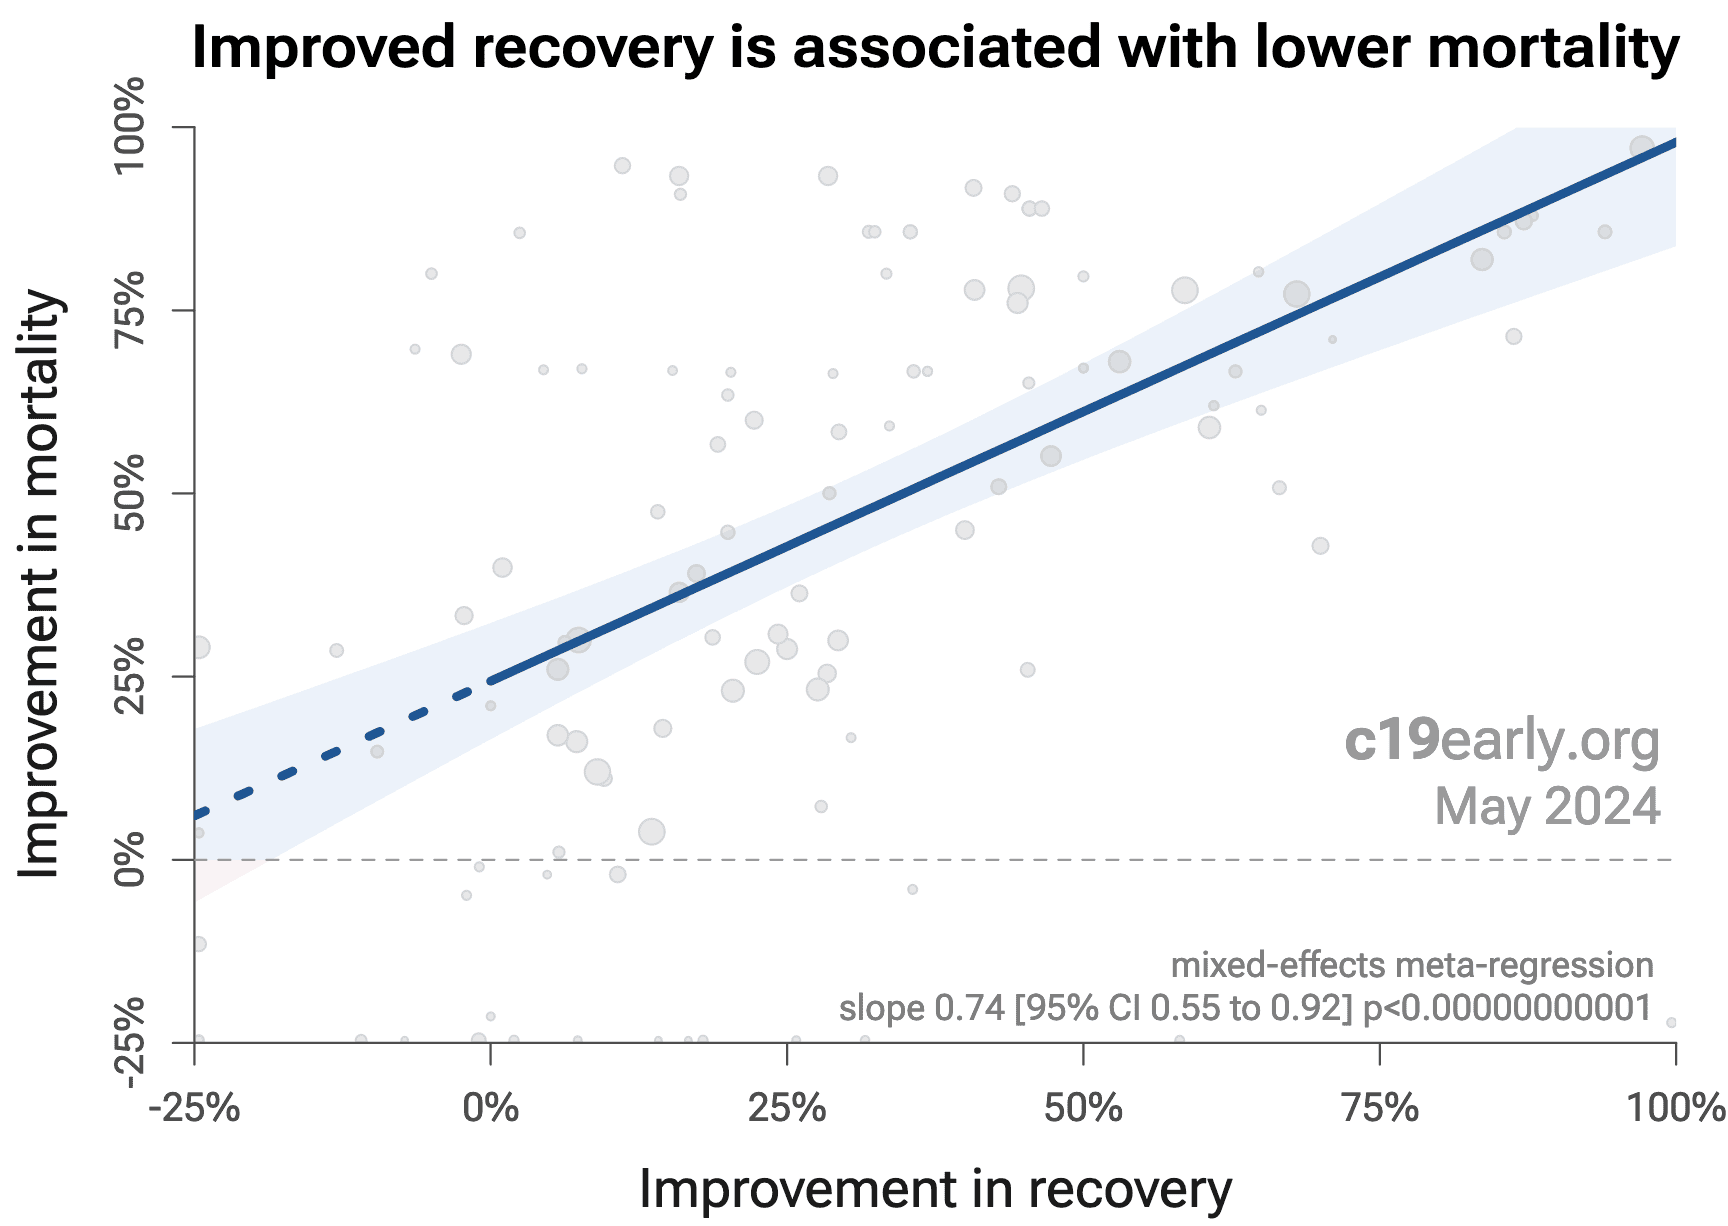
Analysis of the the association between different outcomes across studies from
all 226
treatments we cover confirms the validity of pooled outcome analysis for COVID-19.
Fig. 20 shows that lower hospitalization is very strongly associated
with lower mortality (p < 0.000000000001).
Similarly, Fig. 21 shows that improved recovery is very strongly associated
with lower mortality (p < 0.000000000001).
Considering the extremes, Singh et al. show an association between viral clearance and
hospitalization or death, with p = 0.003 after excluding one large
outlier from a mutagenic treatment, and based on 44 RCTs including 52,384
patients.
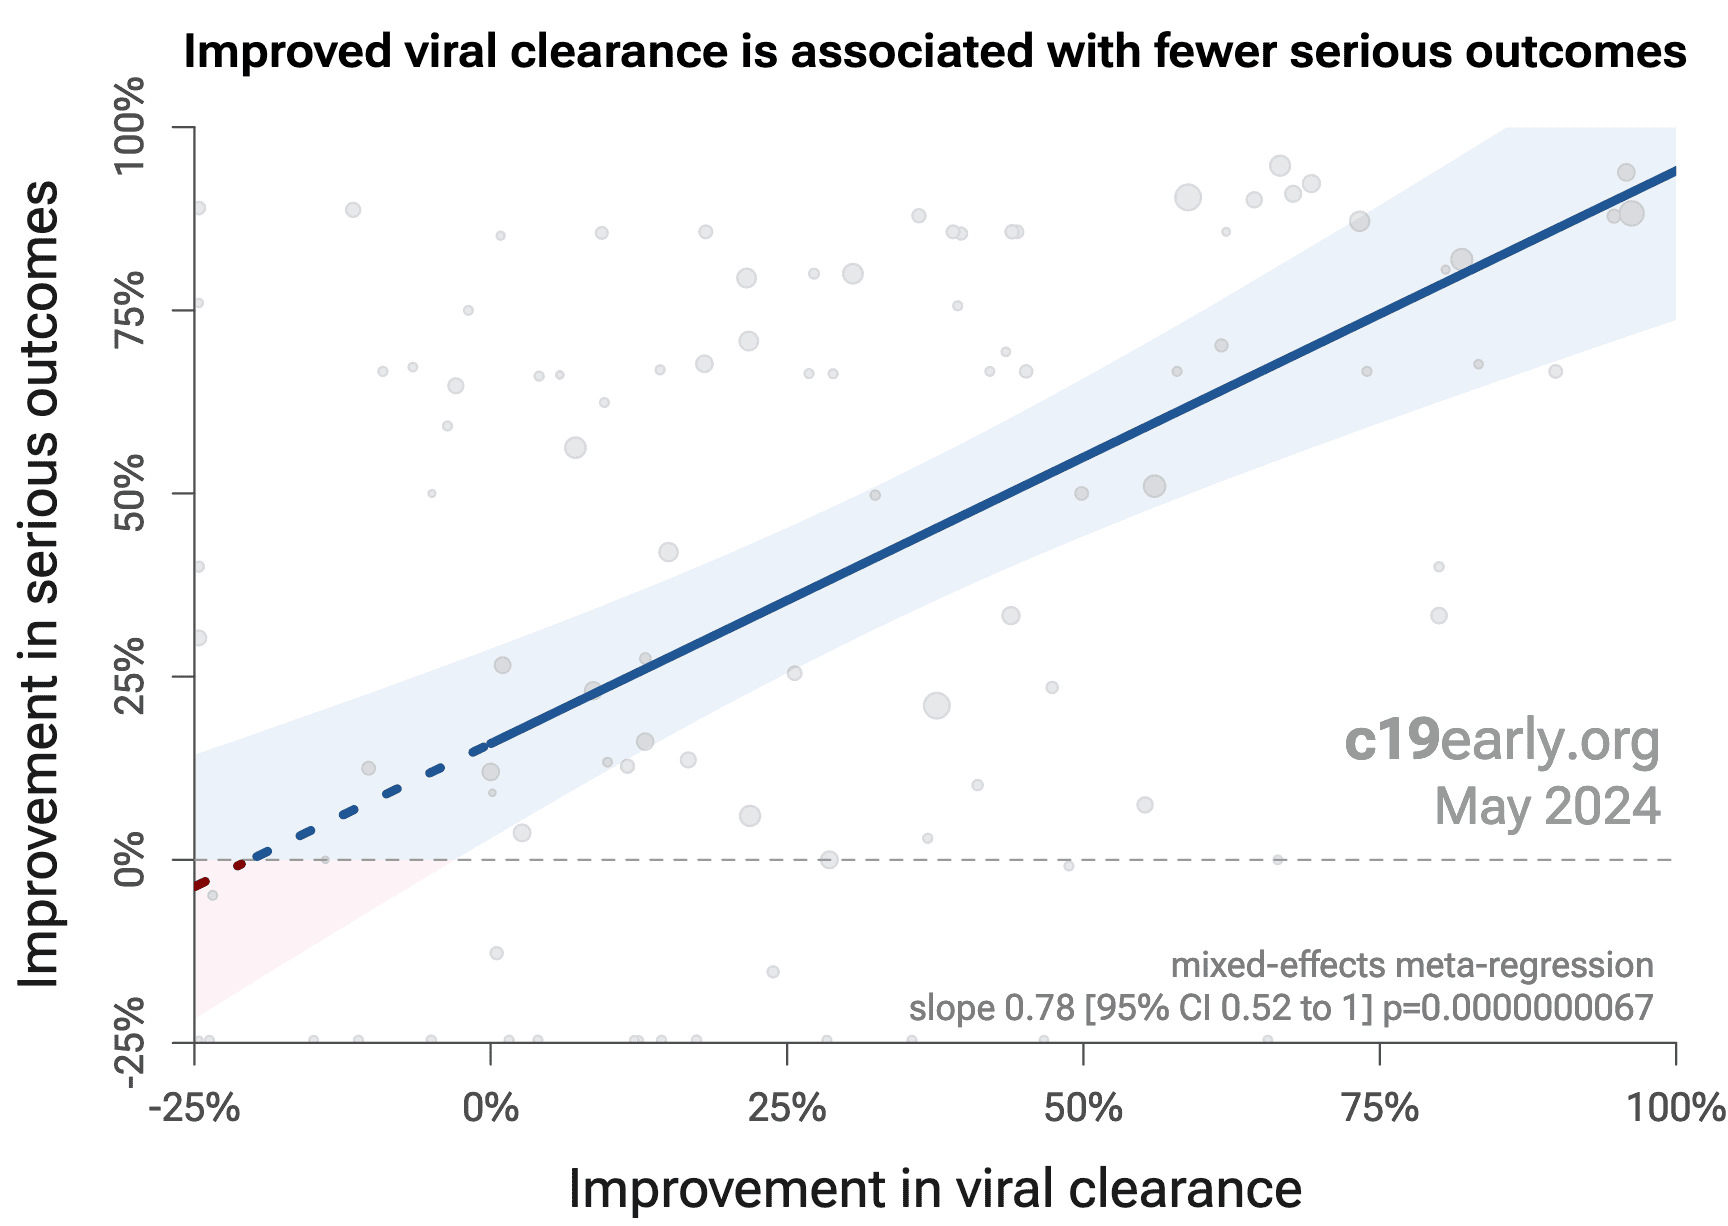
Fig. 22 shows that improved viral clearance is strongly associated
with fewer serious outcomes. The association is very similar to
Singh et al., with higher confidence due to the larger number of
studies. As with Singh et al., the confidence increases
when excluding the outlier treatment, from p = 0.000000011 to p = 0.00000000032.
Fig. 20. Lower hospitalization is associated with lower mortality, supporting pooled outcome analysis.
Fig. 21. Improved recovery is associated with lower mortality, supporting pooled outcome analysis.
Fig. 20. Improved viral clearance is associated with fewer serious outcomes, supporting pooled outcome analysis.
Currently, 59 of the treatments we analyze show statistically significant efficacy or harm, defined as ≥10% decreased risk or >0% increased risk from ≥3 studies. 85% of these have been confirmed with one or more specific outcomes, with a mean delay of 4.6 months. When restricting to RCTs only, 53% of treatments showing statistically significant efficacy/harm with pooled effects have been confirmed with one or more specific outcomes, with a mean delay of 7.4 months.
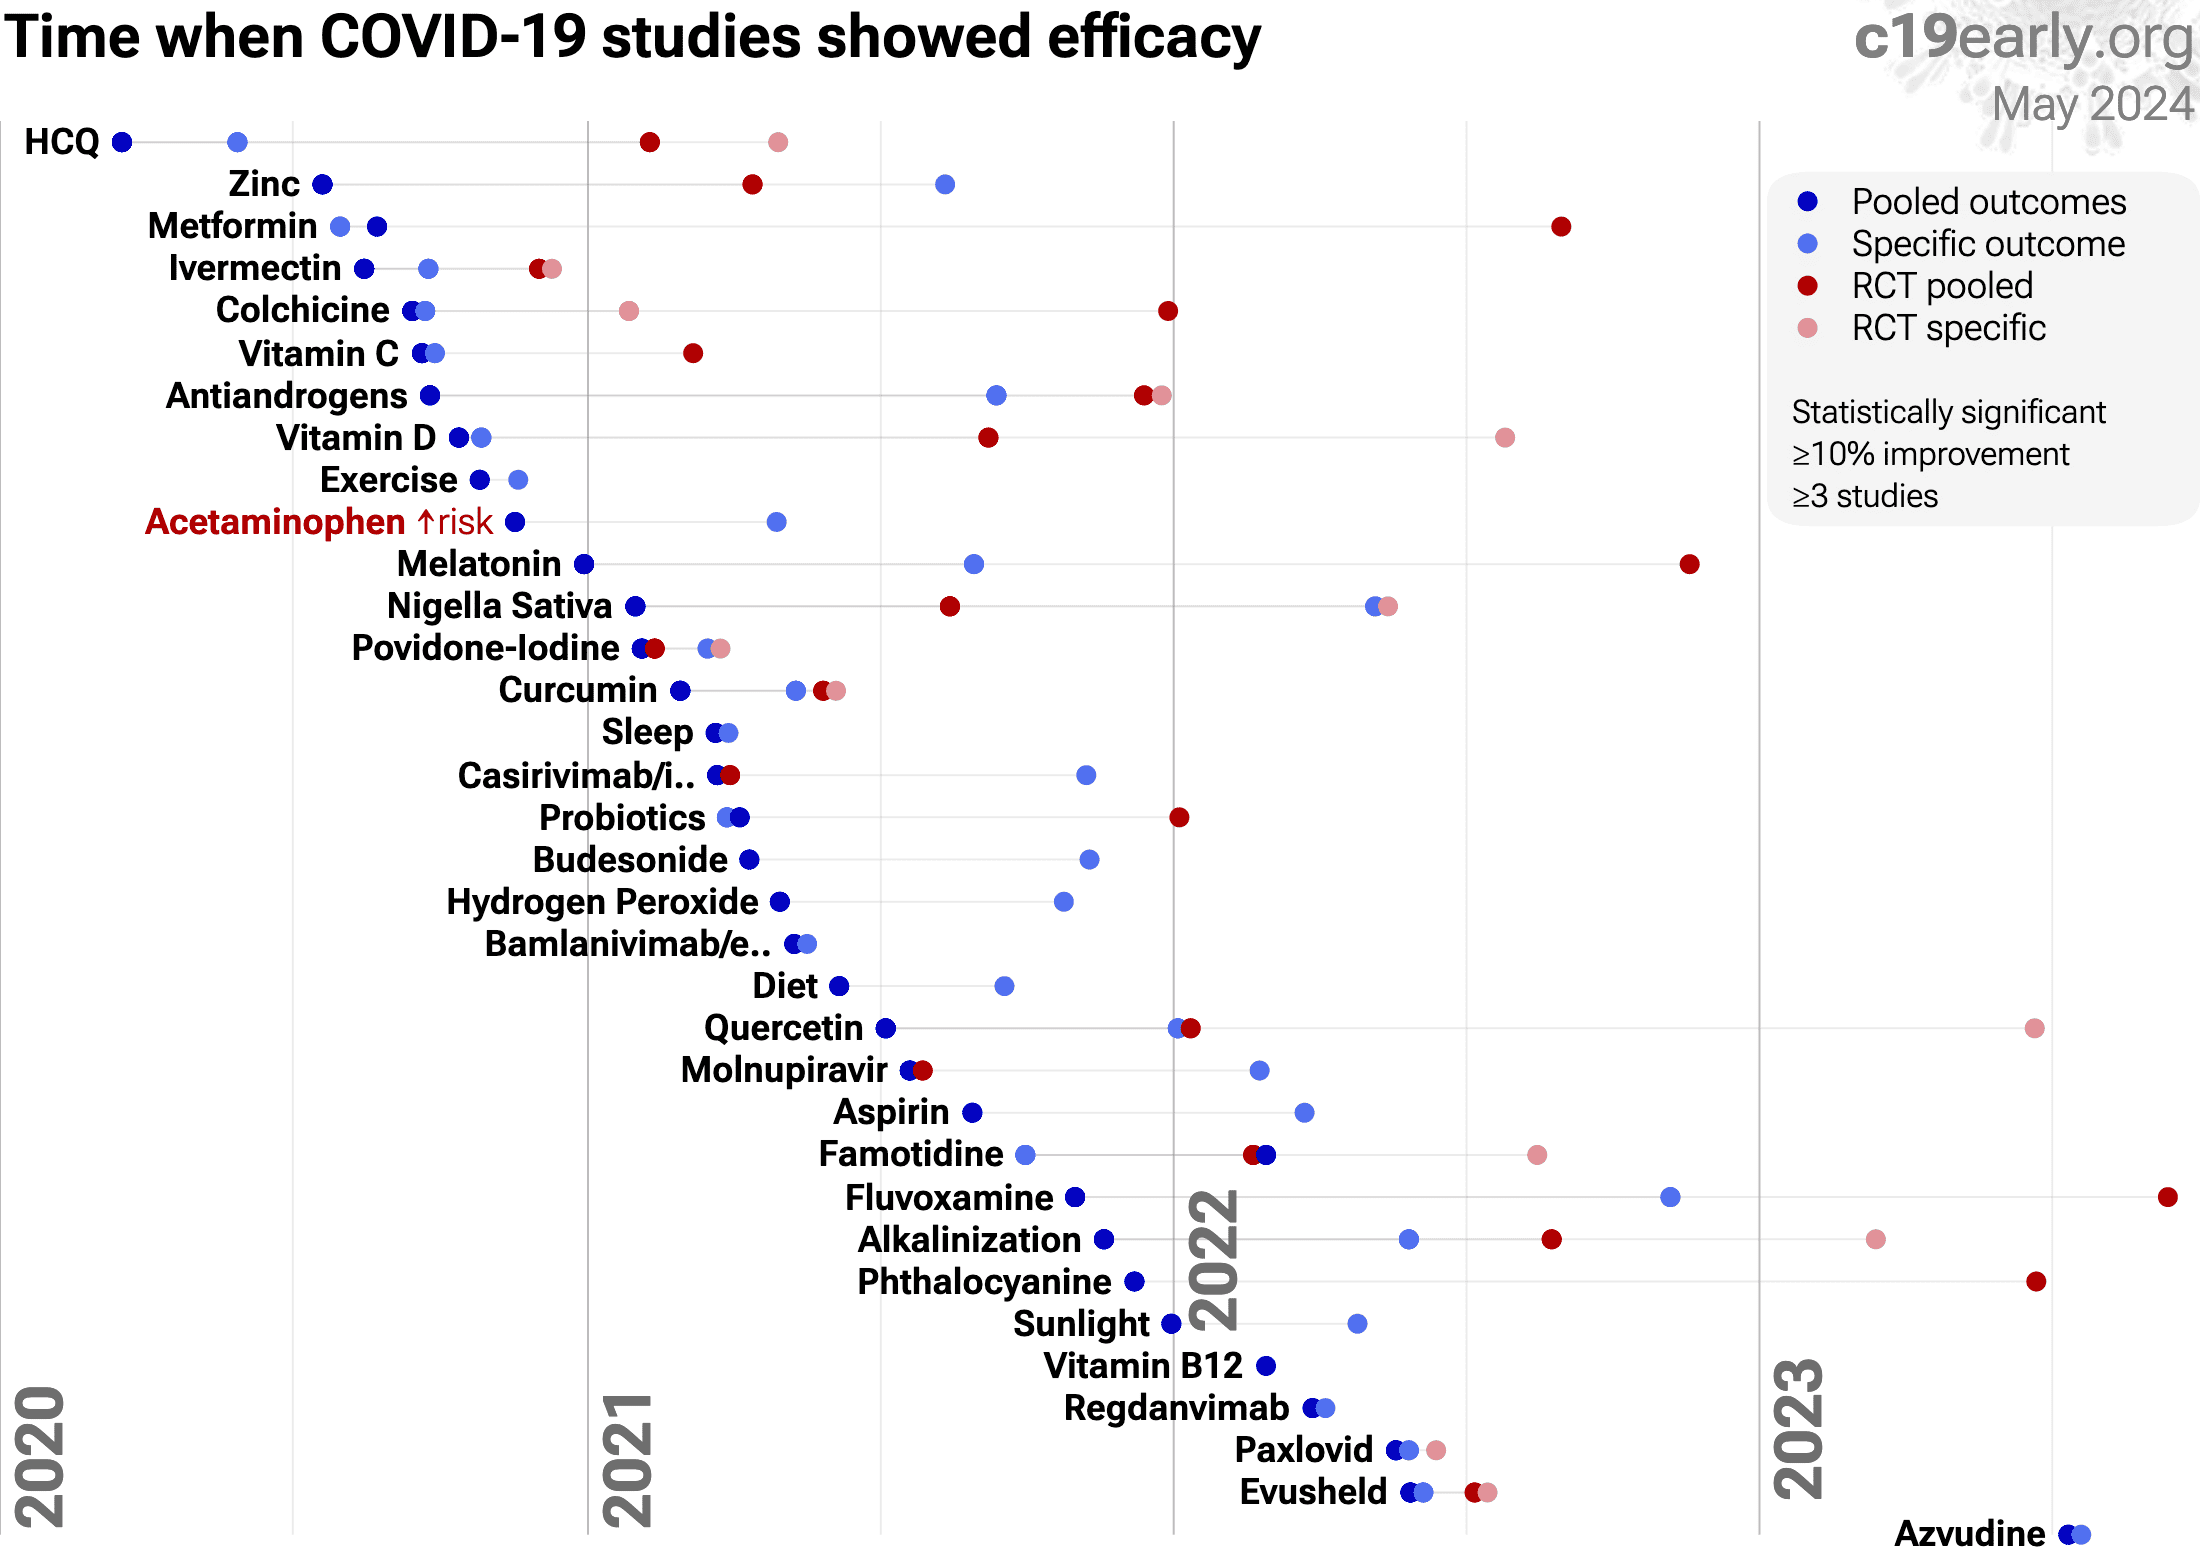
Fig. 23 shows when treatments were found effective during the
pandemic. Pooled outcomes often resulted in earlier detection of efficacy.
Fig. 23. The time when studies showed that
treatments were effective, defined as statistically significant improvement of
≥10% from ≥3 studies.
Pooled results typically show efficacy earlier than specific
outcome results. Results from all studies often shows efficacy much earlier
than when restricting to RCTs.
Results reflect conditions as used in trials to date, these depend on the
population treated, treatment delay, and treatment regimen.
Pooled analysis could hide efficacy, for example a treatment that is
beneficial for late stage patients but has no effect on viral clearance may
show no efficacy if most studies only examine viral clearance. In practice, it
is rare for a non-antiviral treatment to report viral clearance and to not
report clinical outcomes; and in practice other sources of heterogeneity such
as differences in treatment delay are more likely to hide efficacy.
Analysis validates the use of pooled effects and shows significantly faster
detection of efficacy on average.
However, as with all meta-analyses, it is important to review the different
studies included. We also present individual outcome analyses, which may be
more informative for specific use cases.
Publishing is often biased
towards positive results. Trials with patented drugs may have a financial conflict of interest that
results in positive studies being more likely to be published, or bias towards more positive results. For example with molnupiravir, trials with negative results remain unpublished to
date (CTRI/2021/05/033864 and CTRI/2021/08/0354242).
For lopinavir/ritonavir, there is currently not
enough data to evaluate publication bias with high confidence.
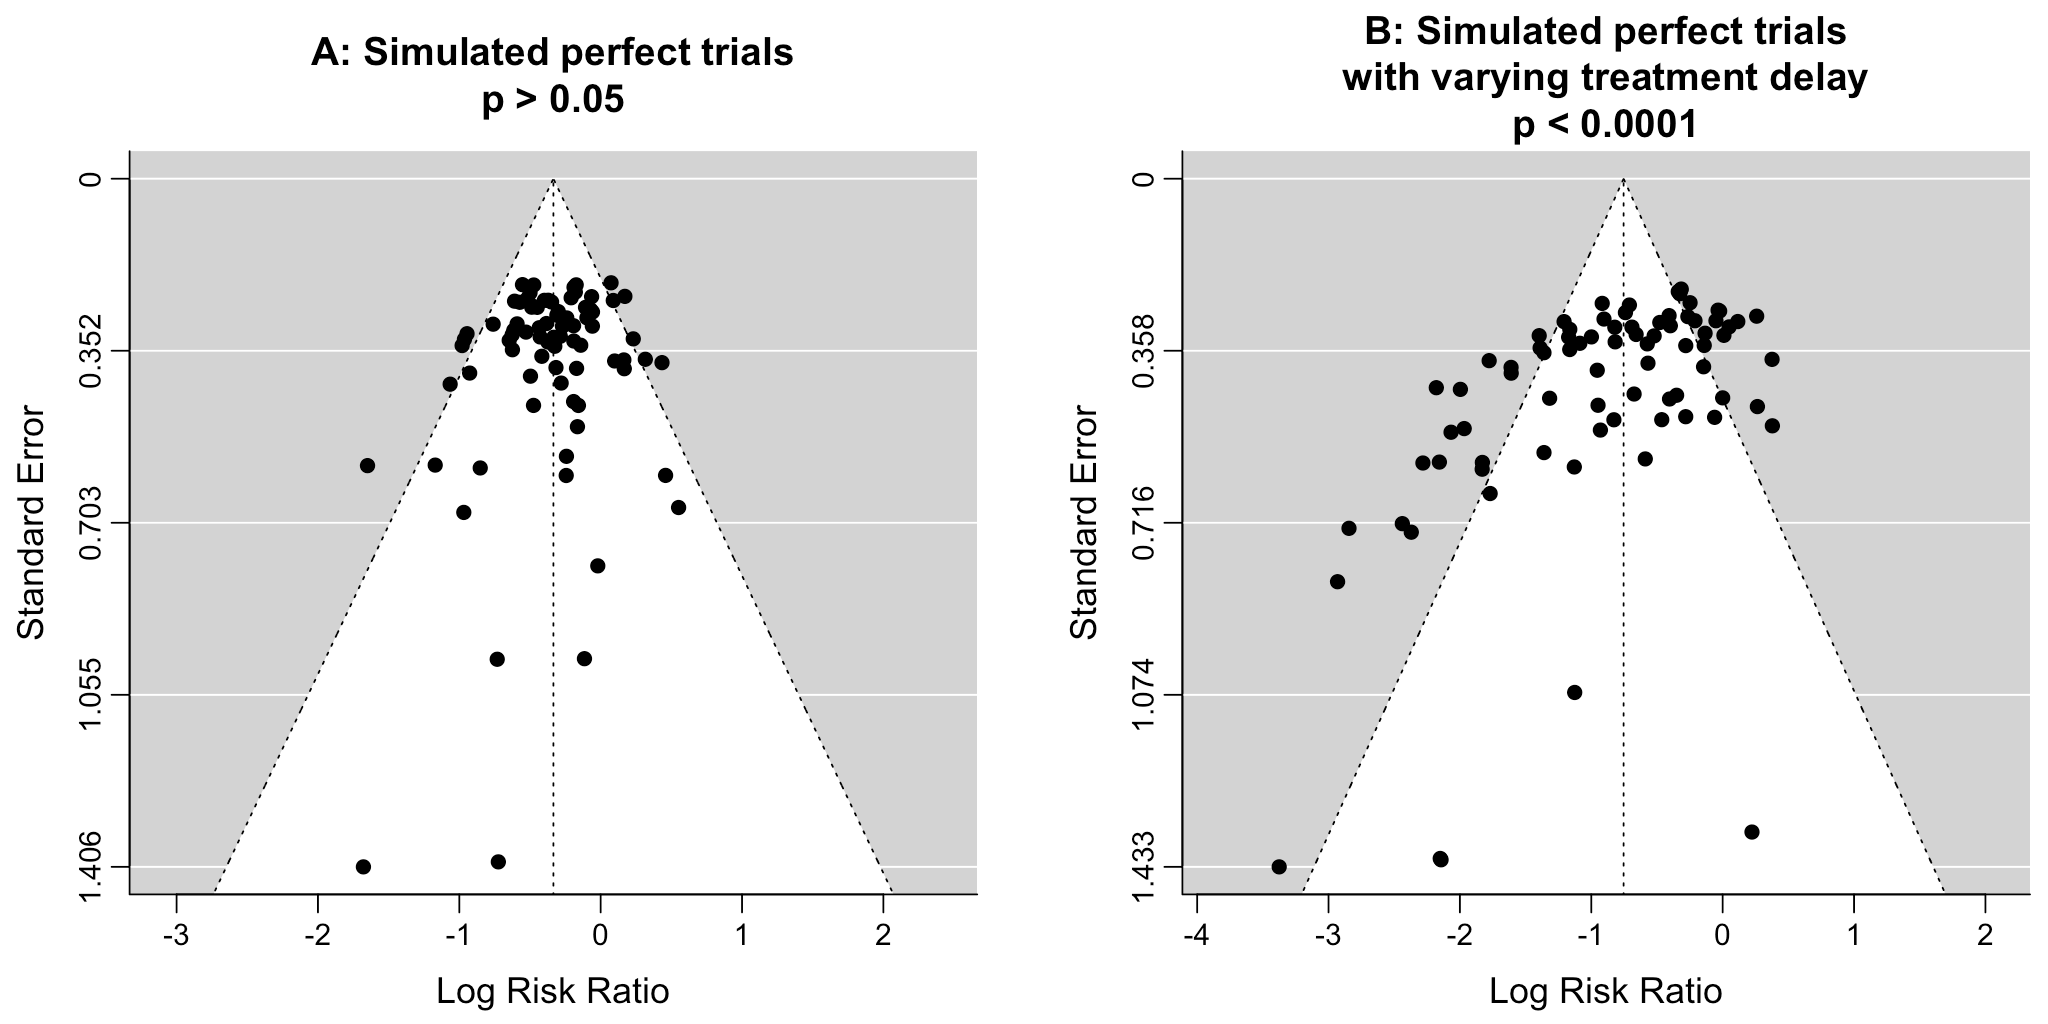
Funnel
plots have traditionally been used for analyzing publication bias. This is
invalid for COVID-19 acute treatment trials — the underlying assumptions
are invalid, which we can demonstrate with a simple example. Consider a set of
hypothetical perfect trials with no bias. Fig. 24 plot A
shows a funnel plot for a simulation of 80 perfect trials, with random group
sizes, and each patient's outcome randomly sampled (10% control event
probability, and a 30% effect size for treatment). Analysis shows no asymmetry
(p > 0.05). In plot B, we add a single typical variation in COVID-19 treatment
trials — treatment delay. Consider that efficacy varies from 90% for
treatment within 24 hours, reducing to 10% when treatment is delayed 3 days.
In plot B, each trial's treatment delay is randomly selected. Analysis now
shows highly significant asymmetry, p < 0.0001, with six variants of
Egger's test all showing p < 0.0591-98.
Note that these tests fail even though treatment delay is uniformly
distributed. In reality treatment delay is more complex — each trial has
a different distribution of delays across patients, and the distribution
across trials may be biased (e.g., late treatment trials may be more common).
Similarly, many other variations in trials may produce asymmetry, including
dose, administration, duration of treatment, differences in SOC,
comorbidities, age, variants, and bias in design, implementation, analysis,
and reporting.
Fig. 24. Example funnel plot analysis for simulated perfect trials.
Summary statistics from
meta-analysis necessarily lose information. As with all meta-analyses, studies
are heterogeneous, with differences
in treatment delay, treatment regimen, patient demographics, variants,
conflicts of interest, standard of care, and other factors. We provide analyses for specific
outcomes and by treatment delay, and we aim to identify key characteristics in
the forest plots and summaries. Results should be viewed in the context of
study characteristics.
Some analyses classify treatment based on early or late
administration, as done here, while others distinguish between mild, moderate,
and severe cases. Viral load does not indicate degree of symptoms — for
example patients may have a high viral load while being asymptomatic. With
regard to treatments that have antiviral properties, timing of treatment is
critical — late administration may be less helpful regardless of
severity.
Details of treatment delay per patient is often not available.
For example, a study may treat 90% of patients relatively early, but the
events driving the outcome may come from 10% of patients treated very late.
Our 5 day cutoff for early treatment may be too conservative, 5 days may be too late in many cases.
Comparison across treatments is confounded by differences in
the studies performed, for example dose, variants, and conflicts of interest.
Trials with conflicts of interest may use designs better suited to the
preferred outcome.
In some cases, the most serious outcome has very few events,
resulting in lower confidence results being used in pooled analysis, however
the method is simpler and more transparent. This is less critical as the
number of studies increases. Restriction to outcomes with sufficient power may
be beneficial in pooled analysis and improve accuracy when there are few
studies, however we maintain our pre-specified method to avoid any
retrospective changes.
Studies show that combinations of treatments can be highly
synergistic and may result in many times greater efficacy than individual
treatments alone67-89.
Therefore standard of care may be critical and benefits may diminish or
disappear if standard of care does not include certain treatments.
This real-time analysis is constantly updated based on
submissions. Accuracy benefits from widespread review and submission of
updates and corrections from reviewers. Less popular treatments may receive
fewer reviews.
No treatment or intervention is 100% available and
effective for all current and future variants. Efficacy may vary significantly
with different variants and within different populations. All treatments have
potential side effects. Propensity to experience side effects may be predicted
in advance by qualified physicians. We do not provide medical advice. Before
taking any medication, consult a qualified physician who can compare all
options, provide personalized advice, and provide details of risks and
benefits based on individual medical history and situations.
1 of the 18
studies compare against other treatments, which may reduce the effect
seen.
SARS-CoV-2 infection and replication involves a complex
interplay of 500+ host and viral proteins and other
factors31-38, providing many therapeutic
targets.
Over 11,000 compounds have been predicted to reduce COVID-19
risk39, either by directly
minimizing infection or replication, by supporting immune system function, or
by minimizing secondary complications.
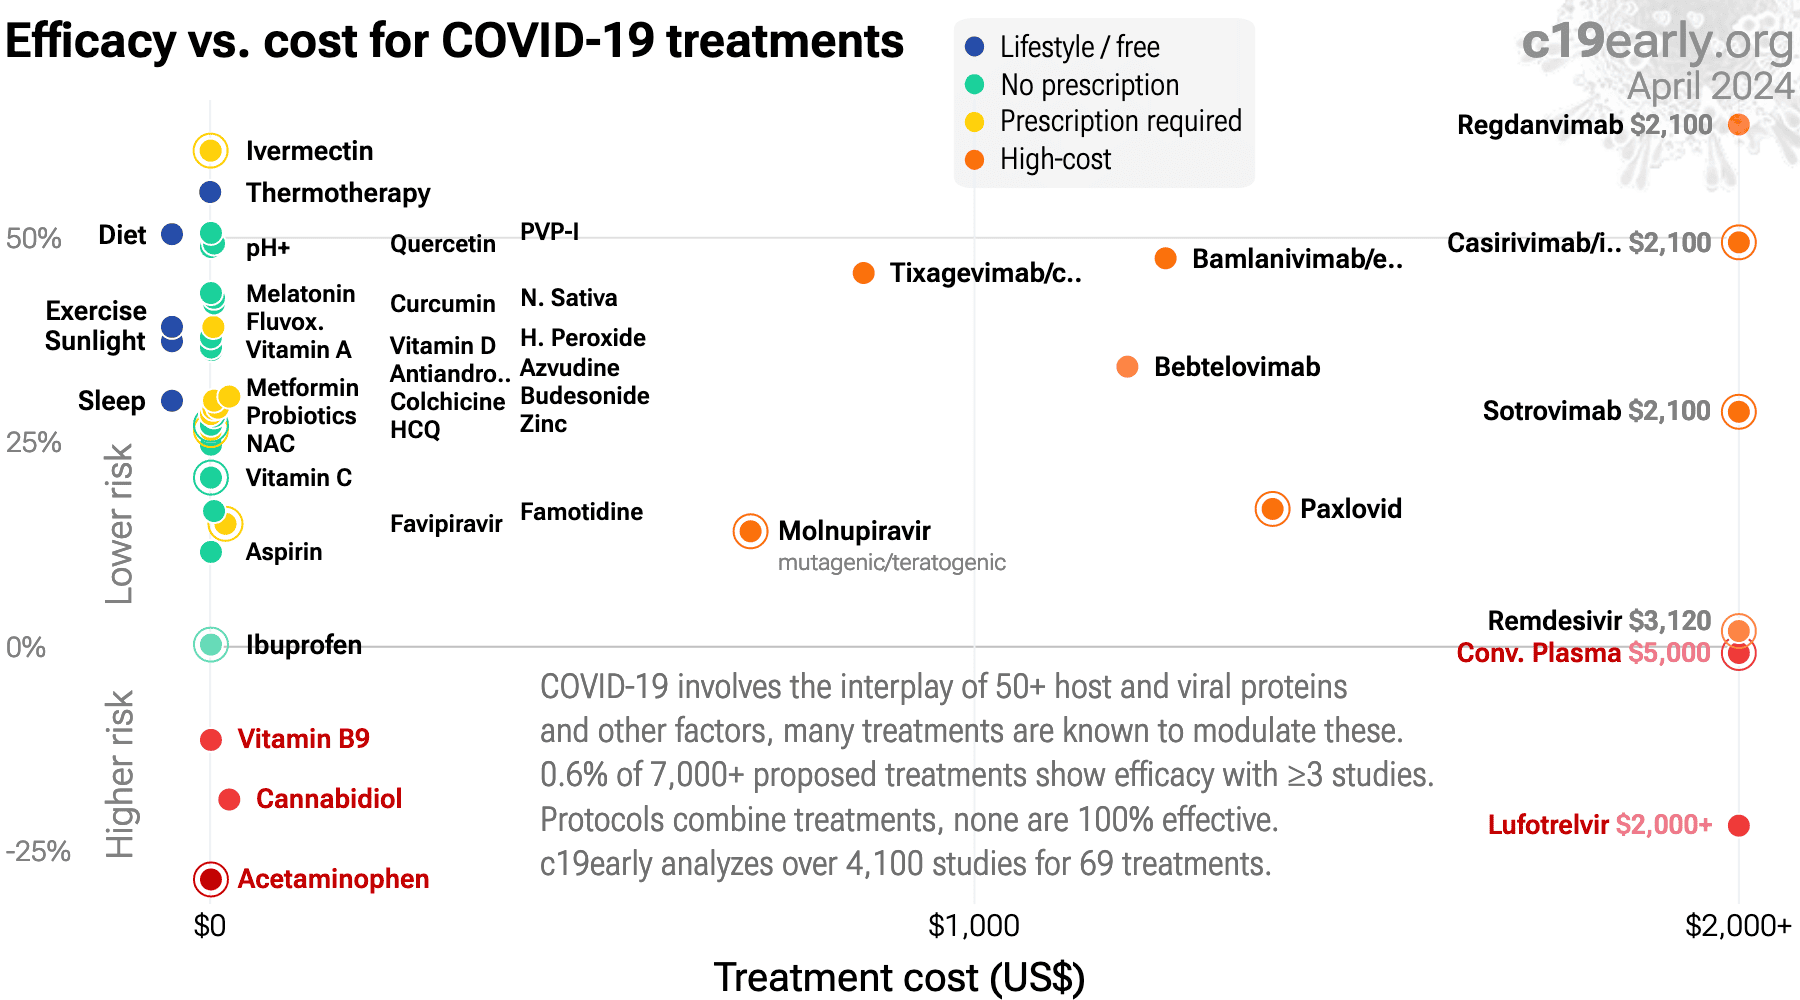
Fig. 25 shows an overview of the results for lopinavir/ritonavir
in the context of multiple COVID-19 treatments, and Fig. 26 shows a plot
of efficacy vs. cost for COVID-19 treatments.
Fig. 26. Efficacy vs. cost for COVID-19 treatments.
Meta-analysis using the most serious outcome reported shows
11% [-4‑28%] higher risk, without reaching statistical significance.
Contact.
Contact us on X at @CovidAnalysis.
Funding.
We have received no funding or
compensation in any form, and do not accept donations. This is entirely volunteer work.
Conflicts of interest.
We have no conflicts of interest.
We have no affiliation with any pharmaceutical companies, supplement companies, governments, political parties, or advocacy organizations.AI.
We use AI models (Gemini, Grok, Claude, and
ChatGPT) tasked with functioning as additional peer-reviewers to check for errors, suggest
improvements, and review spelling and grammar. Any corrections are verified and applied
manually. Our preference for em dashes is independent of AI.Updates.
Our COVID-19 meta-analyses involve the extraction of over 226,000
datapoints from thousands of papers for 226 treatments. We thank the
thousands of scientists, physicians, and other contributors that have provided updates,
suggestions, feedback, and corrections. These are all welcome and can be submitted
at https://c19early.org/lpvmeta.html.
Dedication.
This work is dedicated to top
evidence-based physicians that worked tirelessly to analyze evidence and greatly reduce
mortality and morbidity during the pandemic. In alphabetical order:
Dr. Thomas J. Borody, Dr. Mary Talley Bowden, Dr. Flavio Cadegiani, Dr. Shankara Chetty,
Dr. Ryan Cole, Dr. George Fareed, Dr. Sabine Hazan, Dr. Pierre Kory, Dr. Tess Lawrie, Dr.
Robert Malone, Dr. Paul Marik, Dr. Peter McCullough, Dr. Didier Raoult, Dr. Harvey Risch,
Dr. Jackie Stone, Dr. Brian Tyson, Dr. Joseph Varon, and Dr. Vladimir (Zev) Zelenko.
Public domain.
This is a public domain work
distributed in accordance with the Creative Commons CC0 1.0 Universal license, which
dedicates the work to the public domain by waiving all rights worldwide under copyright law.
You can distribute, remix, adapt, and build upon this work in any medium or format,
including for commercial purposes, without asking permission. Referenced material and
third-party images retain any original copyrights or restrictions.
See: https://creativecommons.org/publicdomain/zero/1.0/.
Early terminated very late stage (95% on oxygen at baseline) DISCOVERY trial showing no significant differences with lopinavir/ritonavir.
RCT 199 hospitalized COVID-19 patients showing no significant difference with lopinavir-ritonavir treatment. 28-day mortality was lower in the treatment group, without statistical significance. 3 treatment patients died within 24 hours after randomization and did not receive lopinavir-ritonavir. No significant difference was found in viral RNA load over time between the groups.
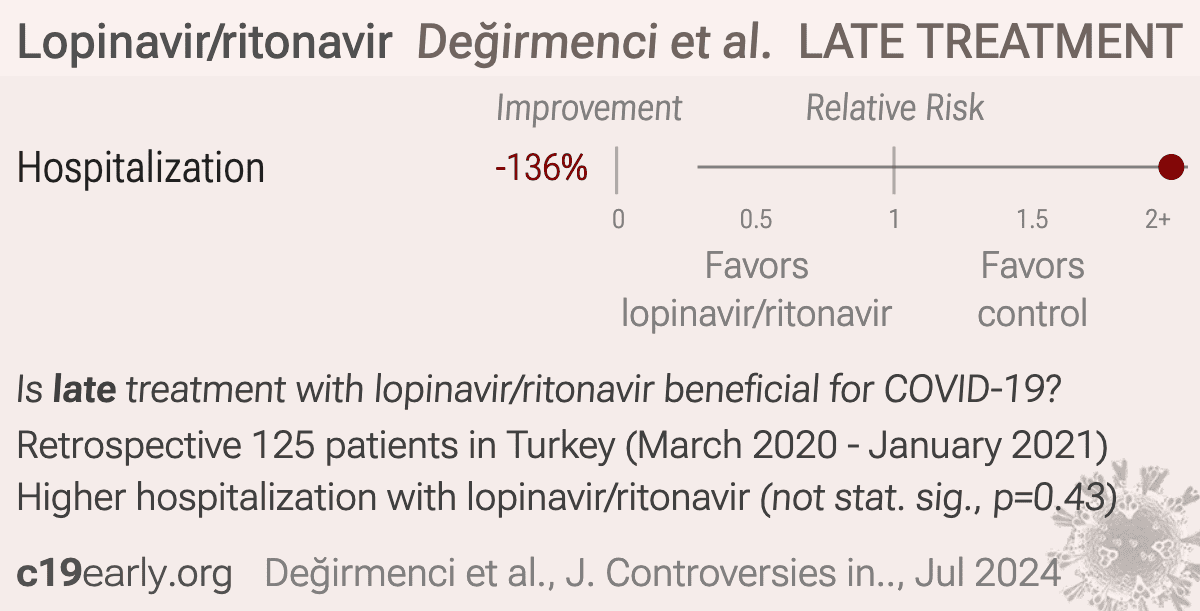
Retrospective 125 pregnant women hospitalized with COVID-19 in Turkey, showing no significant difference in hospitalization length with HCQ, and longer hospitalization with lopinavir/ritonavir use.
Retrospective 3,451 hospitalized COVID-19 patients in Italy showing higher mortality with darunavir/cobicistat.
RCT 1,616 hospitalized COVID-19 patients showing no significant differences with lopinavir-ritonavir treatment compared to usual care. 6-month results are from Horby et al.
RCT 101 mild to moderate COVID-19 patients showing no significant difference in antiviral effectiveness among three treatment regimens: ribavirin plus interferon-alpha, lopinavir/ritonavir plus interferon-alpha, and ribavirin plus lopinavir/ritonavir plus interferon-alpha.
RCT 437 non-hospitalized COVID-19 patients showing no significant differences with lopinavir/ritonavir (LPV/r) treatment.
Retrospective 1,500 hospitalized late stage (median SaO2 87.7) patients in Turkey, showing no significant difference in mortality with lopinavir/ritonavir treatment.
Open-label, cluster-randomized RCT 318 asymptomatic close contacts in Switzerland and Brazil showing no statistically significant difference in symptomatic COVID-19 at 21 days with LPV/r prophylaxis. The mid-trial changes in allocation and 10-month recruitment window introduces potential calendar-time confounding - e.g., if community incidence fell over time, this may over-represent lower-risk weeks in the LPV/r arm, thereby overestimating efficacy. Authors reports 2 hospitalizations but do not specify which group the patients were in.
RCT 86 mild/moderate COVID-19 patients showing no significant difference in outcomes with lopinavir/ritonavir or arbidol compared to control.
240 patient RCT comparing favipiravir, favipiravir + LPV/r, LPV/r, and placebo, showing improved viral clearance with favipiravir, but no significant difference for LPV/r. Efficacy was lower in the combined favipiravir + LPV/r arm, where plasma levels of favipiravir were lower. Favipiravir 1800mg twice daily on day 1 followed by 400mg four times daily on days 2-7.
Early terminated RCT in Brazil showing no significant differences with lopinavir/ritonavir treatment.
WHO SOLIDARITY open-label RCT showing no significant difference in outcomes with lopinavir/ritonavir treatment.
RCT 1,942 patients testing HCQ, lopinavir/ritonavir, nitazoxanide/ciclesonide, ivermectin/ASAQ, and fluoxetine/budesonide compared wirth paracetamol.
Paracetamol was used as a control group. Results with concurrent controls are only provided for nitazoxanide/ciclesonide. Other groups only have comparisons with the full control group. The full control group continues beyond the time of most arms, including patients at later times when COVID-19 risk was lower, therefore results may underestimate efficacy.
The nitazoxanide/ciclesonide concurrent controls are closer in time than the full group for ivermectin/ASAQ and fluoxetine/budesonide and may be a more appropriate comparison. The control group in this case shows worse results. We currently use the full control group results to be conservative.
Authors indicate that the data is available however it is not available as of May 2026.
Retrospective 178 hospitalized COVID-19 patients in China
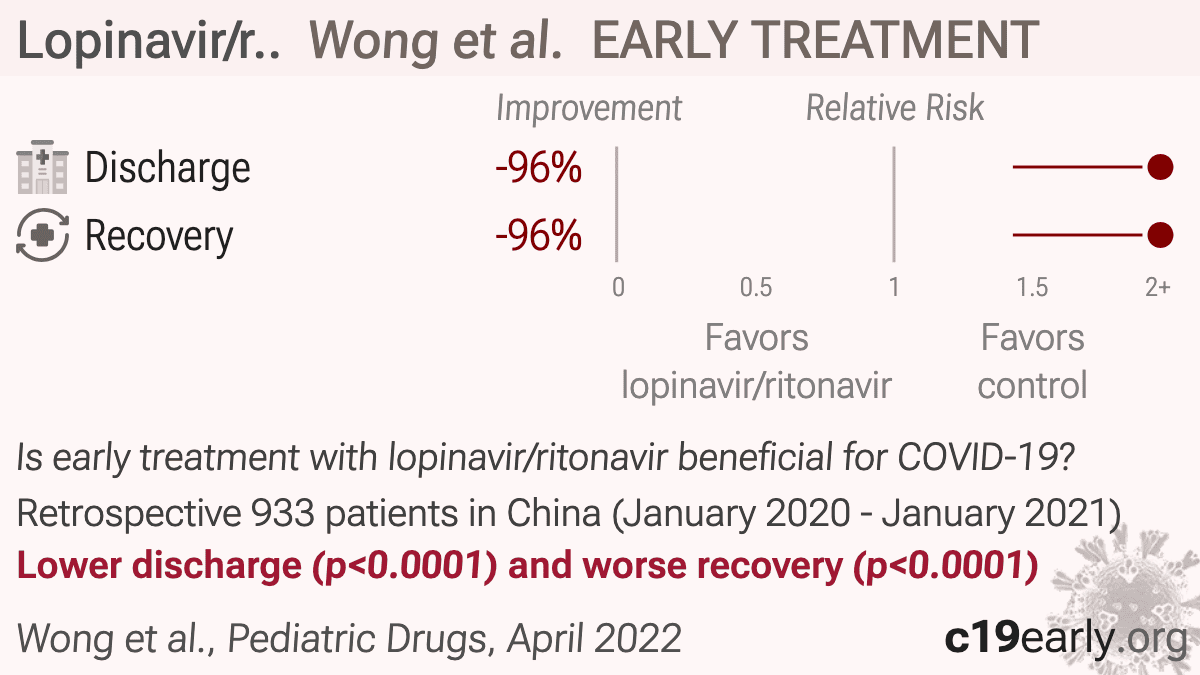
Retrospective 933 pediatric COVID-19 patients in Hong Kong showing worse outcomes with early lopinavir/ritonavir (LPV/r) use.
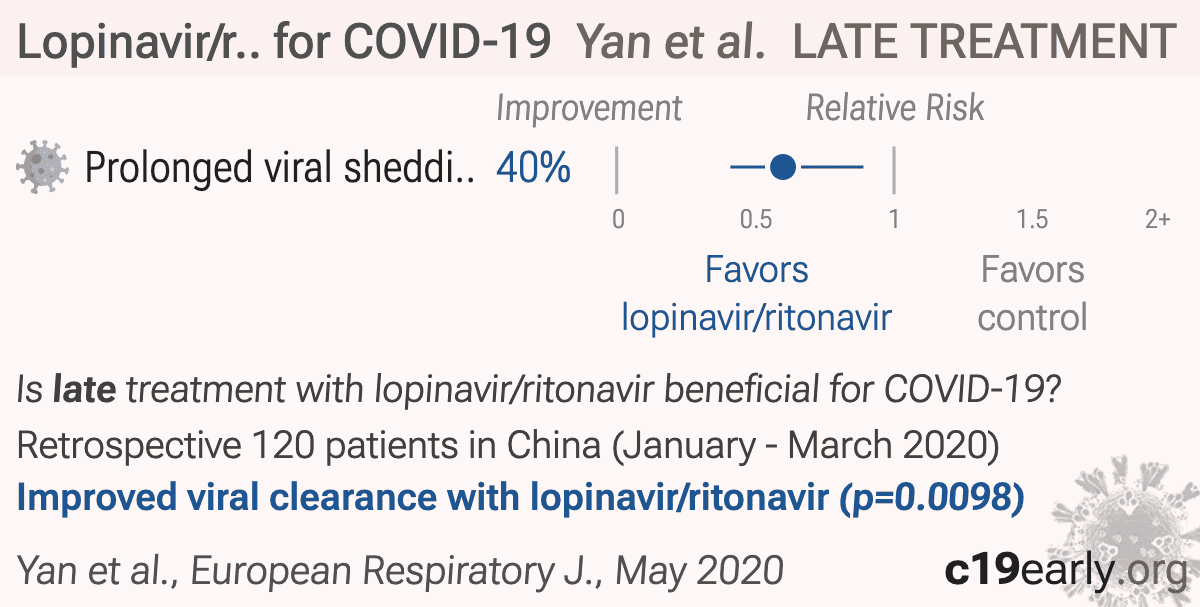
Retrospective 120 hospitalized non-critically ill COVID-19 patients showing that early administration of lopinavir/ritonavir was associated with shorter duration of SARS-CoV-2 RNA shedding.
Retrospective 191 hospitalized COVID-19 patients in China showing no significant difference in viral clearance with lopinavir/ritonavir.
We perform ongoing searches of PubMed, medRxiv, Europe PMC, ClinicalTrials.gov, The Cochrane
Library, Google Scholar, Research Square, ScienceDirect, Oxford University Press, the
reference lists of other studies and meta-analyses, and submissions to the site c19early.org, which regularly receives notification of studies upon
publication.
Search terms are lopinavir/ritonavir and COVID-19 or SARS-CoV-2. Automated searches are performed twice daily, with all matches reviewed for inclusion.
All studies regarding the use of lopinavir/ritonavir for COVID-19 that report a comparison with a
control group are included in the main analysis.
Sensitivity analysis is performed, excluding studies with major issues, epidemiological
studies, and studies with minimal available information.
Studies with major unexplained data issues, for example major outcome data that is
impossible to be correct with no response from the authors, are excluded.

Fig. 27.
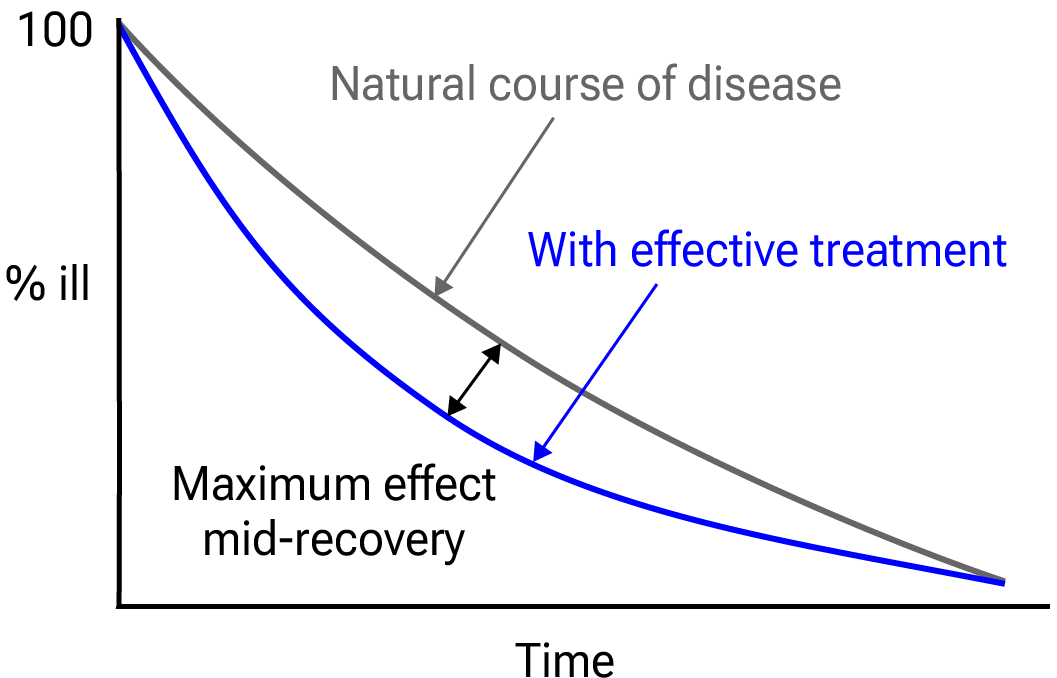
Mid-recovery results can more accurately reflect efficacy when almost all patients
recover. Mateja et al. confirm that intermediate viral load results more accurately
reflect hospitalization/death.
We extracted effect sizes and associated data from all studies. If studies report multiple
kinds of effects then the most serious outcome is used in pooled analysis, while
other outcomes are included in the outcome-specific analyses. For example, if effects for
mortality and cases are reported then they are both used in specific outcome analyses,
while mortality is used for pooled analysis.
If symptomatic results are reported at multiple times, we use the latest time, for example
if mortality results are provided at 14 days and 28 days, the results at 28 days have
preference. Mortality alone is preferred over combined outcomes.
Outcomes with zero events in both arms are not used, the next most serious outcome with
one or more events is used. For example, in low-risk populations with no mortality, a
reduction in mortality with treatment is not possible, however a reduction in
hospitalization, for example, is still valuable.
Clinical outcomes are considered more important than viral outcomes.
When basically all patients recover in both treatment and control groups, preference for
viral clearance and recovery is given to results mid-recovery where available. After most
or all patients have recovered there is little or no room for an effective treatment to do
better, however faster recovery is valuable.
An IPD meta-analysis confirms that intermediate viral load reduction is more closely
associated with hospitalization/death than later viral load reduction101.
If only individual symptom data is available, the most serious symptom has
priority, for example difficulty breathing or low SpO2 is more
important than cough.
Forest plots are computed using PythonMeta102 with the DerSimonian and
Laird random-effects model (the fixed effect assumption is not plausible in this case) and
inverse variance weighting.
Results are presented with 95% confidence intervals. Heterogeneity among studies was
assessed using the I2 statistic.
When results provide an odds ratio, we compute the relative risk when possible, or convert
to a relative risk according to Zhang et al.
Reported confidence intervals and p-values are used when available, and adjusted
values are used when provided. If multiple types of adjustments are reported propensity
score matching and multivariable regression has preference over propensity score matching
or weighting, which has preference over multivariable regression. Adjusted results have
preference over unadjusted results for a more serious outcome when the adjustments
significantly alter results.
When needed, conversion between reported p-values and confidence intervals followed
Altman, Altman (B), and Fisher's exact test was used to calculate
p-values for event data. If continuity correction for zero values is required, we
use the reciprocal of the opposite arm with the sum of the correction factors equal to
1106.
Results are expressed with RR < 1.0 favoring treatment, and using the risk of a negative
outcome when applicable (for example, the risk of death rather than the risk of survival).
If studies only report relative continuous values such as relative times, the ratio of the
time for the treatment group versus the time for the control group is used. Calculations
are done in Python (3.14.6) with
scipy (1.18.0), pythonmeta (1.26), numpy (2.5.1), statsmodels (0.14.6), and plotly (6.9.0).
Mixed-effects meta-regression results are computed with R (4.4.0) using the metafor
(4.6-0) and rms (6.8-0) packages, and using the most serious sufficiently powered outcome.
For all statistical tests, a p-value less than 0.05 was considered statistically
significant.
Grobid 0.8.2 is used to parse PDF documents.
When evaluating potential effect modification across groups, we use an
interaction test as described by Altman (C) et al. We compared the log-transformed
relative risks using a z-test, deriving the standard error of the difference from
the 95% confidence intervals. A two-sided interaction p-value of < 0.05 was
considered a statistically significant difference in treatment effect between the
groups.
Cochrane RoB 2/ROBINS-I are often used to evaluate studies, and have the advantage of
providing standardized rules that can be applied with minimal understanding of the domain
and study. However, the rules do not account for many real-world issues, often
overemphasize or underemphasize others, and studies show low inter-rater
reliability114.
Certain domains are more applicable for these tools, however the time-sensitive nature of
a pandemic, with significant mortality for every day of delay in evidence assessment, and
the characteristics of COVID-19 make them inappropriate for this domain.
This can be demonstrated with examples where expert RoB 2/ROBINS-I ratings do not match
reality for COVID-19. Popp et al. use RoB 2 to classify Reis et al. as low
risk of bias, however this is the opposite of reality—the trial not only has very
high risk of bias, but has very high actual known bias, refusing to release data despite
pledging to, reporting multiple impossible numbers, having blinding and randomization
failure, and many other issues116.
Axfors et al. use RoB 2 to classify Horby (B) et al. as low risk of bias, however
this is the opposite of reality—the very late treatment and excessive dosage used
produces results with no relevance to recommended usage.
HCQ shows poor results with
late treatment and excessive dosage, and the combination shows harmB.
Hempenius et al. use ROBINS-I to classify 33 studies for HCQ. The two rated as having
the lowest risk of bias112,113 are far from the most informative. Both
involve very late treatment, providing no information on recommended usage, and ROBINS-I
does a very poor job of accounting for the impact of confounding factorsC.
Our quality evaluation focuses on known issues and bias, and the potential
impact on outcomes, rather than just the risk of bias.
The estimated potential impact of each confounding factor, and the direction of the impact
is considered. For example, consider a study that shows significantly lower risk, the
value of the study varies significantly if confounding points to an underestimate or an
overestimate of efficacy. In one case, the real effect may be null, while the other case
provides stronger evidence of efficacy (which may be greater than the study shows).
Analysis focusing on the risk of bias, while simpler, may penalize studies for theoretical
or technical issues that have no or minimal impact on outcomes. Analysis also depends on
the outcome, for example certain issues are less relevant for objective outcomes such as
mortality.
Inaccurate penalization, and inaccurate high-quality evaluation in the face of known major
issues affecting outcomes, increases in significance during a pandemic when immediate
recognition of new evidence is critical, and when considering all global studies, as
required during a pandemic. Investigators in other countries may have different customs
for design, analysis, and reporting, and different English language skills, however they
may not be less diligent or have greater bias.
Investigators in lower-pharmaceutical-profit countries may have lower bias towards
profitable interventions.
We have classified studies as
early treatment if most patients are not already at a severe stage at the time of
treatment (for example based on oxygen status or lung involvement), and treatment started
within 5 days of the onset of symptoms. If studies contain a mix of early treatment and
late treatment patients, we consider the treatment time of patients contributing most to
the events (for example, consider a study where most patients are treated early but late
treatment patients are included, and all mortality events were observed with late
treatment patients).
We note that a shorter time may be preferable. Antivirals are typically only considered
effective when used within a shorter timeframe, for example 0-36 or 0-48 hours for
oseltamivir, with longer delays not being effective52,53.
This is a living analysis and is updated regularly.
We received no funding, this research is done in our spare time.
We have no affiliation with any pharmaceutical companies, supplement companies, governments, political parties, or advocacy organizations.
A summary of study results is below. Please submit
updates and corrections at https://c19early.org/lpvmeta.html.
Effect extraction follows pre-specified rules as detailed above
and gives priority to more serious outcomes.
For pooled analyses, the first (most serious) outcome is used, which may
differ from the effect a paper focuses on.
Other outcomes are used in outcome specific analyses.
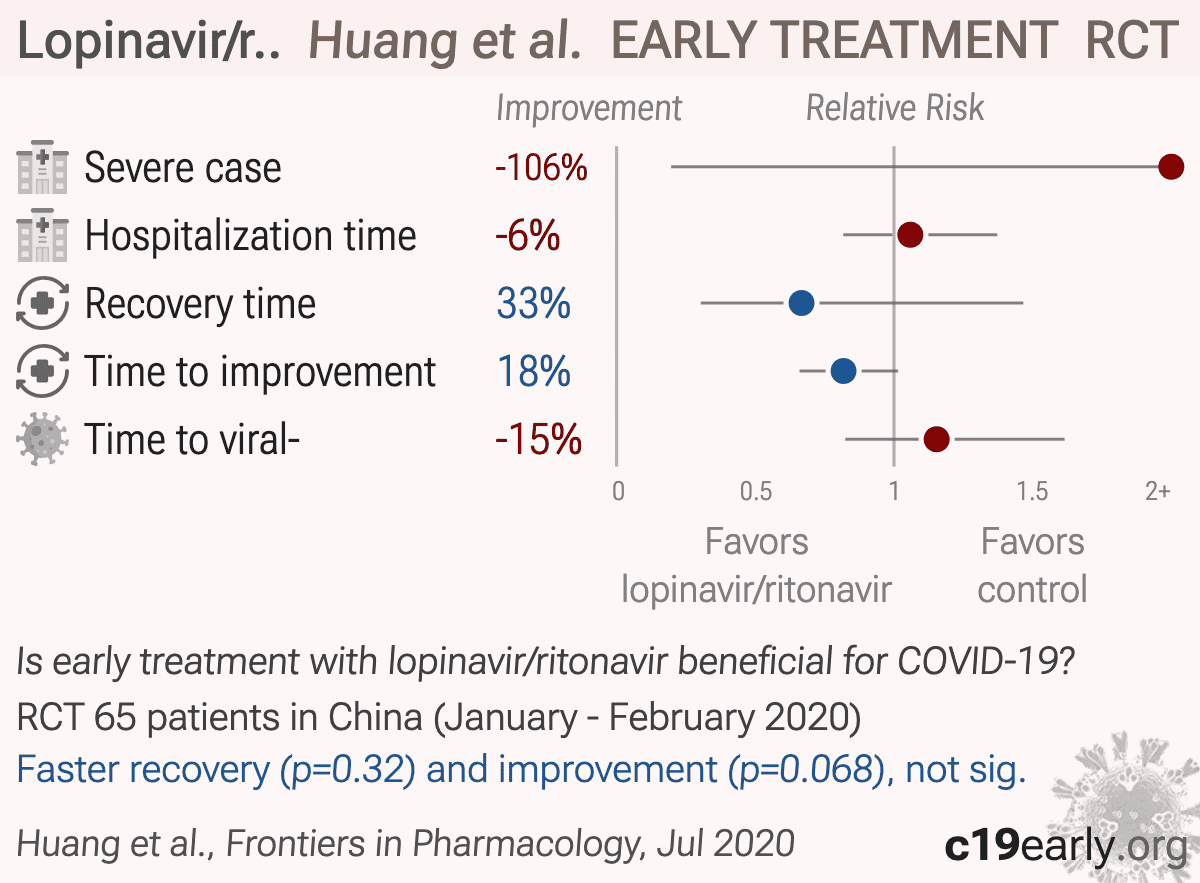
| Huang, 7/14/2020, Randomized Controlled Trial, China, peer-reviewed, mean age 42.5, 15 authors, study period 29 January, 2020 - 25 February, 2020, trial ChiCTR2000029387. | risk of severe case, 106.2% higher, RR 2.06, p = 0.61, treatment 2 of 32 (6.2%), control 1 of 33 (3.0%), RBV plus LPV/r plus IFN-a vs. RBV plus IFN-a. |
| hospitalization time, 5.9% higher, relative time 1.06, p = 0.68, treatment median 18.0 IQR 9.0 n=32, control median 17.0 IQR 16.0 n=33, RBV plus LPV/r plus IFN-a vs. RBV plus IFN-a. | |
| recovery time, 33.3% lower, relative time 0.67, p = 0.32, treatment median 3.0 IQR 6.5 n=16, control median 4.5 IQR 5.5 n=20, RBV plus LPV/r plus IFN-a vs. RBV plus IFN-a, fever. | |
| time to improvement, 18.2% lower, relative time 0.82, p = 0.07, treatment median 9.0 IQR 5.0 n=29, control median 11.0 IQR 6.0 n=29, RBV plus LPV/r plus IFN-a vs. RBV plus IFN-a. | |
| time to viral-, 15.4% higher, relative time 1.15, p = 0.41, treatment median 15.0 IQR 8.5 n=32, control median 13.0 IQR 16.5 n=33, RBV plus LPV/r plus IFN-a vs. RBV plus IFN-a. | |
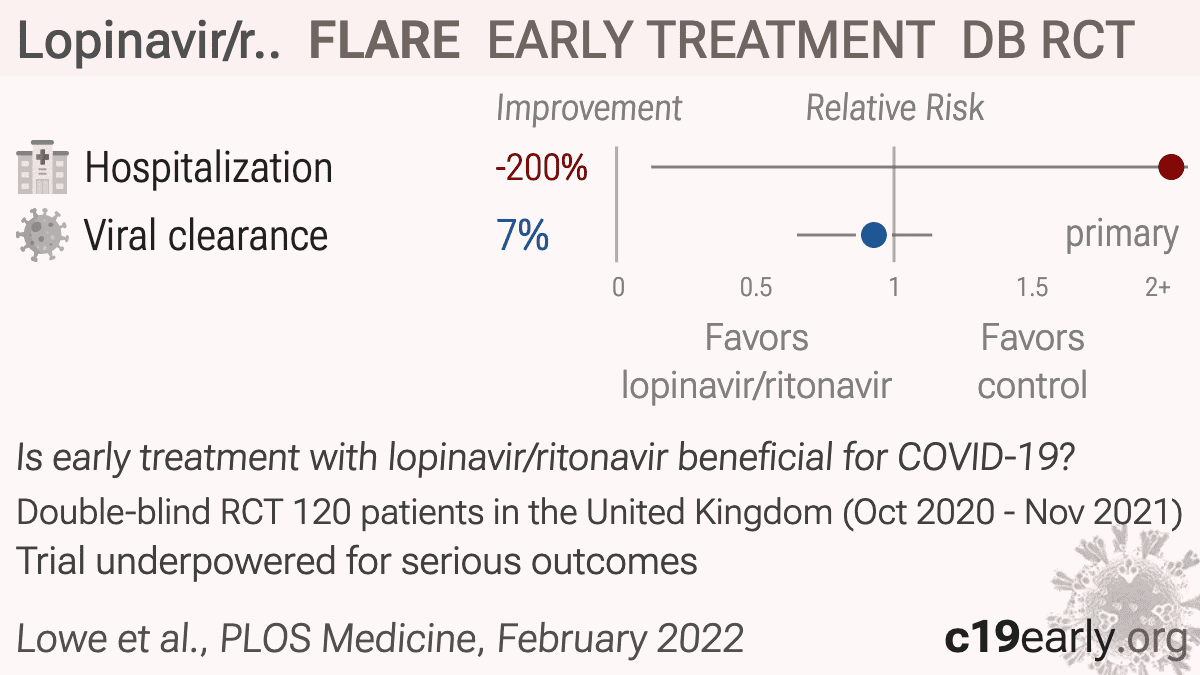
| Lowe, 2/15/2022, Double Blind Randomized Controlled Trial, placebo-controlled, United Kingdom, peer-reviewed, 18 authors, study period 6 October, 2020 - 4 November, 2021, trial NCT04499677 (history) (FLARE). | risk of hospitalization, 200.0% higher, RR 3.00, p = 1.00, treatment 1 of 60 (1.7%), control 0 of 60 (0.0%), continuity correction due to zero event (with reciprocal of the contrasting arm). |
| risk of no viral clearance, 7.2% lower, RR 0.93, p = 0.56, treatment 39 of 54 (72.2%), control 38 of 52 (73.1%), NNT 117, inverted to make RR<1 favor treatment, odds ratio converted to relative risk, day 5, primary outcome. | |
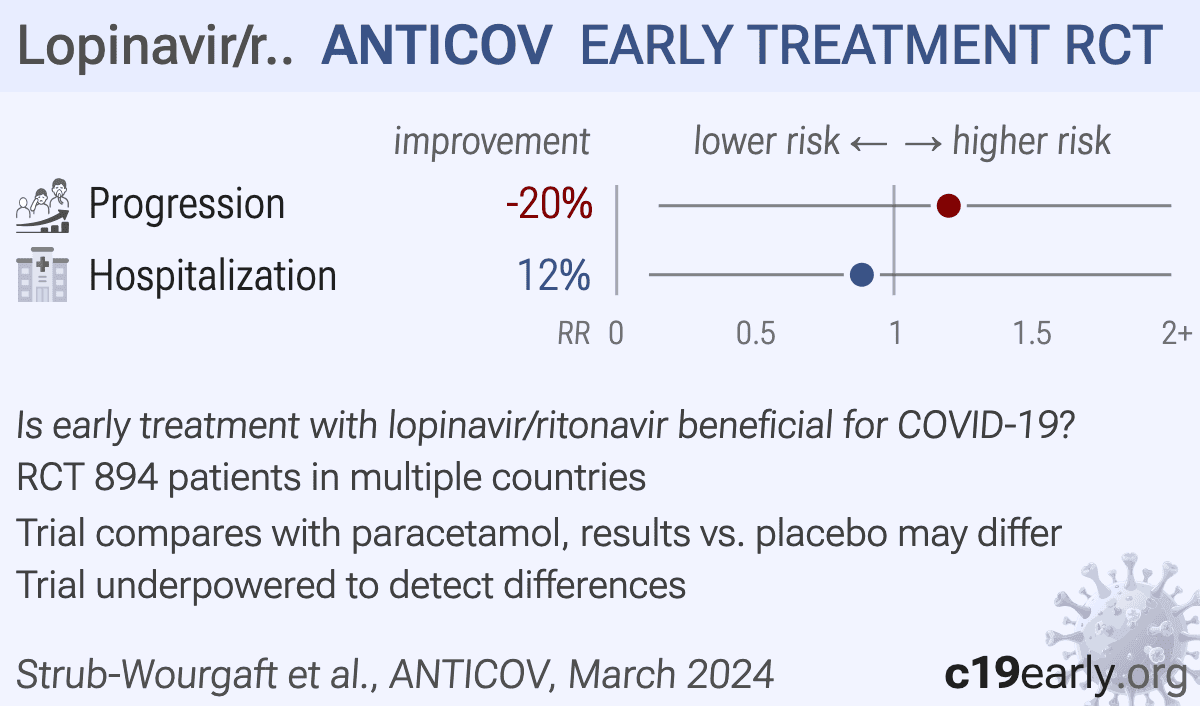
| Strub-Wourgaft, 3/28/2024, Randomized Controlled Trial, multiple countries, preprint, 12 authors, this trial compares with another treatment - results may be better when compared to placebo, ANTICOV trial, excluded in exclusion analyses: significant confounding by time possible. | risk of progression, 19.7% higher, RR 1.20, p = 0.87, treatment 1 of 77 (1.3%), control 9 of 817 (1.1%), odds ratio converted to relative risk, SpO2 ≤93 or death, day 21, Table 14.2.2.1. |
| risk of hospitalization, 11.6% lower, RR 0.88, p = 1.00, treatment 1 of 77 (1.3%), control 12 of 817 (1.5%), NNT 588, COVID-19 hospitalization, day 21, Table 14.2.2.13. | |
| Wong, 4/16/2022, retrospective, China, peer-reviewed, 11 authors, study period 21 January, 2020 - 31 January, 2021. | risk of no hospital discharge, 96.1% higher, HR 1.96, p < 0.001, treatment 49, control 884, inverted to make HR<1 favor treatment, propensity score weighting. |
| risk of no recovery, 96.1% higher, HR 1.96, p < 0.001, treatment 49, control 884, inverted to make HR<1 favor treatment, propensity score weighting. |
Effect extraction follows pre-specified rules as detailed above
and gives priority to more serious outcomes.
For pooled analyses, the first (most serious) outcome is used, which may
differ from the effect a paper focuses on.
Other outcomes are used in outcome specific analyses.
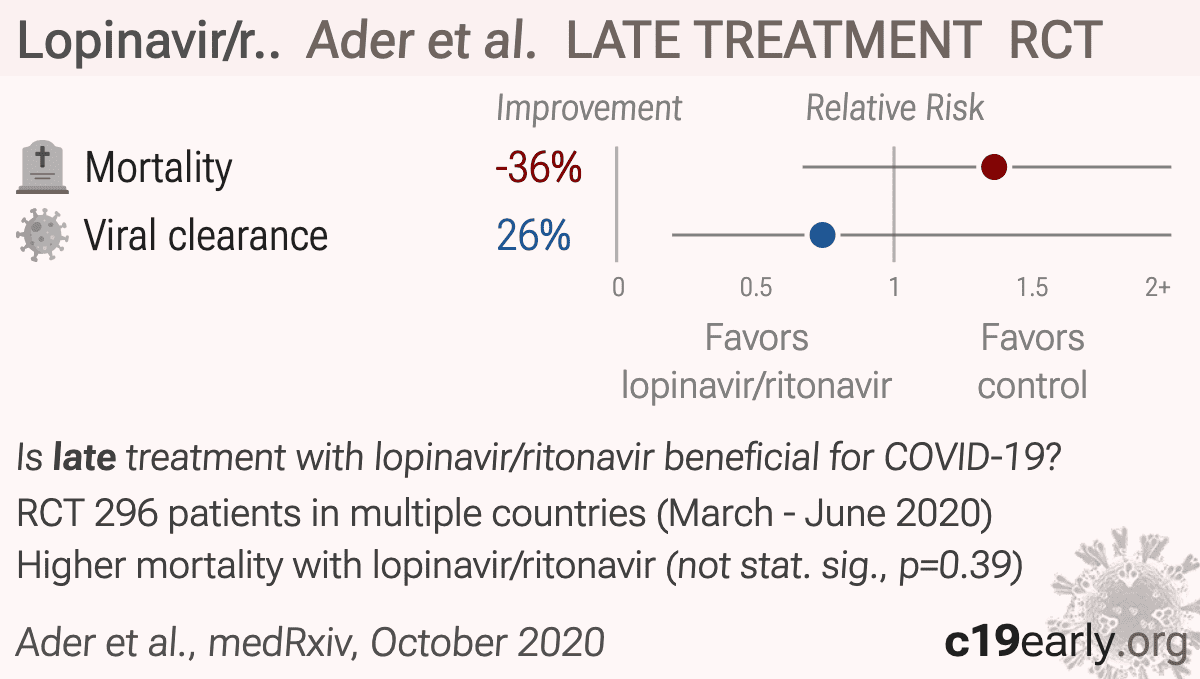
| Ader, 10/6/2020, Randomized Controlled Trial, multiple countries, preprint, baseline oxygen required 95.4%, 59 authors, study period 22 March, 2020 - 29 June, 2020, average treatment delay 9.0 days, excluded in exclusion analyses: very late stage, >50% on oxygen/ventilation at baseline. | risk of death, 36.1% higher, RR 1.36, p = 0.39, treatment 17 of 147 (11.6%), control 13 of 149 (8.7%), adjusted per study, odds ratio converted to relative risk, day 90. |
| risk of no viral clearance, 25.8% lower, RR 0.74, p = 0.65, treatment 4 of 86 (4.7%), control 5 of 81 (6.2%), NNT 66, odds ratio converted to relative risk, Table S2, day 29. | |
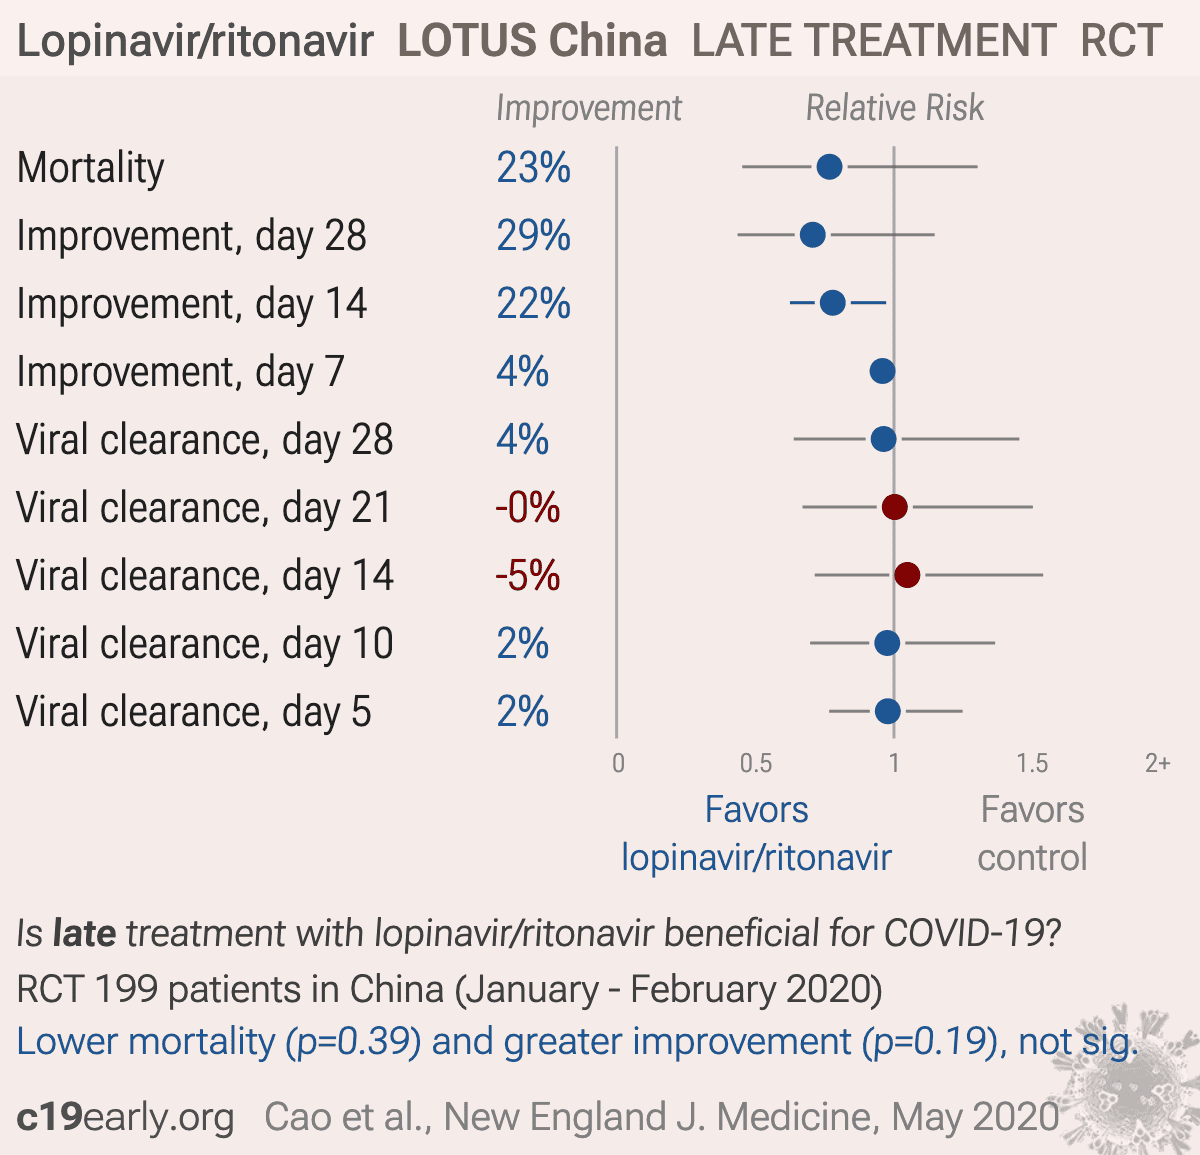
| Cao, 5/7/2020, Randomized Controlled Trial, China, peer-reviewed, median age 58.0, 65 authors, study period 18 January, 2020 - 3 February, 2020, average treatment delay 13.0 days, trial NCT02845843 (history) (LOTUS China). | risk of death, 23.2% lower, RR 0.77, p = 0.39, treatment 19 of 99 (19.2%), control 25 of 100 (25.0%), NNT 17. |
| risk of no improvement, 29.3% lower, RR 0.71, p = 0.19, treatment 21 of 99 (21.2%), control 30 of 100 (30.0%), NNT 11, day 28. | |
| risk of no improvement, 22.1% lower, RR 0.78, p = 0.03, treatment 54 of 99 (54.5%), control 70 of 100 (70.0%), NNT 6.5, day 14. | |
| risk of no improvement, 4.1% lower, RR 0.96, p = 0.17, treatment 93 of 99 (93.9%), control 98 of 100 (98.0%), NNT 25, day 7. | |
| risk of no viral clearance, 3.7% lower, RR 0.96, p = 1.00, treatment 24 of 59 (40.7%), control 30 of 71 (42.3%), NNT 63, day 28. | |
| risk of no viral clearance, 0.3% higher, RR 1.00, p = 1.00, treatment 25 of 59 (42.4%), control 30 of 71 (42.3%), day 21. | |
| risk of no viral clearance, 4.8% higher, RR 1.05, p = 0.86, treatment 27 of 59 (45.8%), control 31 of 71 (43.7%), day 14. | |
| risk of no viral clearance, 2.4% lower, RR 0.98, p = 1.00, treatment 30 of 59 (50.8%), control 37 of 71 (52.1%), NNT 79, day 10. | |
| risk of no viral clearance, 2.2% lower, RR 0.98, p = 1.00, treatment 39 of 59 (66.1%), control 48 of 71 (67.6%), NNT 66, day 5. | |
| Değirmenci, 7/30/2024, retrospective, Turkey, peer-reviewed, mean age 29.3, 7 authors, study period March 2020 - January 2021, excluded in exclusion analyses: unadjusted results with no group details. | risk of hospitalization, 136.0% higher, OR 2.36, p = 0.43, treatment 70, control 55, adjusted per study, multivariable, RR approximated with OR. |
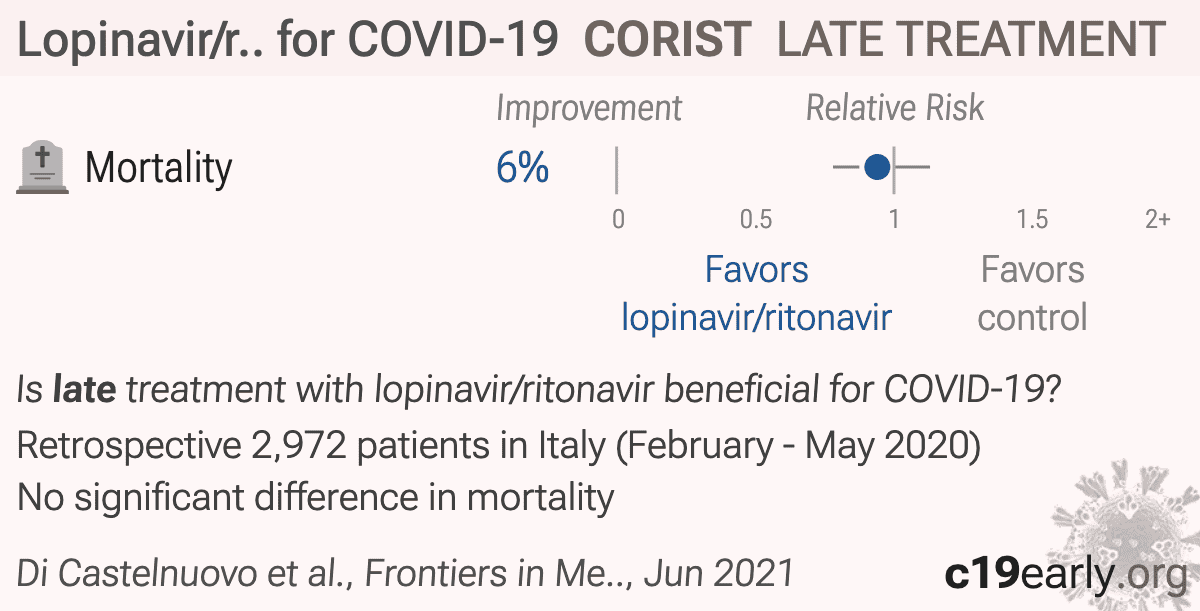
| Di Castelnuovo, 6/9/2021, retrospective, Italy, peer-reviewed, 110 authors, study period 19 February, 2020 - 23 May, 2020, trial NCT04318418 (history) (CORIST). | risk of death, 6.0% lower, HR 0.94, p = 0.52, treatment 1,148, control 1,824. |
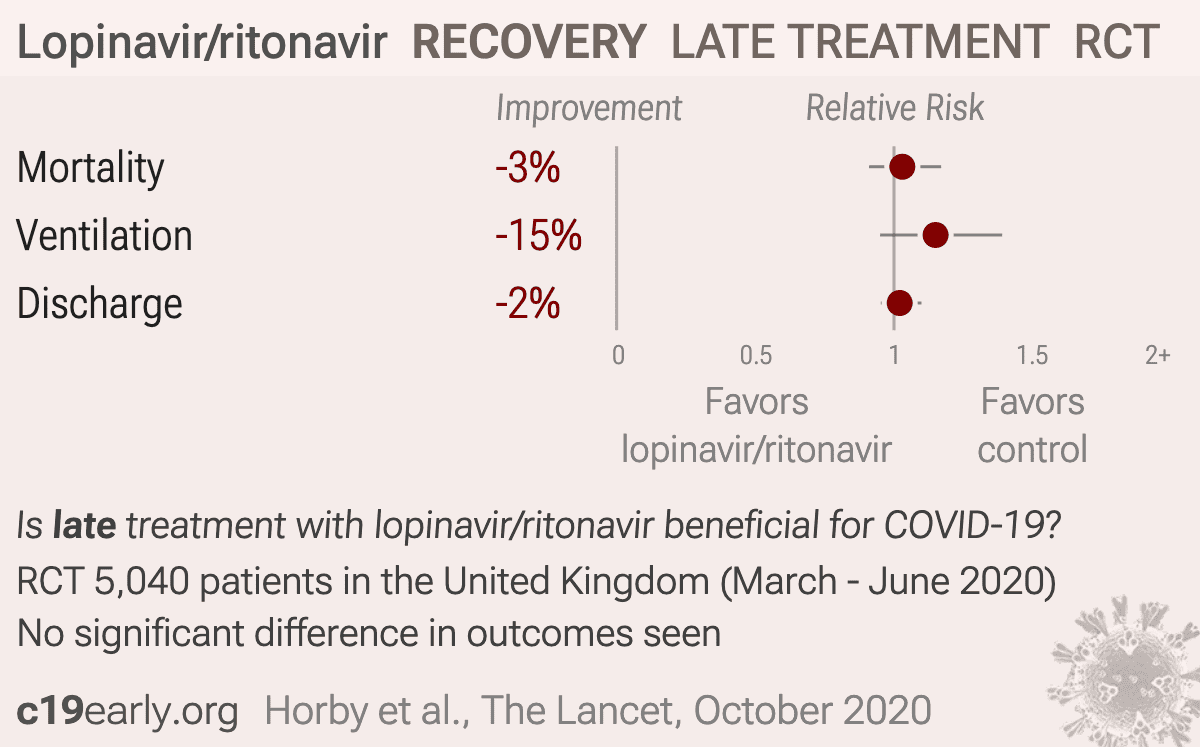
| Horby (C), 10/31/2020, Randomized Controlled Trial, United Kingdom, peer-reviewed, mean age 66.2, 26 authors, study period 19 March, 2020 - 29 June, 2020, trial NCT04381936 (history) (RECOVERY). | risk of death, 7.0% higher, RR 1.07, p = 0.24, treatment 451 of 1,616 (27.9%), control 932 of 3,424 (27.2%), day 180. |
| risk of death, 3.0% higher, RR 1.03, p = 0.60, treatment 374 of 1,616 (23.1%), control 767 of 3,424 (22.4%), day 28. | |
| risk of mechanical ventilation, 15.0% higher, RR 1.15, p = 0.15, treatment 152 of 1,556 (9.8%), control 279 of 3,280 (8.5%), day 28. | |
| risk of no hospital discharge, 2.0% higher, RR 1.02, p = 0.53, treatment 1,616, control 3,424, inverted to make RR<1 favor treatment, day 28. | |
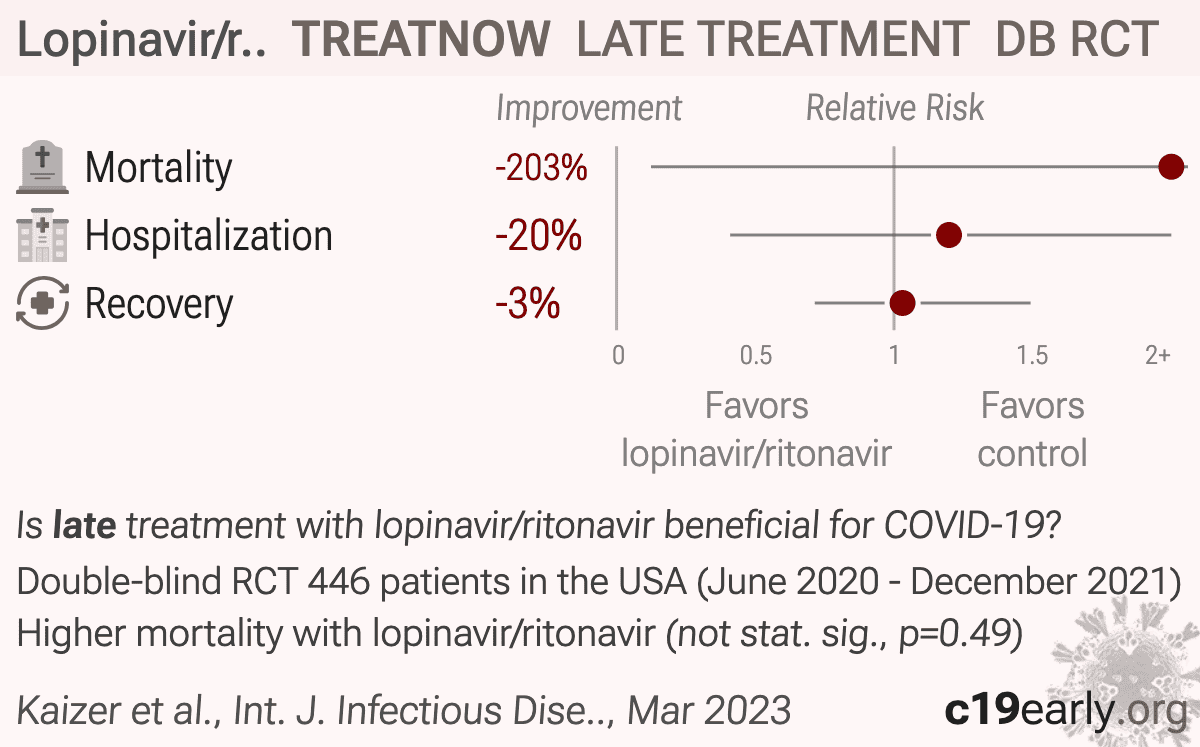
| Kaizer, 3/31/2023, Double Blind Randomized Controlled Trial, placebo-controlled, USA, peer-reviewed, mean age 41.0, 16 authors, study period June 2020 - December 2021, trial NCT04372628 (history) (TREATNOW). | risk of death, 202.7% higher, RR 3.03, p = 0.49, treatment 1 of 220 (0.5%), control 0 of 226 (0.0%), continuity correction due to zero event (with reciprocal of the contrasting arm). |
| risk of hospitalization, 19.8% higher, RR 1.20, p = 0.78, treatment 7 of 220 (3.2%), control 6 of 226 (2.7%). | |
| risk of no recovery, 3.1% higher, HR 1.03, p = 0.88, treatment 220, control 226, inverted to make HR<1 favor treatment, ordinal category, day 15. | |
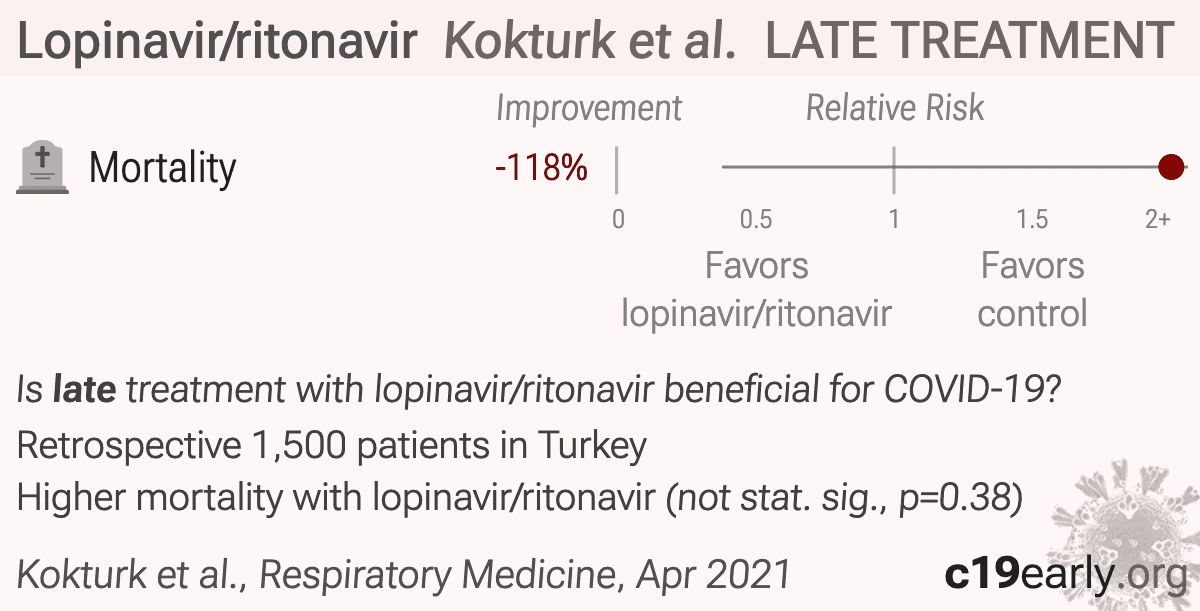
| Kokturk, 4/28/2021, retrospective, database analysis, Turkey, peer-reviewed, 68 authors. | risk of death, 118.2% higher, RR 2.18, p = 0.38, treatment 7 of 55 (12.7%), control 60 of 1,445 (4.2%), adjusted per study, odds ratio converted to relative risk. |
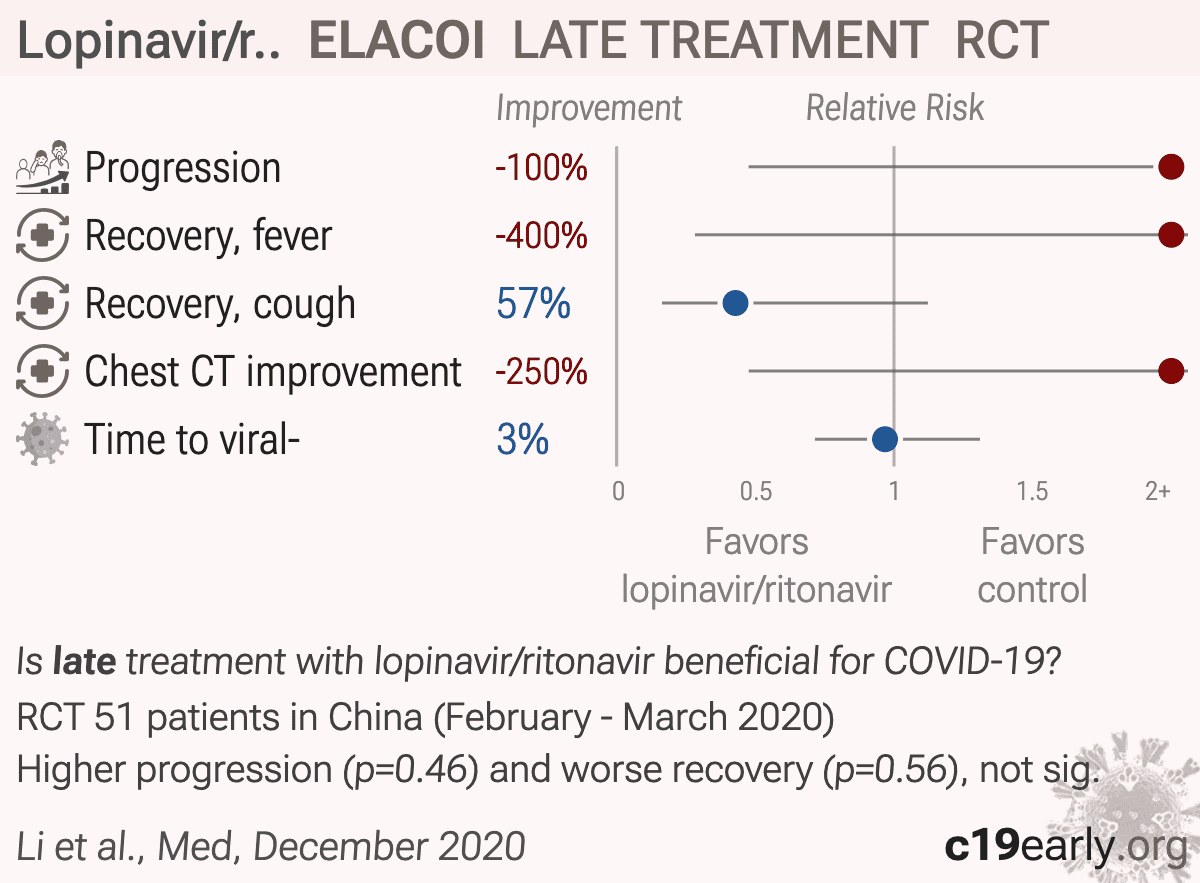
| Li, 12/31/2020, Randomized Controlled Trial, China, peer-reviewed, mean age 49.4, 20 authors, study period 1 February, 2020 - 28 March, 2020, average treatment delay 4.8 days, trial NCT04252885 (history) (ELACOI). | risk of progression, 100% higher, RR 2.00, p = 0.46, treatment 8 of 34 (23.5%), control 2 of 17 (11.8%), progression to severe/critical. |
| risk of no recovery, 400.0% higher, RR 5.00, p = 0.56, treatment 3 of 27 (11.1%), control 0 of 9 (0.0%), continuity correction due to zero event (with reciprocal of the contrasting arm), day 14, fever. | |
| risk of no recovery, 57.1% lower, RR 0.43, p = 0.12, treatment 5 of 21 (23.8%), control 5 of 9 (55.6%), NNT 3.1, day 14, cough. | |
| chest CT improvement, 250.0% higher, RR 3.50, p = 0.23, treatment 7 of 28 (25.0%), control 1 of 14 (7.1%), day 14. | |
| time to viral-, 3.2% lower, relative time 0.97, p = 0.84, treatment mean 9.0 (±5.0) n=34, control mean 9.3 (±5.2) n=17. | |
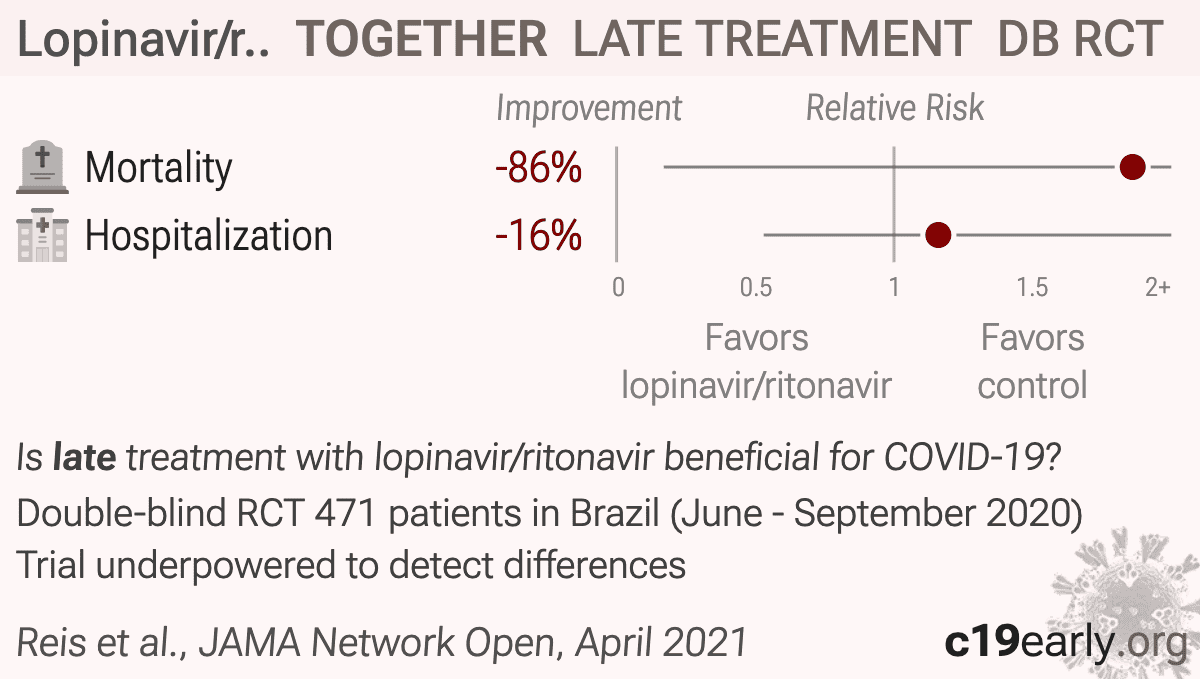
| Reis (B), 4/22/2021, Double Blind Randomized Controlled Trial, Brazil, peer-reviewed, 18 authors, study period 2 June, 2020 - 30 September, 2020, trial NCT04403100 (history) (TOGETHER). | risk of death, 86.1% higher, RR 1.86, p = 1.00, treatment 2 of 244 (0.8%), control 1 of 227 (0.4%). |
| risk of hospitalization, 16.0% higher, HR 1.16, p = 0.72, treatment 14 of 244 (5.7%), control 11 of 227 (4.8%), ITT, Cox proportional hazards. | |
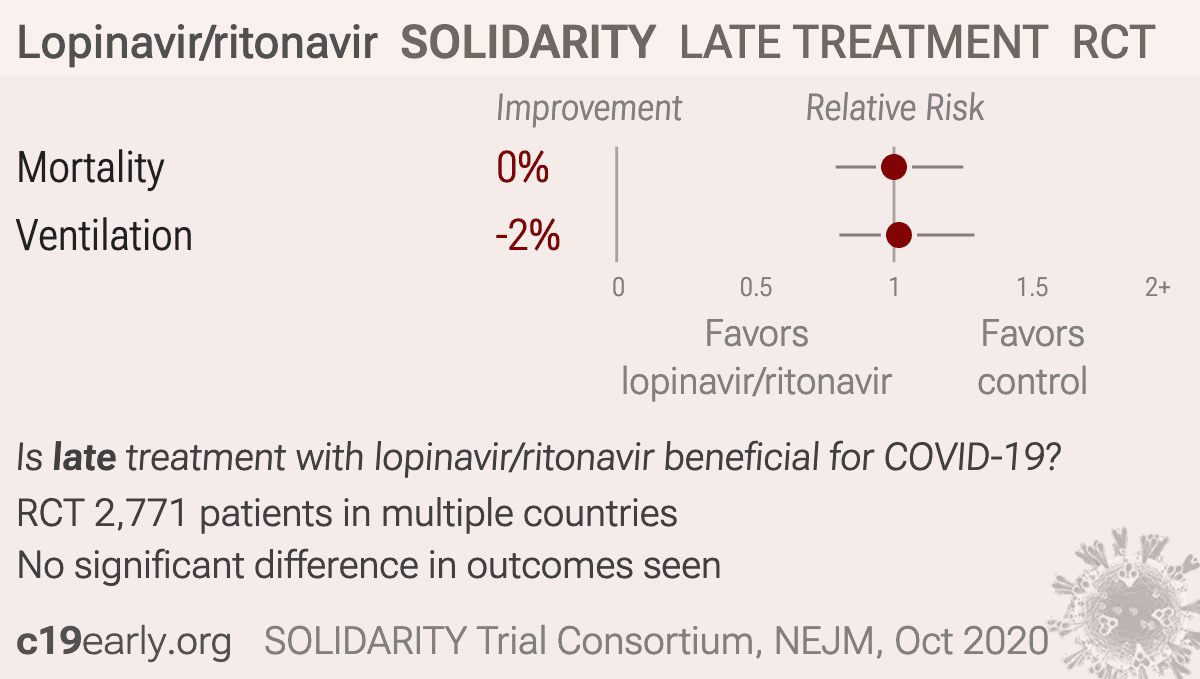
| SOLIDARITY Trial Consortium, 10/15/2020, Randomized Controlled Trial, multiple countries, peer-reviewed, 15 authors, trial NCT04315948 (history) (SOLIDARITY). | risk of death, no change, RR 1.00, p = 1.00, treatment 148 of 1,399 (10.6%), control 146 of 1,372 (10.6%), NNT 1602, Kaplan-Meier, day 28. |
| risk of mechanical ventilation, 1.8% higher, RR 1.02, p = 0.89, treatment 126 of 1,287 (9.8%), control 121 of 1,258 (9.6%). | |
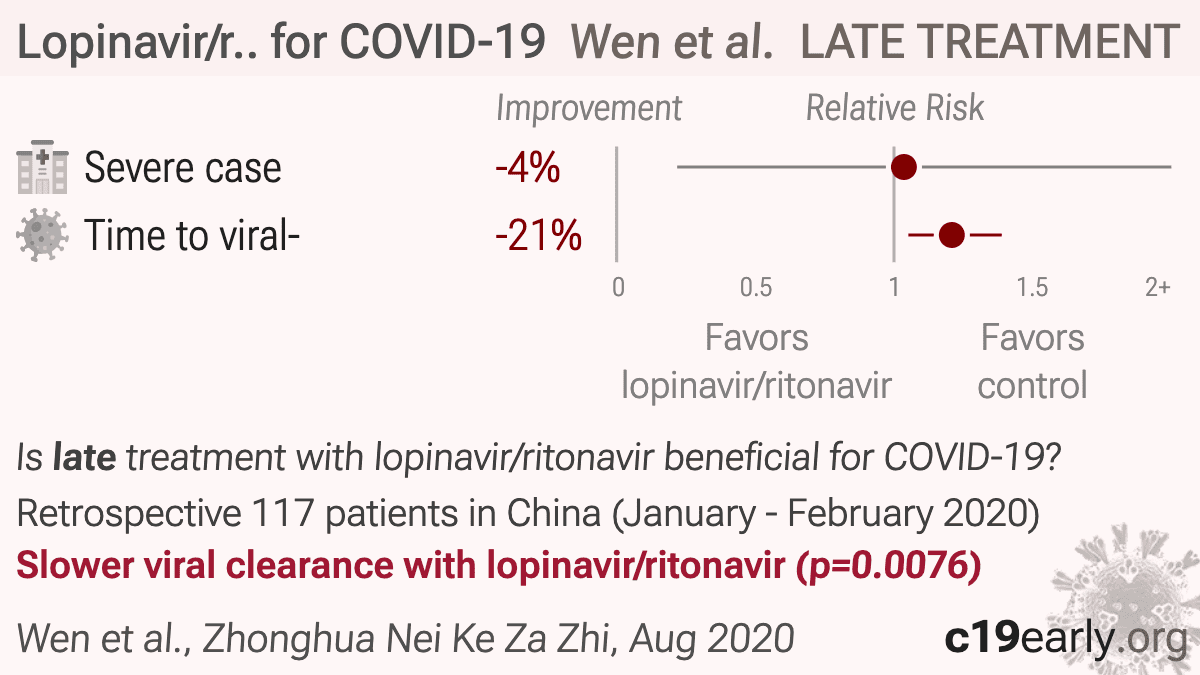
| Wen, 8/1/2020, retrospective, China, peer-reviewed, 11 authors, study period 20 January, 2020 - 10 February, 2020. | risk of severe case, 3.6% higher, RR 1.04, p = 1.00, treatment 3 of 56 (5.4%), control 3 of 58 (5.2%). |
| time to viral-, 20.9% higher, relative time 1.21, p = 0.008, treatment mean 10.2 (±3.49) n=59, control mean 8.44 (±3.51) n=58. | |
| Yan, 5/19/2020, retrospective, China, peer-reviewed, median age 52.0, 7 authors, study period 31 January, 2020 - 9 March, 2020. | prolonged viral shedding, 40.0% lower, HR 0.60, p = 0.010, treatment 78, control 42, adjusted per study, multivariable, Cox proportional hazards. |
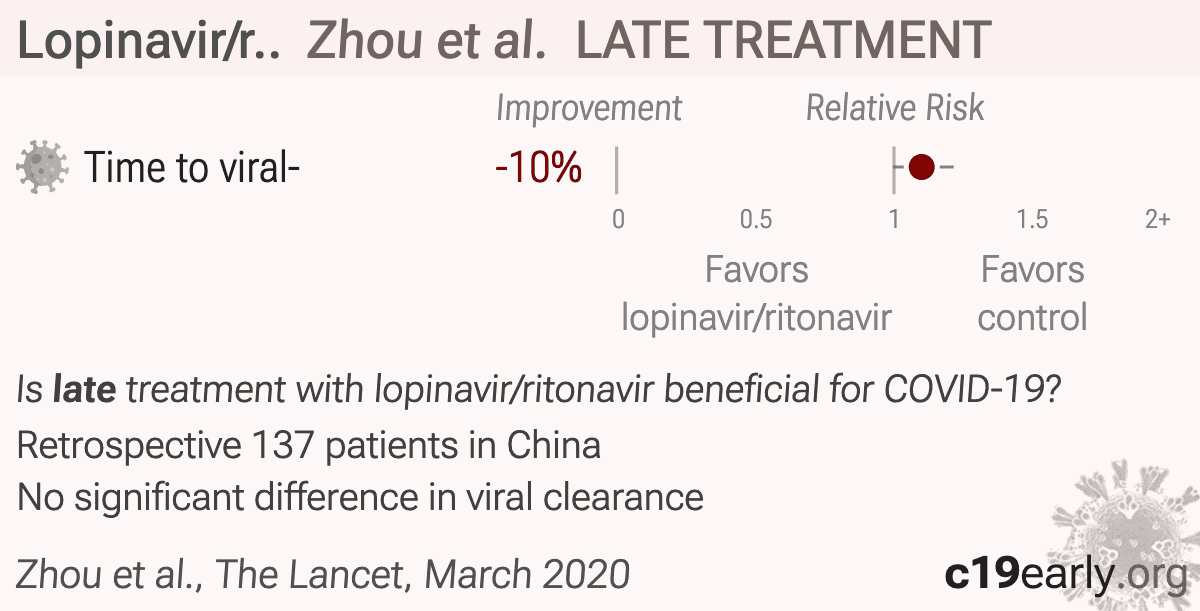
| Zhou, 3/31/2020, retrospective, China, peer-reviewed, 19 authors. | time to viral-, 10.0% higher, relative time 1.10, p = 0.06, treatment median 22.0 IQR 6.0 n=29, control median 20.0 IQR 7.0 n=108. |
Effect extraction follows pre-specified rules as detailed above
and gives priority to more serious outcomes.
For pooled analyses, the first (most serious) outcome is used, which may
differ from the effect a paper focuses on.
Other outcomes are used in outcome specific analyses.
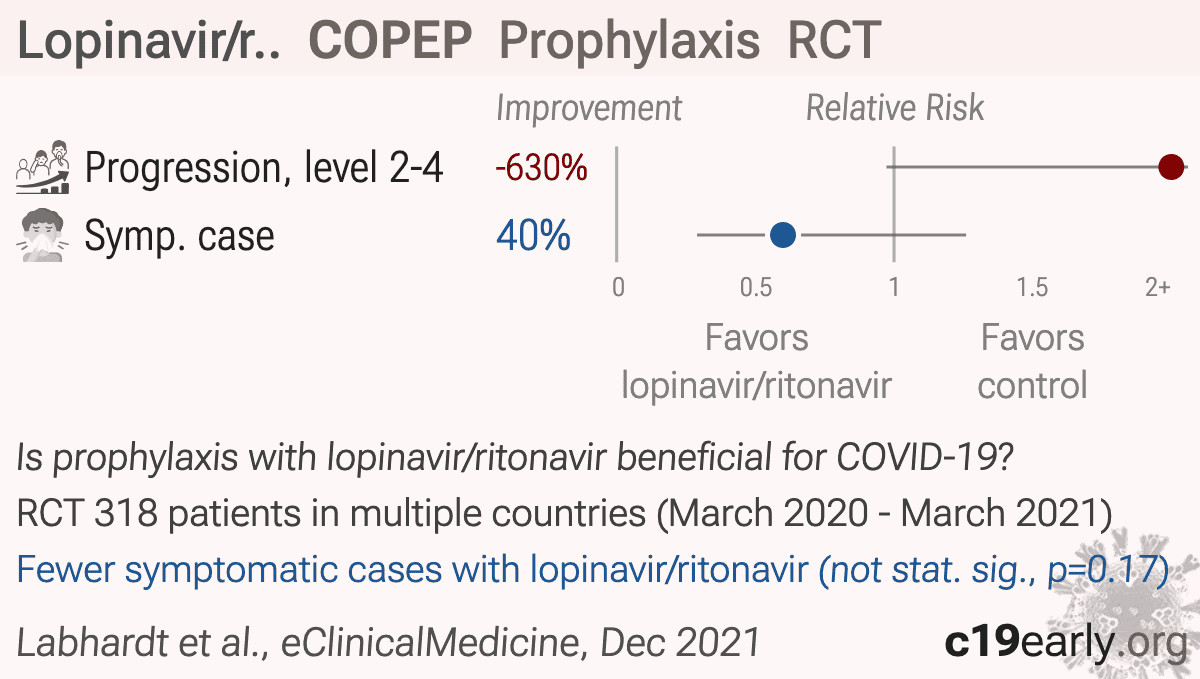
| Labhardt, 12/31/2021, Randomized Controlled Trial, multiple countries, peer-reviewed, mean age 39.7, 26 authors, study period March 2020 - March 2021, trial NCT04364022 (history) (COPEP), excluded in exclusion analyses: significant confounding by time possible. | risk of progression, 630.1% higher, RR 7.30, p = 0.02, treatment 14 of 209 (6.7%), control 1 of 109 (0.9%), level 2-4. |
| risk of symptomatic case, 40.0% lower, HR 0.60, p = 0.17, treatment 35 of 209 (16.7%), control 13 of 109 (11.9%), adjusted per study. |
Viral infection and replication involves attachment, entry, uncoating and release, genome replication and transcription, translation and protein processing, assembly and budding, and release. Each step can be disrupted by therapeutics.
When administered late in infection, HCQ may enhance viral egress by further increasing
lysosomal pH beyond the effect of ORF3a's water channel activity, thereby promoting
lysosomal exocytosis, inactivating degradative enzymes, and facilitating the release of
SARS-CoV-2 particles into the extracellular environment108,109.
Research also suggests potential cardioprotective effects at lower doses, but
cardiotoxicity with excessive dosage110. Bobrowski et al. also
indicate negative effects if HCQ and remdesivir are combined.
Peters (B) et al. is subject to confounding by calendar-time (SOC evolved rapidly early in
the pandemic, the linear covariate does not reflect non-linear SOC changes and hospital
specific effects), hospital type (non-treatment hospitals were tertiary university
centers), confounding by indication (4/7 hospitals initiated treatment on deterioration),
immortal-time bias for as-treated (exposure assigned after baseline), significant
differences for other experimental treatments, potential overadjustment from collider bias
(steroid use and indication bias), limited baseline severity information, differences in
hospice referral propensity across hospitals, unadjusted difference in time from onset to
admission, difference in PCR positivity, and other factors.
Mahévas et al. is subject to confounding by hospital (treatment highly dependent on
the hospital, different SOC/ICU transfer practices, not included in PS), immortal time
(only partly addressed in sensitivity analysis), co-treatment differences, calendar-time
(SOC evolved rapidly early in the pandemic), binary coding for age (age ≥65 despite steep
age-risk gradient), residual imbalance (variables dropped from PS), a composite outcome
dependent on hospital triage/capacity, and other factors.
Ryu et al., Fibrin drives thromboinflammation and neuropathology in COVID-19, Nature, doi:10.1038/s41586-024-07873-4.
Rong et al., Persistence of spike protein at the skull-meninges-brain axis may contribute to the neurological sequelae of COVID-19, Cell Host & Microbe, doi:10.1016/j.chom.2024.11.007.
Yang et al., SARS-CoV-2 infection causes dopaminergic neuron senescence, Cell Stem Cell, doi:10.1016/j.stem.2023.12.012.
Scardua-Silva et al., Microstructural brain abnormalities, fatigue, and cognitive dysfunction after mild COVID-19, Scientific Reports, doi:10.1038/s41598-024-52005-7.
Hampshire et al., Cognition and Memory after Covid-19 in a Large Community Sample, New England Journal of Medicine, doi:10.1056/NEJMoa2311330.
Duloquin et al., Is COVID-19 Infection a Multiorganic Disease? Focus on Extrapulmonary Involvement of SARS-CoV-2, Journal of Clinical Medicine, doi:10.3390/jcm13051397.
Sodagar et al., Pathological Features and Neuroinflammatory Mechanisms of SARS-CoV-2 in the Brain and Potential Therapeutic Approaches, Biomolecules, doi:10.3390/biom12070971.
Sagar et al., COVID-19-associated cerebral microbleeds in the general population, Brain Communications, doi:10.1093/braincomms/fcae127.
Verma et al., Persistent Neurological Deficits in Mouse PASC Reveal Antiviral Drug Limitations, bioRxiv, doi:10.1101/2024.06.02.596989.
Panagea et al., Neurocognitive Impairment in Long COVID: A Systematic Review, Archives of Clinical Neuropsychology, doi:10.1093/arclin/acae042.
Ariza et al., COVID-19: Unveiling the Neuropsychiatric Maze—From Acute to Long-Term Manifestations, Biomedicines, doi:10.3390/biomedicines12061147.
Vashisht et al., Neurological Complications of COVID-19: Unraveling the Pathophysiological Underpinnings and Therapeutic Implications, Viruses, doi:10.3390/v16081183.
Ahmad et al., Neurological Complications and Outcomes in Critically Ill Patients With COVID-19: Results From International Neurological Study Group From the COVID-19 Critical Care Consortium, The Neurohospitalist, doi:10.1177/19418744241292487.
Wang et al., SARS-CoV-2 membrane protein induces neurodegeneration via affecting Golgi-mitochondria interaction, Translational Neurodegeneration, doi:10.1186/s40035-024-00458-1.
Freitas et al., Central nervous system and systemic inflammatory networks associated with acute neurological outcomes in COVID-19, Scientific Reports, doi:10.1038/s41598-025-08632-9.
Lu et al., Risk of neuropsychiatric and related conditions associated with SARS-CoV-2 infection: a difference-in-differences analysis, Nature Communications, doi:10.1038/s41467-025-61961-1.
Jachman-Kapułka et al., Cross-Section of Neurological Manifestations Among SARS-CoV-2 Omicron Subvariants—Single-Center Study, Brain Sciences, doi:10.3390/brainsci14111161.
Beckman et al., SARS-CoV-2 infects neurons and induces neuroinflammation in a non-human primate model of COVID-19, Cell Reports, doi:10.1016/j.celrep.2022.111573.
Eberhardt et al., SARS-CoV-2 infection triggers pro-atherogenic inflammatory responses in human coronary vessels, Nature Cardiovascular Research, doi:10.1038/s44161-023-00336-5.
Van Tin et al., Spike Protein of SARS-CoV-2 Activates Cardiac Fibrogenesis through NLRP3 Inflammasomes and NF-κB Signaling, Cells, doi:10.3390/cells13161331.
Borka Balas et al., COVID-19 and Cardiac Implications—Still a Mystery in Clinical Practice, Reviews in Cardiovascular Medicine, doi:10.31083/j.rcm2405125.
AlTaweel et al., An In-Depth Insight into Clinical, Cellular and Molecular Factors in COVID19-Associated Cardiovascular Ailments for Identifying Novel Disease Biomarkers, Drug Targets and Clinical Management Strategies, Archives of Microbiology & Immunology, doi:10.26502/ami.936500177.
Saha et al., COVID-19 beyond the lungs: Unraveling its vascular impact and cardiovascular complications—mechanisms and therapeutic implications, Science Progress, doi:10.1177/00368504251322069.
Yin et al., COVID-19: a vascular nightmare unfolding, Frontiers in Immunology, doi:10.3389/fimmu.2025.1593885.
Bruno et al., Accelerated vascular ageing after COVID-19 infection: the CARTESIAN study, European Heart Journal, doi:10.1093/eurheartj/ehaf430.
Abiri et al., The silent legacy of COVID-19: exploring genomic instability in long-term COVID-19 survivors, BMC Infectious Diseases, doi:10.1186/s12879-025-11419-y.
Gioia et al., SARS-CoV-2 infection induces DNA damage, through CHK1 degradation and impaired 53BP1 recruitment, and cellular senescence, Nature Cell Biology, doi:10.1038/s41556-023-01096-x.
Doğan et al., Clinical Investigation of Leukocyte DNA Damage in COVID-19 Patients, Current Issues in Molecular Biology, doi:10.3390/cimb45020062.
Rueda-Torres et al., Longitudinal Assessment of DNA Damage in PBMCs From Hospitalized COVID‐19 Patients via Alkaline Comet Assay, Environmental and Molecular Mutagenesis, doi:10.1002/em.70055.
Trender et al., Changes in memory and cognition during the SARS-CoV-2 human challenge study, eClinicalMedicine, doi:10.1016/j.eclinm.2024.102842.
Dugied et al., Multimodal SARS-CoV-2 interactome sketches the virus-host spatial organization, Communications Biology, doi:10.1038/s42003-025-07933-z.
Malone et al., Structures and functions of coronavirus replication–transcription complexes and their relevance for SARS-CoV-2 drug design, Nature Reviews Molecular Cell Biology, doi:10.1038/s41580-021-00432-z.
Murigneux et al., Proteomic analysis of SARS-CoV-2 particles unveils a key role of G3BP proteins in viral assembly, Nature Communications, doi:10.1038/s41467-024-44958-0.
Lv et al., Host proviral and antiviral factors for SARS-CoV-2, Virus Genes, doi:10.1007/s11262-021-01869-2.
Lui et al., Nsp1 facilitates SARS-CoV-2 replication through calcineurin-NFAT signaling, Virology, doi:10.1128/mbio.00392-24.
Niarakis et al., Drug-target identification in COVID-19 disease mechanisms using computational systems biology approaches, Frontiers in Immunology, doi:10.3389/fimmu.2023.1282859.
Katiyar et al., SARS-CoV-2 Assembly: Gaining Infectivity and Beyond, Viruses, doi:10.3390/v16111648.
Wu et al., Decoding the genome of SARS-CoV-2: a pathway to drug development through translation inhibition, RNA Biology, doi:10.1080/15476286.2024.2433830.
Zeraatkar et al., Consistency of covid-19 trial preprints with published reports and impact for decision making: retrospective review, BMJ Medicine, doi:10.1136/bmjmed-2022-0003091.
Davidson et al., No evidence of important difference in summary treatment effects between COVID-19 preprints and peer-reviewed publications: a meta-epidemiological study, Journal of Clinical Epidemiology, doi:10.1016/j.jclinepi.2023.08.011.
Jadad et al., Randomized Controlled Trials: Questions, Answers, and Musings, Second Edition, doi:10.1002/9780470691922.
Gøtzsche, P., Bias in double-blind trials, Doctoral Thesis, University of Copenhagen, www.scientificfreedom.dk/2023/05/16/bias-in-double-blind-trials-doctoral-thesis/.
Als-Nielsen et al., Association of Funding and Conclusions in Randomized Drug Trials, JAMA, doi:10.1001/jama.290.7.921.
Bekelman et al., Scope and Impact of Financial Conflicts of Interest in Biomedical Research, JAMA, doi:10.1001/jama.289.4.454.
Lundh et al., Industry sponsorship and research outcome, Cochrane Database of Systematic Reviews, doi:10.1002/14651858.MR000033.pub3.
Concato et al., Randomized, Controlled Trials, Observational Studies, and the Hierarchy of Research Designs, New England Journal of Medicine, doi:10.1056/NEJM200006223422507.
Ader et al., An open-label randomized, controlled trial of the effect of lopinavir/ritonavir, lopinavir/ritonavir plus IFN-beta-1a and hydroxychloroquine in hospitalized patients with COVID-19 - Final results from the DisCoVeRy trial, medRxiv, doi:10.1101/2022.02.16.22271064.
Değirmenci et al., Is vitamin D level important in pregnant women with COVID-19?, Journal of Controversies in Obstetrics & Gynecology and Pediatrics, doi:10.51271/JCOGP-0035.
Labhardt et al., Post-exposure Lopinavir-Ritonavir Prophylaxis versus Surveillance for Individuals Exposed to SARS-CoV-2: The COPEP Pragmatic Open-Label, Cluster Randomized Trial, eClinicalMedicine, doi:10.1016/j.eclinm.2021.101188.
Strub-Wourgaft et al., An open-label, multicentre, randomised, adaptive platform trial of the safety and efficacy of several therapies, including antiviral therapies, versus control in mild/moderate cases of COVID-19, ANTICOV, anticov.org/wp-content/uploads/2024/07/ANTICOV-ClinicalStudyReport_2024.pdf.
Treanor et al., Efficacy and Safety of the Oral Neuraminidase Inhibitor Oseltamivir in Treating Acute Influenza: A Randomized Controlled Trial, JAMA, 2000, 283:8, 1016-1024, doi:10.1001/jama.283.8.1016.
McLean et al., Impact of Late Oseltamivir Treatment on Influenza Symptoms in the Outpatient Setting: Results of a Randomized Trial, Open Forum Infect. Dis. September 2015, 2:3, doi:10.1093/ofid/ofv100.
Ikematsu et al., Baloxavir Marboxil for Prophylaxis against Influenza in Household Contacts, New England Journal of Medicine, doi:10.1056/NEJMoa1915341.
Hayden et al., Baloxavir Marboxil for Uncomplicated Influenza in Adults and Adolescents, New England Journal of Medicine, doi:10.1056/NEJMoa1716197.
Kumar et al., Combining baloxavir marboxil with standard-of-care neuraminidase inhibitor in patients hospitalised with severe influenza (FLAGSTONE): a randomised, parallel-group, double-blind, placebo-controlled, superiority trial, The Lancet Infectious Diseases, doi:10.1016/S1473-3099(21)00469-2.
López-Medina et al., Effect of Ivermectin on Time to Resolution of Symptoms Among Adults With Mild COVID-19: A Randomized Clinical Trial, JAMA, doi:10.1001/jama.2021.3071.
Korves et al., SARS-CoV-2 Genetic Variants and Patient Factors Associated with Hospitalization Risk, medRxiv, doi:10.1101/2024.03.08.24303818.
Faria et al., Genomics and epidemiology of the P.1 SARS-CoV-2 lineage in Manaus, Brazil, Science, doi:10.1126/science.abh2644.
Nonaka et al., SARS-CoV-2 variant of concern P.1 (Gamma) infection in young and middle-aged patients admitted to the intensive care units of a single hospital in Salvador, Northeast Brazil, February 2021, International Journal of Infectious Diseases, doi:10.1016/j.ijid.2021.08.003.
Karita et al., Trajectory of viral load in a prospective population-based cohort with incident SARS-CoV-2 G614 infection, medRxiv, doi:10.1101/2021.08.27.21262754.
Zavascki et al., Advanced ventilatory support and mortality in hospitalized patients with COVID-19 caused by Gamma (P.1) variant of concern compared to other lineages: cohort study at a reference center in Brazil, Research Square, doi:10.21203/rs.3.rs-910467/v1.
Willett et al., The hyper-transmissible SARS-CoV-2 Omicron variant exhibits significant antigenic change, vaccine escape and a switch in cell entry mechanism, medRxiv, doi:10.1101/2022.01.03.21268111.
Peacock et al., The SARS-CoV-2 variant, Omicron, shows rapid replication in human primary nasal epithelial cultures and efficiently uses the endosomal route of entry, bioRxiv, doi:10.1101/2021.12.31.474653.
Williams, T., Not All Ivermectin Is Created Equal: Comparing The Quality of 11 Different Ivermectin Sources, Do Your Own Research, doyourownresearch.substack.com/p/not-all-ivermectin-is-created-equal.
Xu et al., A study of impurities in the repurposed COVID-19 drug hydroxychloroquine sulfate by UHPLC-Q/TOF-MS and LC-SPE-NMR, Rapid Communications in Mass Spectrometry, doi:10.1002/rcm.9358.
Jitobaom et al., Favipiravir and Ivermectin Showed in Vitro Synergistic Antiviral Activity against SARS-CoV-2, Research Square, doi:10.21203/rs.3.rs-941811/v1.
Jitobaom (B) et al., Synergistic anti-SARS-CoV-2 activity of repurposed anti-parasitic drug combinations, BMC Pharmacology and Toxicology, doi:10.1186/s40360-022-00580-8.
Jeffreys et al., Remdesivir-ivermectin combination displays synergistic interaction with improved in vitro activity against SARS-CoV-2, International Journal of Antimicrobial Agents, doi:10.1016/j.ijantimicag.2022.106542.
Ostrov et al., Highly Specific Sigma Receptor Ligands Exhibit Anti-Viral Properties in SARS-CoV-2 Infected Cells, Pathogens, doi:10.3390/pathogens10111514.
Alsaidi et al., Griffithsin and Carrageenan Combination Results in Antiviral Synergy against SARS-CoV-1 and 2 in a Pseudoviral Model, Marine Drugs, doi:10.3390/md19080418.
Andreani et al., In vitro testing of combined hydroxychloroquine and azithromycin on SARS-CoV-2 shows synergistic effect, Microbial Pathogenesis, doi:10.1016/j.micpath.2020.104228.
De Forni et al., Synergistic drug combinations designed to fully suppress SARS-CoV-2 in the lung of COVID-19 patients, PLoS ONE, doi:10.1371/journal.pone.0276751.
Wan et al., Synergistic inhibition effects of andrographolide and baicalin on coronavirus mechanisms by downregulation of ACE2 protein level, Scientific Reports, doi:10.1038/s41598-024-54722-5.
Said et al., The effect of Nigella sativa and vitamin D3 supplementation on the clinical outcome in COVID-19 patients: A randomized controlled clinical trial, Frontiers in Pharmacology, doi:10.3389/fphar.2022.1011522.
Fiaschi et al., In Vitro Combinatorial Activity of Direct Acting Antivirals and Monoclonal Antibodies against the Ancestral B.1 and BQ.1.1 SARS-CoV-2 Viral Variants, Viruses, doi:10.3390/v16020168.
Xing et al., Published anti-SARS-CoV-2 in vitro hits share common mechanisms of action that synergize with antivirals, Briefings in Bioinformatics, doi:10.1093/bib/bbab249.
Chen et al., Synergistic Inhibition of SARS-CoV-2 Replication Using Disulfiram/Ebselen and Remdesivir, ACS Pharmacology & Translational Science, doi:10.1021/acsptsci.1c00022.
Hempel et al., Synergistic inhibition of SARS-CoV-2 cell entry by otamixaban and covalent protease inhibitors: pre-clinical assessment of pharmacological and molecular properties, Chemical Science, doi:10.1039/D1SC01494C.
Schultz et al., Pyrimidine inhibitors synergize with nucleoside analogues to block SARS-CoV-2, Nature, doi:10.1038/s41586-022-04482-x.
Ohashi et al., Potential anti-COVID-19 agents, cepharanthine and nelfinavir, and their usage for combination treatment, iScience, doi:10.1016/j.isci.2021.102367.
Al Krad et al., The protease inhibitor Nirmatrelvir synergizes with inhibitors of GRP78 to suppress SARS-CoV-2 replication, bioRxiv, doi:10.1101/2025.03.09.642200.
Abd Elsalam et al., Anti-COVID-19 activity and simple HPLC method for concurrent detection of repurposed drugs in novel binary mixtures, AMB Express, doi:10.1186/s13568-026-02030-8.
Rana et al., Ivermectin and Doxycycline combination as a promising anti-viral drug candidate: an in-silico and DFT study, In Silico Pharmacology, doi:10.1007/s40203-026-00576-w.
Setz et al., Synergistic Virus Neutralizing Activities of European Black Elderberry Fruit Extract and Iota-Carrageenan Against SARS-CoV-2, Influenza A Virus and Respiratory Syncytial Virus, Nutrients, doi:10.3390/nu18081205.
Ali et al., Preclinical Screening Platform Identifies Azatadine‐Dimaleate as a Potent Repurposed Therapeutic Against SARS‐CoV‐2 Infection, Journal of Medical Virology, doi:10.1002/jmv.70713.
Lew et al., Combination of Remdesivir and Ivermectin Exerts Highly Potent and Synergistic Antiviral Activity Against Murine Coronavirus and SARS-CoV-2 Infections, Cells, doi:10.3390/cells15131146.
Khatun et al., An All-Oral Antiviral Combination Strategy against COVID-19 Enabled by the Synergistic Mechanism of Action of Auranofin and Remdesivir, Elsevier BV, doi:10.2139/ssrn.6942990.
Thairu et al., A Comparison of Ivermectin and Non Ivermectin Based Regimen for COVID-19 in Abuja: Effects on Virus Clearance, Days-to-discharge and Mortality, Journal of Pharmaceutical Research International, doi:10.9734/jpri/2022/v34i44A36328.
Singh et al., The relationship between viral clearance rates and disease progression in early symptomatic COVID-19: a systematic review and meta-regression analysis, Journal of Antimicrobial Chemotherapy, doi:10.1093/jac/dkae045.
Rothstein, H., Publication Bias in Meta-Analysis: Prevention, Assessment and Adjustments, www.wiley.com/en-ae/Publication+Bias+in+Meta+Analysis:+Prevention,+Assessment+and+Adjustments-p-9780470870143.
Stanley et al., Meta-regression approximations to reduce publication selection bias, Research Synthesis Methods, doi:10.1002/jrsm.1095.
Rücker et al., Arcsine test for publication bias in meta-analyses with binary outcomes, Statistics in Medicine, doi:10.1002/sim.2971.
Peters, J., Comparison of Two Methods to Detect Publication Bias in Meta-analysis, JAMA, doi:10.1001/jama.295.6.676.
Moreno et al., Assessment of regression-based methods to adjust for publication bias through a comprehensive simulation study, BMC Medical Research Methodology, doi:10.1186/1471-2288-9-2.
Macaskill et al., A comparison of methods to detect publication bias in meta-analysis, Statistics in Medicine, doi:10.1002/sim.698.
Egger et al., Bias in meta-analysis detected by a simple, graphical test, BMJ, doi:10.1136/bmj.315.7109.629.
Harbord et al., A modified test for small-study effects in meta-analyses of controlled trials with binary endpoints, Statistics in Medicine, doi:10.1002/sim.2380.
Horby et al., Long-term follow-up of treatment comparisons in RECOVERY: a randomised, open-label, platform trial for patients hospitalised with COVID-19, medRxiv, doi:10.1101/2025.08.29.25334732.
Mateja et al., The choice of viral load endpoint in early phase trials of COVID-19 treatments aiming to reduce 28-day hospitalization and/or death, The Journal of Infectious Diseases, doi:10.1093/infdis/jiaf282.
Zhang et al., What's the relative risk? A method of correcting the odds ratio in cohort studies of common outcomes, JAMA, 80:19, 1690, doi:10.1001/jama.280.19.1690.
Altman (B) et al., How to obtain the confidence interval from a P value, BMJ, doi:10.1136/bmj.d2090.
Sweeting et al., What to add to nothing? Use and avoidance of continuity corrections in meta-analysis of sparse data, Statistics in Medicine, doi:10.1002/sim.1761.
Altman (C) et al., Interaction revisited: the difference between two estimates, BMJ, doi:10.1136/bmj.326.7382.219.
Michelucci et al., SARS-CoV-2 ORF3a accessory protein is a water-permeable channel that induces lysosome swelling, Communications Biology, doi:10.1038/s42003-024-07442-5.
Ghosh et al., β-Coronaviruses Use Lysosomes for Egress Instead of the Biosynthetic Secretory Pathway, Cell, doi:10.1016/j.cell.2020.10.039.
Kamga Kapchoup et al., In vitro effect of hydroxychloroquine on pluripotent stem cells and their cardiomyocytes derivatives, Frontiers in Pharmacology, doi:10.3389/fphar.2023.1128382.
Bobrowski et al., Synergistic and Antagonistic Drug Combinations against SARS-CoV-2, Molecular Therapy, doi:10.1016/j.ymthe.2020.12.016.
Peters (B) et al., Outcomes of Persons With COVID-19 in Hospitals With and Without Standard Treatment With (Hydroxy)chloroquine, Clinical Microbiology and Infection, doi:10.1016/j.cmi.2020.10.004.
Mahévas et al., Clinical efficacy of hydroxychloroquine in patients with covid-19 pneumonia who require oxygen: observational comparative study using routine care data, BMJ 2020, doi:10.1136/bmj.m1844.
Minozzi et al., The revised Cochrane risk of bias tool for randomized trials (RoB 2) showed low interrater reliability and challenges in its application, Journal of Clinical Epidemiology, doi:10.1016/j.jclinepi.2020.06.015.
Popp et al., Ivermectin for preventing and treating COVID-19, Cochrane Database of Systematic Reviews, doi:10.1002/14651858.CD015017.pub3.
Reis et al., Effect of Early Treatment with Ivermectin among Patients with Covid-19, New England Journal of Medicine, doi:10.1056/NEJMoa2115869.
Axfors et al., Mortality outcomes with hydroxychloroquine and chloroquine in COVID-19 from an international collaborative meta-analysis of randomized trials, Nature, doi:10.1038/s41467-021-22446-z.
Horby (B) et al., Effect of Hydroxychloroquine in Hospitalized Patients with COVID-19: Preliminary results from a multi-centre, randomized, controlled trial, NEJM, doi:10.1056/NEJMoa2022926.
Hempenius et al., Bias in observational studies on the effectiveness of in hospital use of hydroxychloroquine in COVID-19, Pharmacoepidemiology and Drug Safety, doi:10.1002/pds.5632.
Huang et al., No Statistically Apparent Difference in Antiviral Effectiveness Observed Among Ribavirin Plus Interferon-Alpha, Lopinavir/Ritonavir Plus Interferon-Alpha, and Ribavirin Plus Lopinavir/Ritonavir Plus Interferon-Alpha in Patients With Mild to Moderate Coronavirus Disease 2019: Results of a Randomized, Open-Labeled Prospective Study, Frontiers in Pharmacology, doi:10.3389/fphar.2020.01071.
Lowe et al., Favipiravir, lopinavir-ritonavir, or combination therapy (FLARE): A randomised, double-blind, 2 × 2 factorial placebo-controlled trial of early antiviral therapy in COVID-19, PLOS Medicine, doi:10.1371/journal.pmed.1004120.
Wong et al., Slower Recovery with Early Lopinavir/Ritonavir use in Pediatric COVID-19 Patients: A Retrospective Observational Study, Pediatric Drugs, doi:10.1007/s40272-022-00500-7.
Cao et al., A Trial of Lopinavir–Ritonavir in Adults Hospitalized with Severe Covid-19, New England Journal of Medicine, doi:10.1056/NEJMoa2001282.
Di Castelnuovo et al., Lopinavir/Ritonavir and Darunavir/Cobicistat in Hospitalized COVID-19 Patients: Findings From the Multicenter Italian CORIST Study, Frontiers in Medicine, doi:10.3389/fmed.2021.639970.
Horby (C) et al., Lopinavir–ritonavir in patients admitted to hospital with COVID-19 (RECOVERY): a randomised, controlled, open-label, platform trial, The Lancet, doi:10.1016/S0140-6736(20)32013-4.
Kaizer et al., Lopinavir/ritonavir for treatment of non-hospitalized patients with COVID-19: a randomized clinical trial, International Journal of Infectious Diseases, doi:10.1016/j.ijid.2022.12.028.
Kokturk et al., The predictors of COVID-19 mortality in a nationwide cohort of Turkish patients, Respiratory Medicine, doi:10.1016/j.rmed.2021.106433.
Li et al., Efficacy and Safety of Lopinavir/Ritonavir or Arbidol in Adult Patients with Mild/Moderate COVID-19: An Exploratory Randomized Controlled Trial, Med, doi:10.1016/j.medj.2020.04.001.
Reis (B) et al., Effect of Early Treatment With Hydroxychloroquine or Lopinavir and Ritonavir on Risk of Hospitalization Among Patients With COVID-19 The TOGETHER Randomized Clinical Trial, JAMA Network Open, doi:10.1001/jamanetworkopen.2021.6468.
SOLIDARITY Trial Consortium, Repurposed antiviral drugs for COVID-19; interim WHO SOLIDARITY trial results, NEJM, doi:10.1056/NEJMoa2023184.
Wen et al., The efficacy and safety of lopinavir/ritonavir and arbidol in patients with coronavirus disease 2019, Zhonghua Nei Ke Za Zhi, doi:10.3760/cma.j.cn112138-20200227-00147.