Azvudine reduces COVID-19 risk: real-time meta-analysis of 42 studies
 Control
Abstract
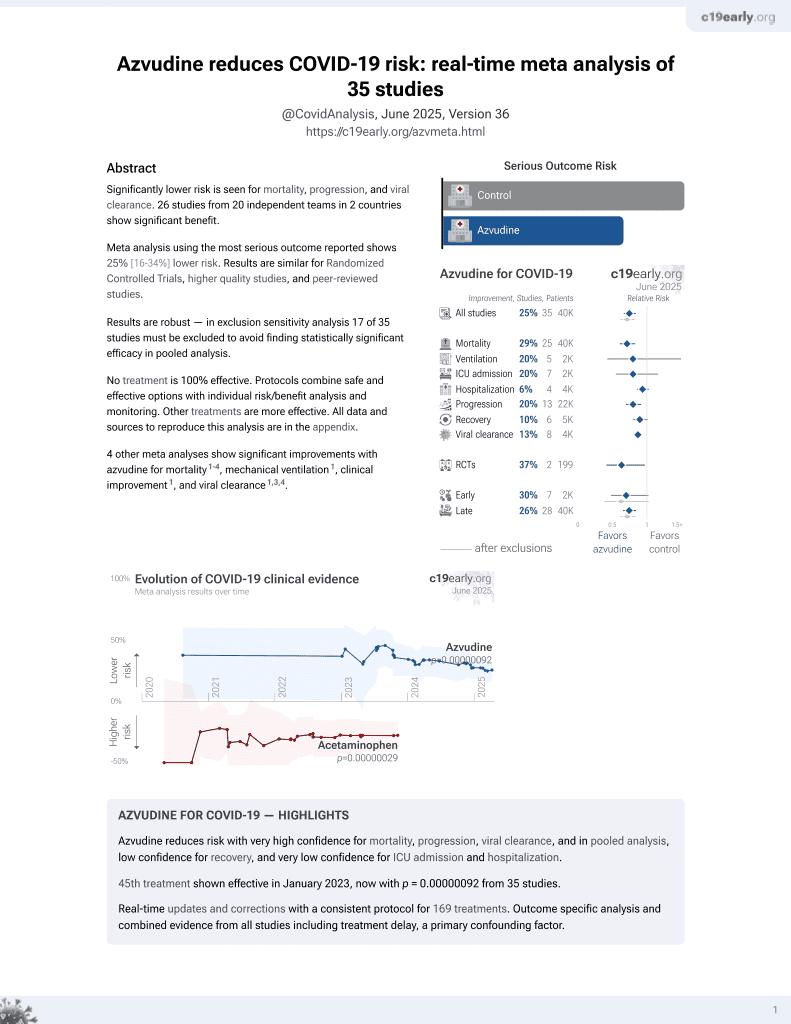
Significantly lower risk is seen for mortality, ICU admission, hospitalization, progression, and viral clearance. 32 studies from 22 independent teams in 2 countries show significant
benefit.
Meta-analysis using the most serious outcome reported shows
27% [19‑33%] lower risk. Results are similar for Randomized Controlled Trials, higher quality studies, and peer-reviewed studies.
Results are very robust—in worst case exclusion sensitivity analysis 22 of
42 studies must be excluded before statistical significance is lost.
Azvudine is a nucleoside analog with potential host cell and organ toxicity. Studies to date highlight liver, reproductive, and hematologic toxicity - there is not the same volume of evidence for harm as there is with remdesivir, but there is also less data overall. Therefore, results may be less favorable with longer follow-up, and long-term morbidity could be an issue. COVID-19 studies show significantly increased risk of liver injury1,2.
No treatment is 100%
effective. Protocols combine safe and effective options with individual
risk/benefit analysis and monitoring.
Other treatments are more effective.
All data and sources to reproduce this analysis are in the appendix.
Azvudine for COVID-19 — Highlights
Azvudine reduces risk with very high confidence for mortality, progression, viral clearance, and in pooled analysis, high confidence for ICU admission and hospitalization, low confidence for recovery, and very low confidence for ventilation.
Studies show significantly increased risk of liver injury.
48th treatment shown effective in January 2023, now with p = 0.0000000021 from 42 studies.
Real-time updates and corrections with a consistent protocol for 225 treatments. Outcome specific analysis and combined evidence from all studies including treatment delay, a primary confounding factor.
B
Loading..
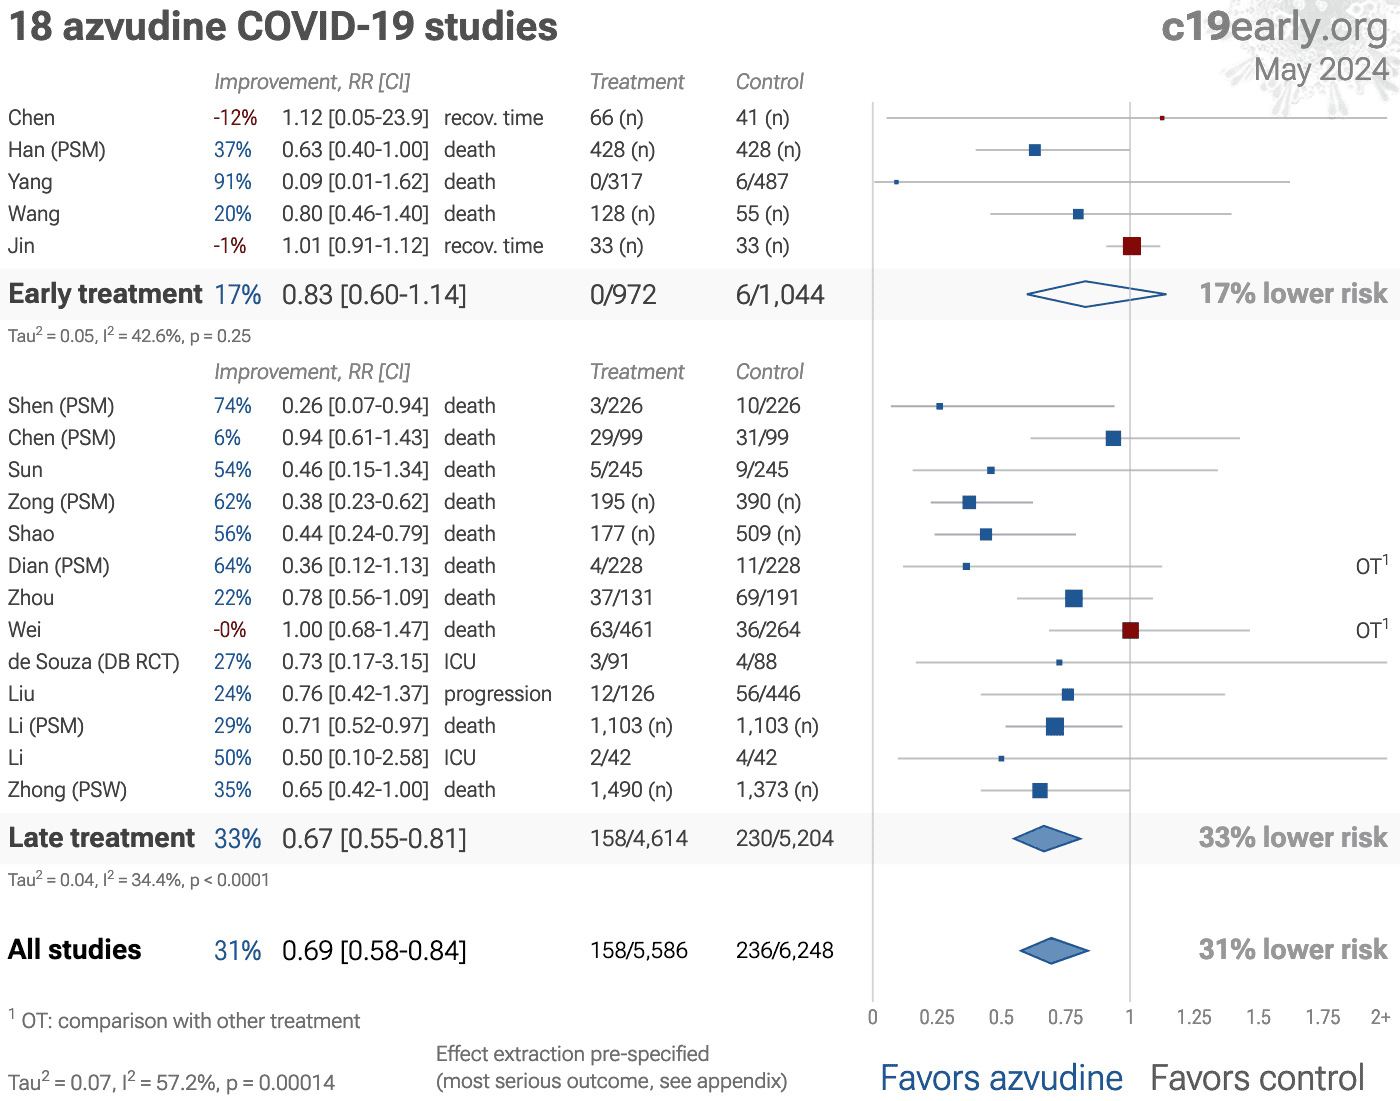
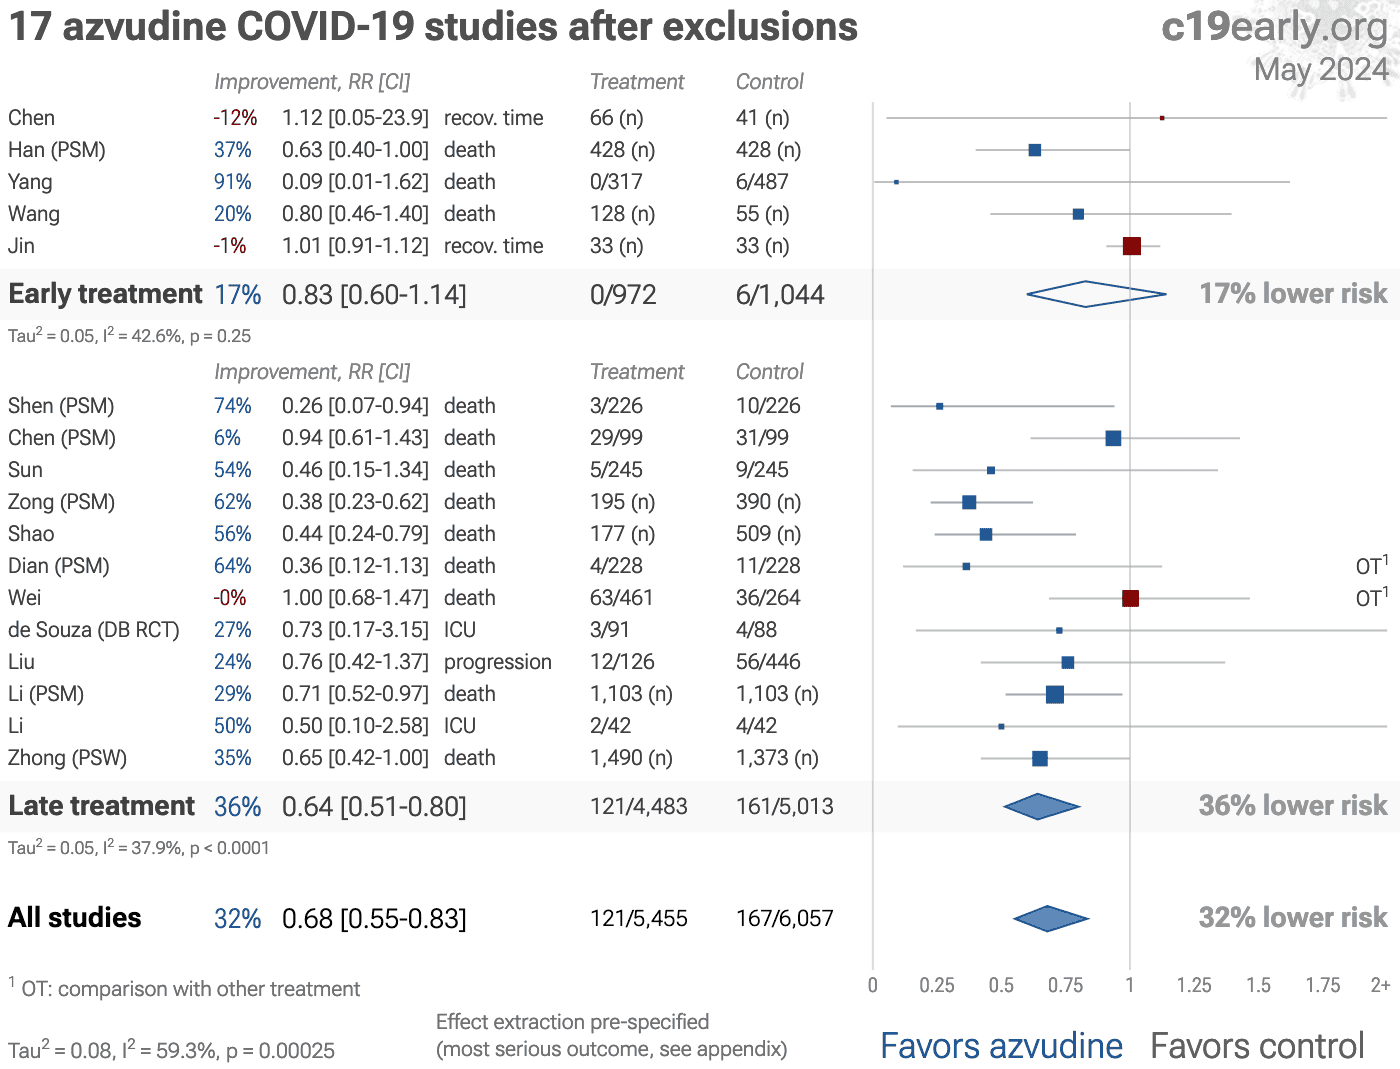
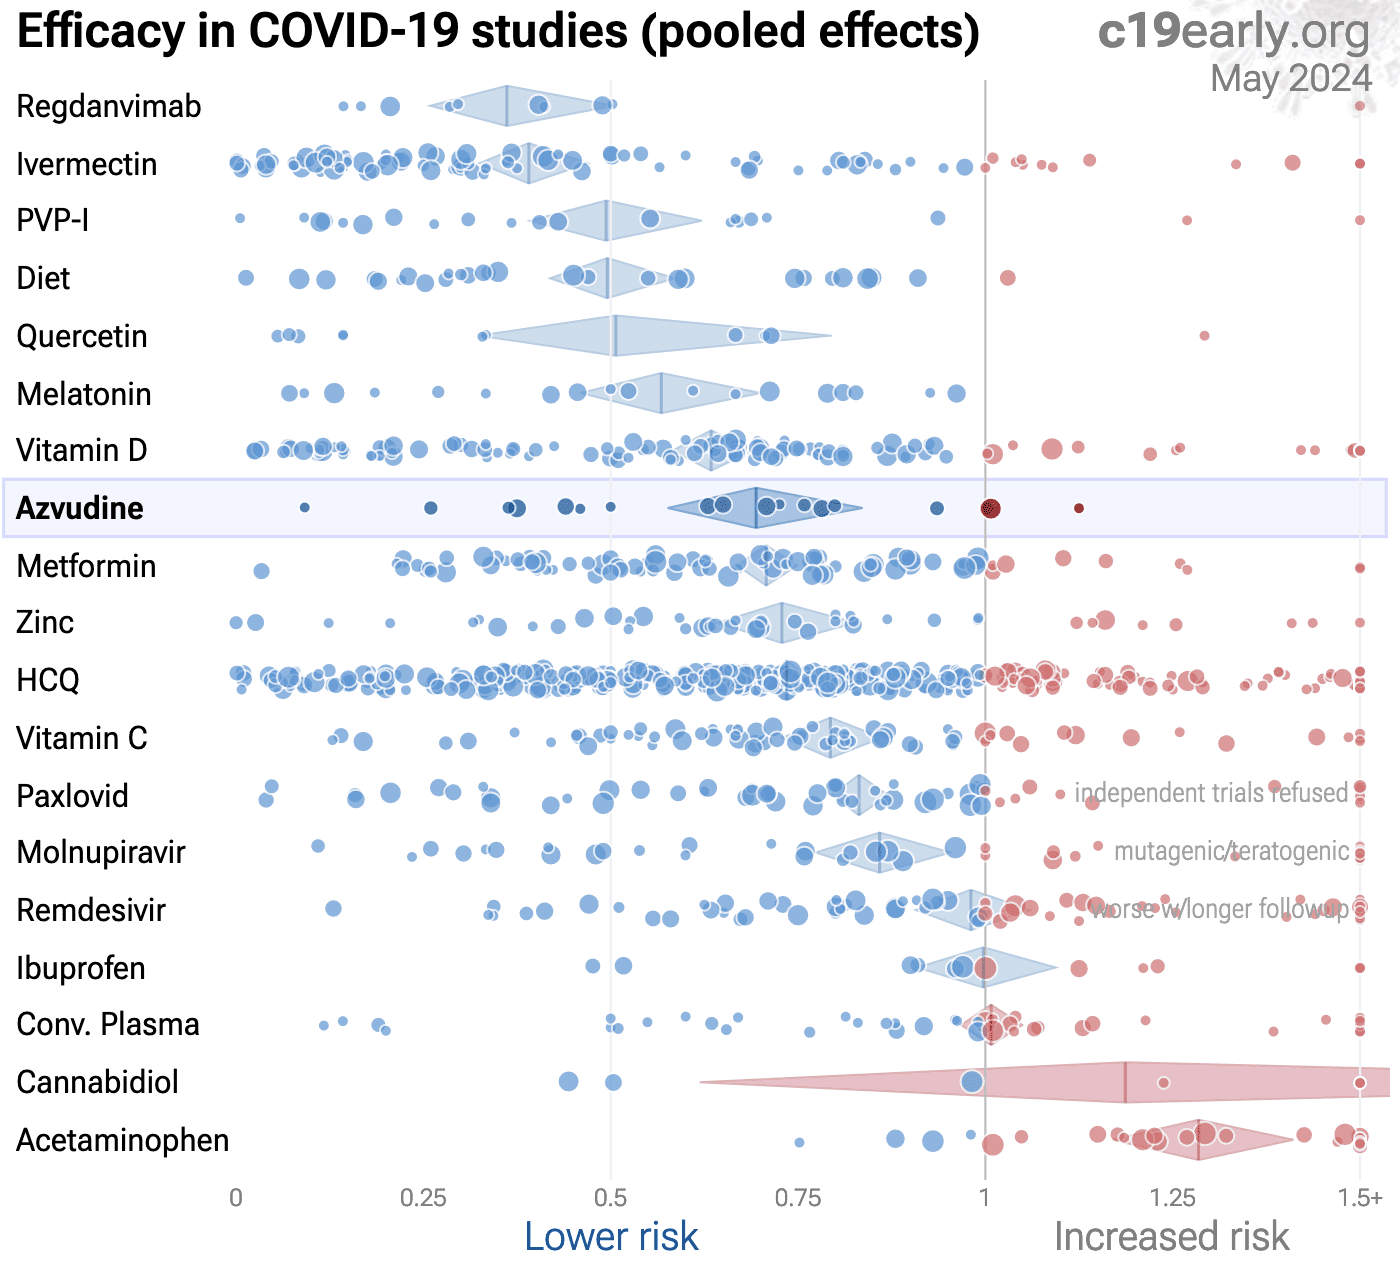
Fig. 1. A. Random-effects meta-analysis. This plot shows pooled effects,
see the specific outcome analyses for individual outcomes.
Analysis validating pooled outcomes for
COVID-19 can be found below.
Effect extraction is pre-specified, using the most serious outcome reported.
For details see the appendix.
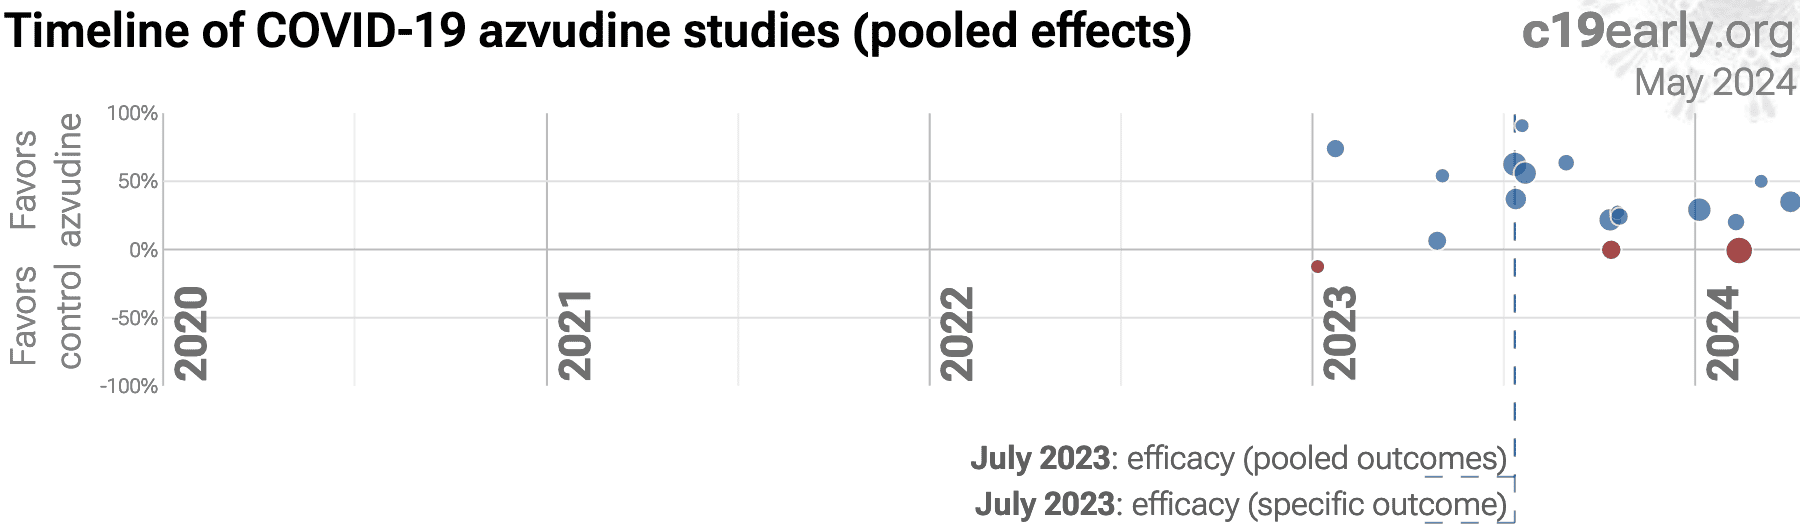
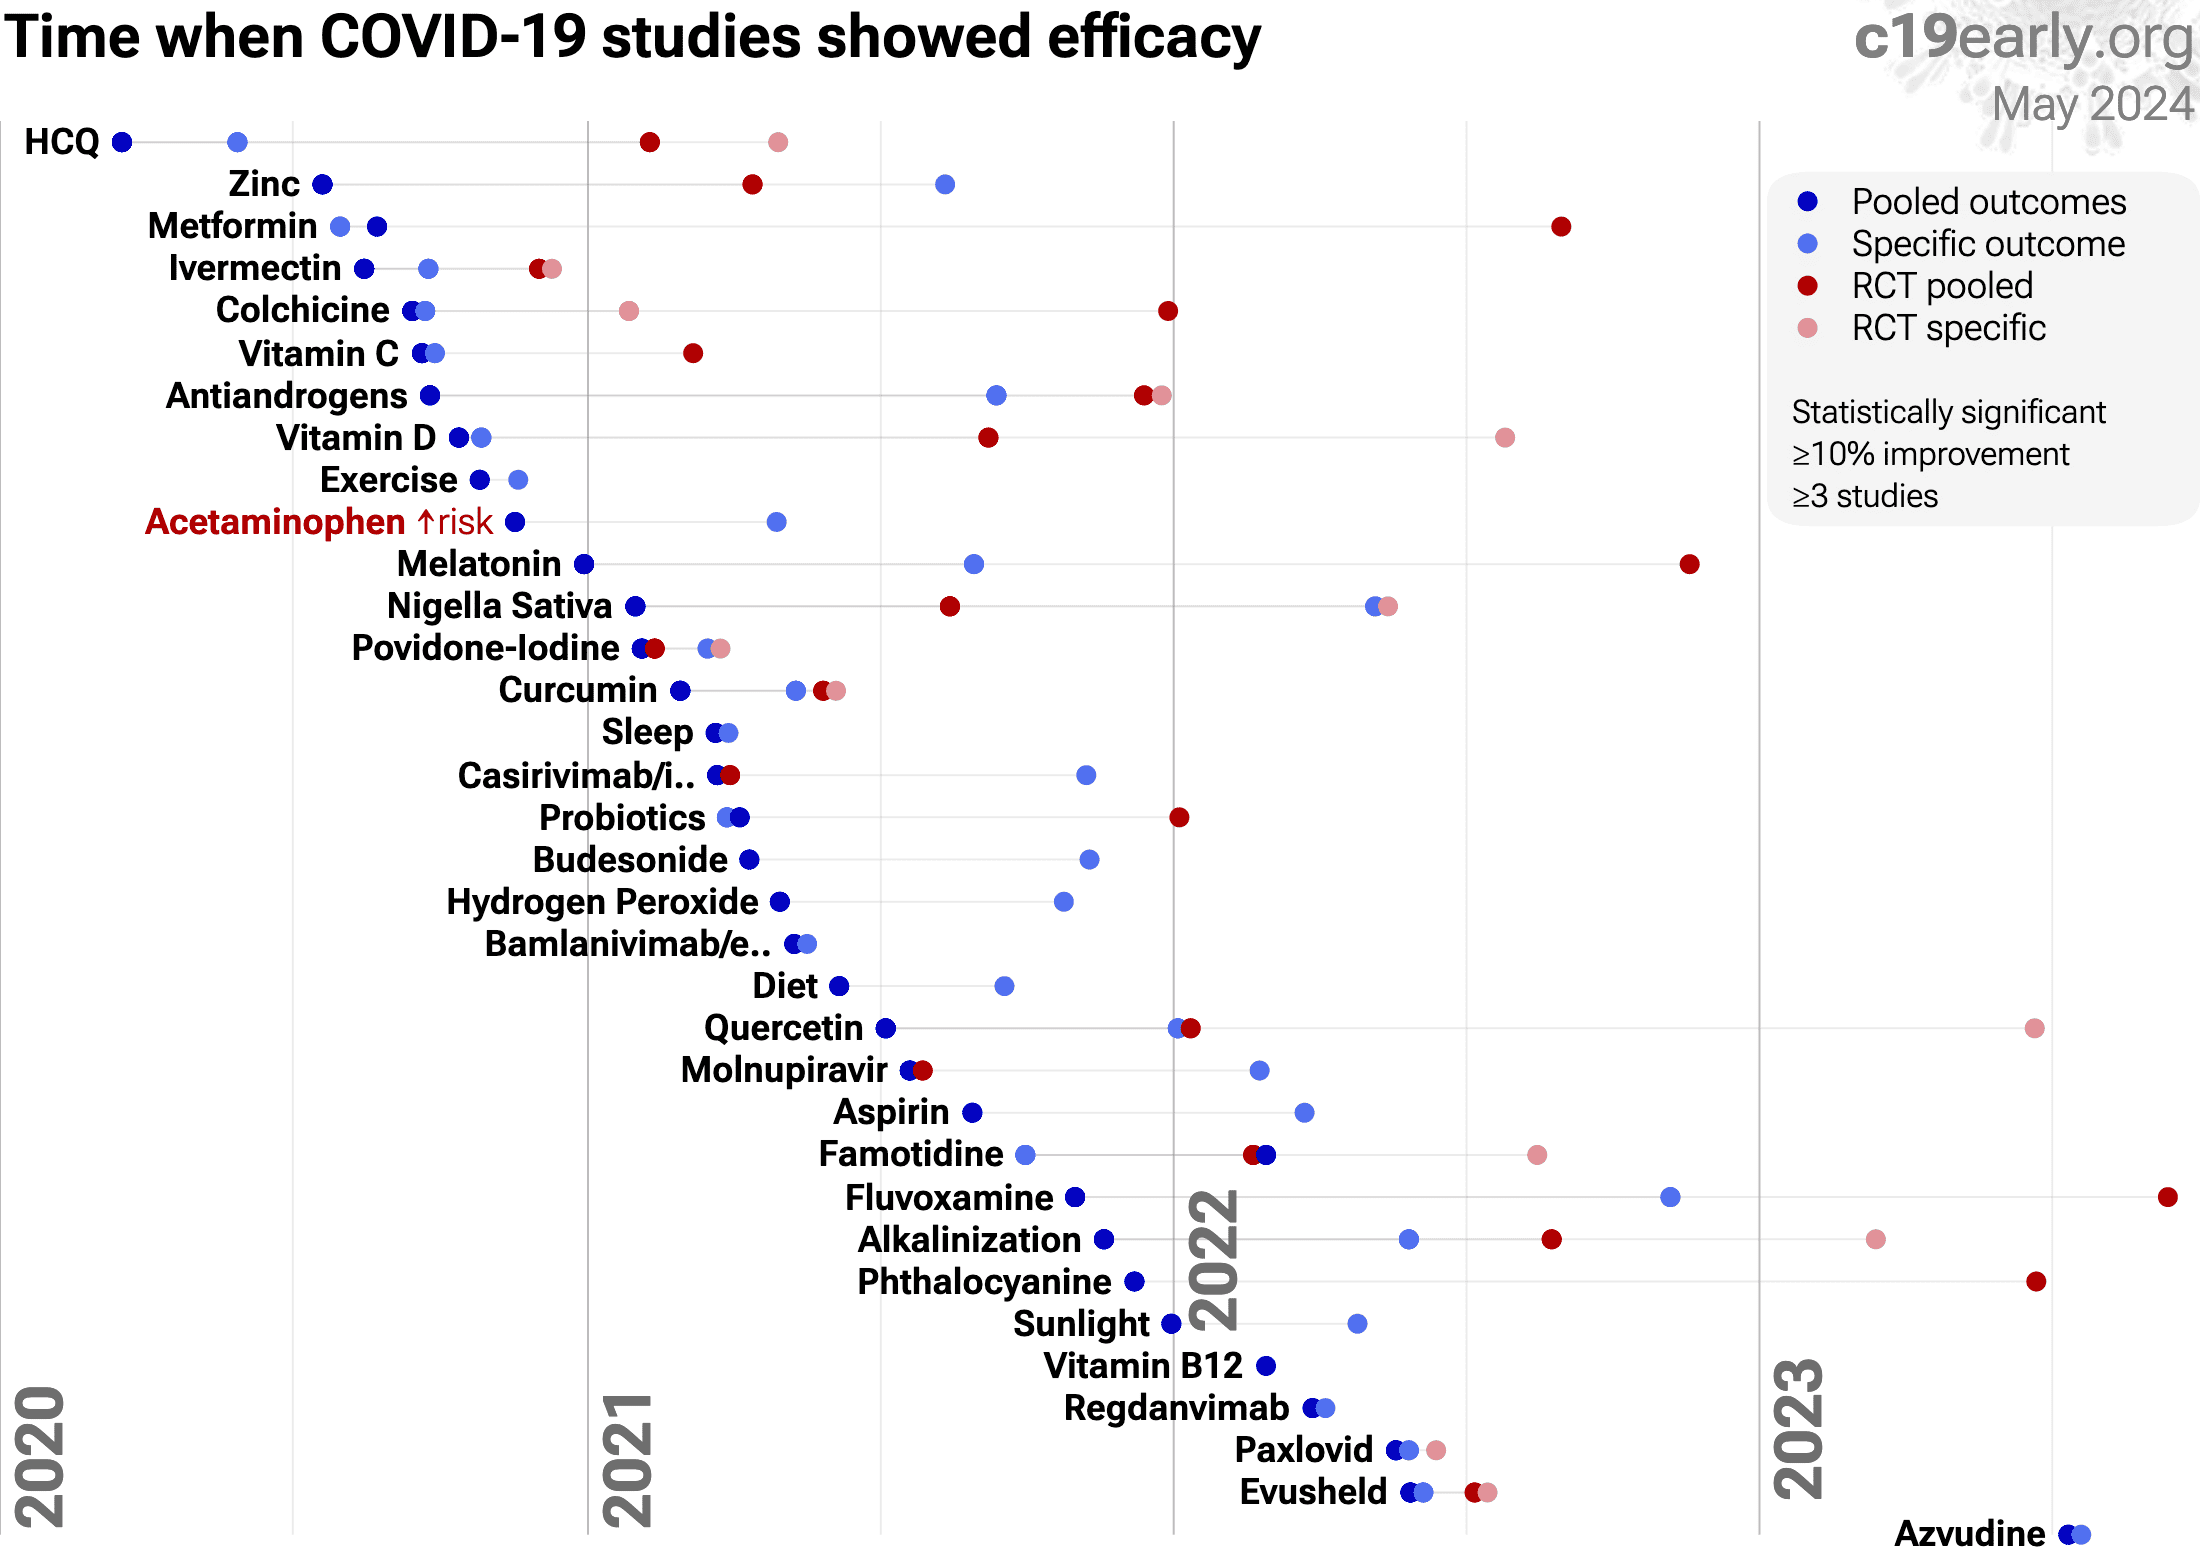
B. Timeline of results in azvudine studies. The marked dates indicate the time when efficacy was known with a statistically significant improvement of ≥10% from ≥3 studies for pooled outcomes and one or more specific outcome. Efficacy based on specific outcomes was delayed by 5.6 months, compared to using pooled outcomes.
SARS-CoV-2 infection primarily begins in the upper respiratory
tract and may progress to the lower respiratory tract, other tissues, and the
nervous and cardiovascular systems, which may lead to cytokine storm,
pneumonia, ARDS, neurological injury9-25 and
cognitive deficits12,17, cardiovascular
complications26-32, DNA
damage33-36, organ failure, and death.
Even mild untreated infections may result in persistent cognitive
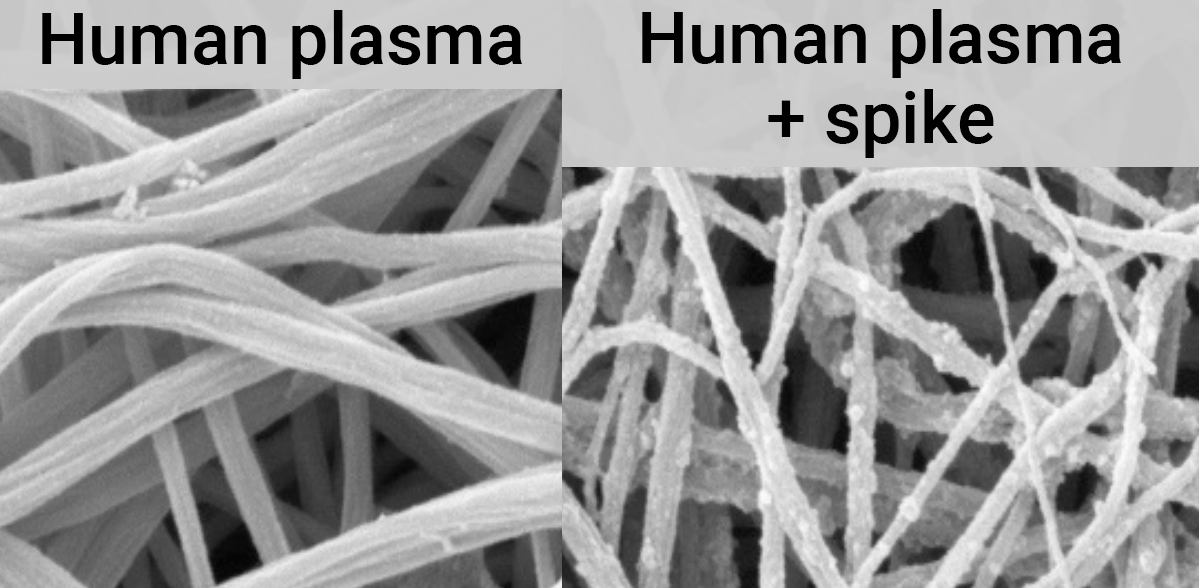
deficits37—the spike protein binds to fibrin leading to
fibrinolysis-resistant blood clots, thromboinflammation, and
neuropathology.
Minimizing replication as early as possible is recommended.
SARS-CoV-2 infection and replication involves the complex interplay of 500+
host and viral proteins and other factorsA,38-45 , providing many
therapeutic targets for which many existing compounds have known activity.
Scientists have predicted that over 11,000 compounds may
reduce COVID-19 risk46, either by
directly minimizing infection or replication, by supporting immune system
function, or by minimizing secondary complications.
Azvudine is a nucleoside reverse transcriptase inhibitor (NRTI), designed to interfere with the replication of RNA viruses. Azvudine targets the viral RNA-dependent RNA polymerase (RdRp), a critical enzyme that SARS-CoV-2 uses to replicate its RNA genome. Azvudine was originally developed for other viral diseases, such as HIV and hepatitis.
We analyze all significant
controlled studies of
azvudine
for COVID-19.
Search methods, inclusion criteria, effect extraction criteria (more serious
outcomes have priority), all individual study data, PRISMA answers, and
statistical methods are detailed in Appendix 1. We present random-effects
meta-analysis results for all studies, studies within each treatment stage, individual outcomes, peer-reviewed studies, Randomized Controlled Trials (RCTs), and higher quality studies.
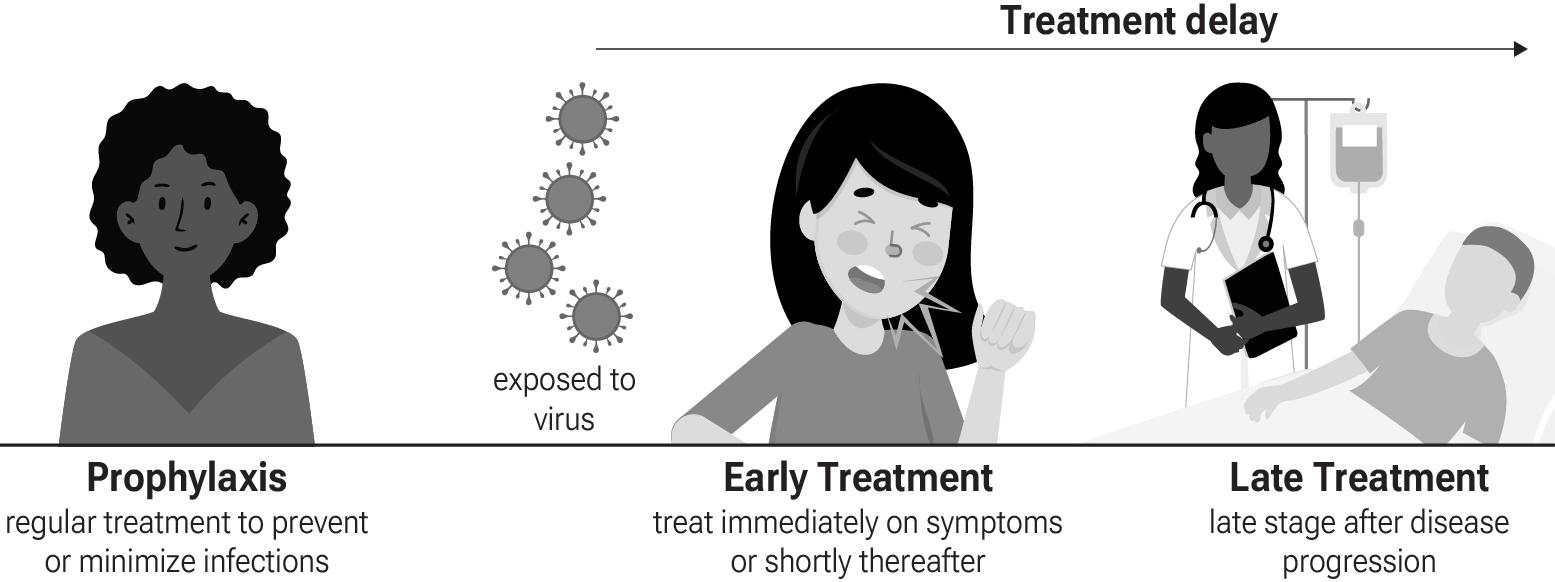
Fig. 3 shows stages of possible treatment for
COVID-19. Prophylaxis refers to regularly taking medication before
becoming sick, in order to prevent or minimize infection. Early
treatment refers to treatment immediately or soon after symptoms appear,
while late treatment refers to more delayed treatment.
Fig. 3. Treatment stages.
An in silico study supports the efficacy of azvudine54.
An in vivo animal study supports the efficacy of azvudine54.
Preclinical research is an important part of the development of
treatments, however results may be very different in clinical trials.
Preclinical results are not used in this paper.
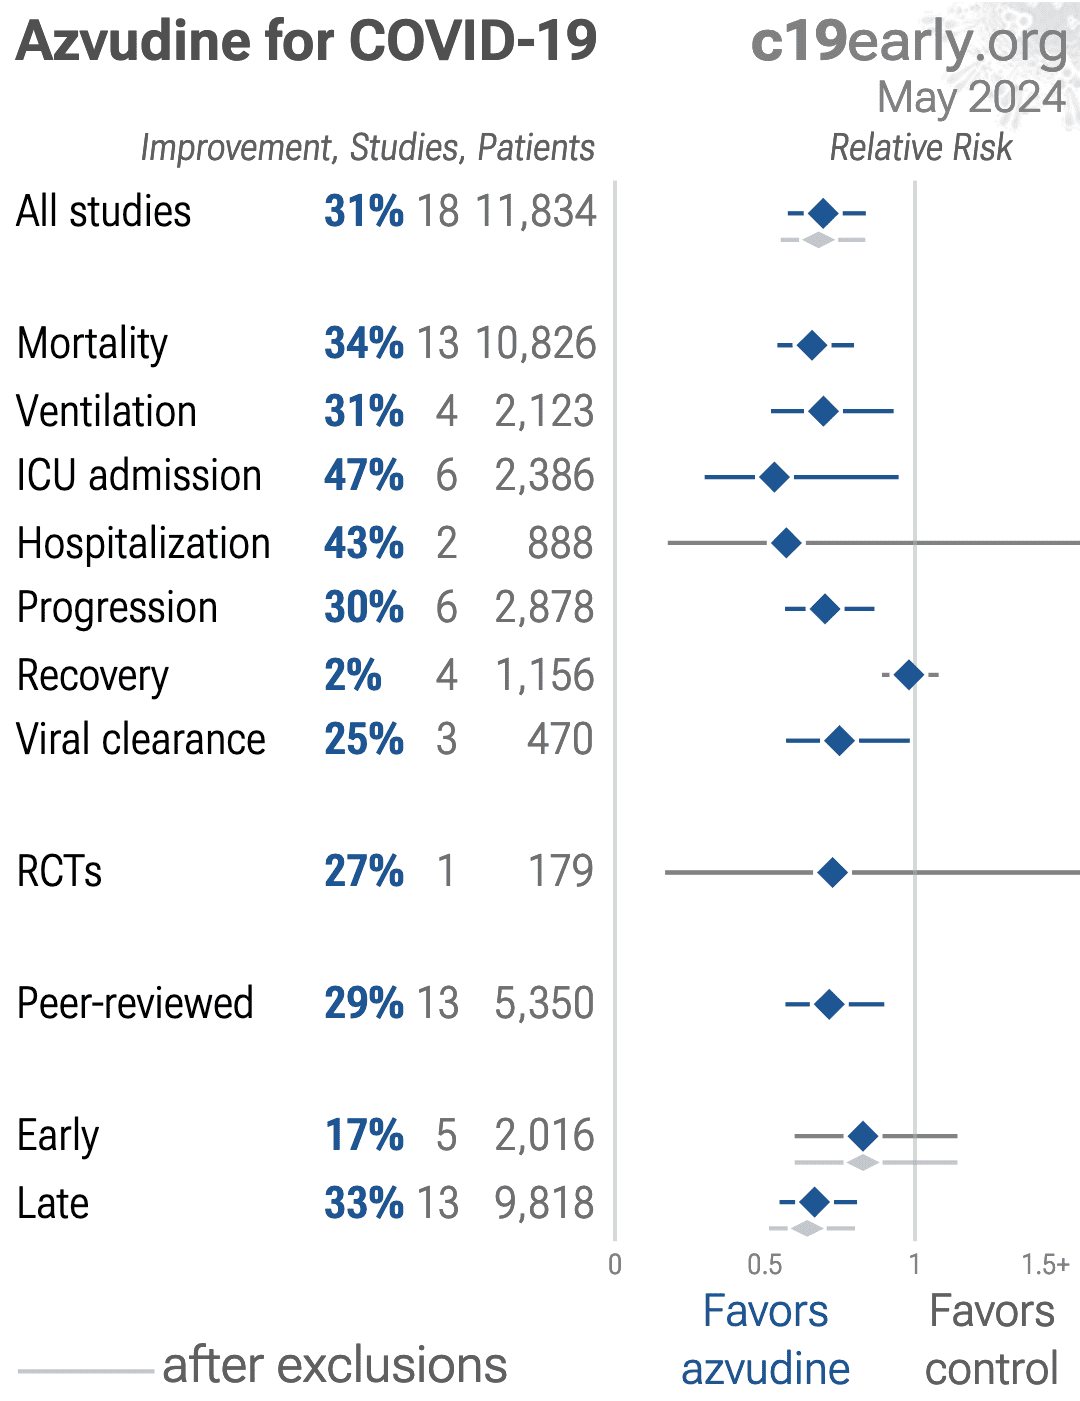
Table 1 summarizes the results for all stages combined, for Randomized Controlled Trials, for peer-reviewed studies, after exclusions, and for specific outcomes.
Table 2 shows results by treatment stage.
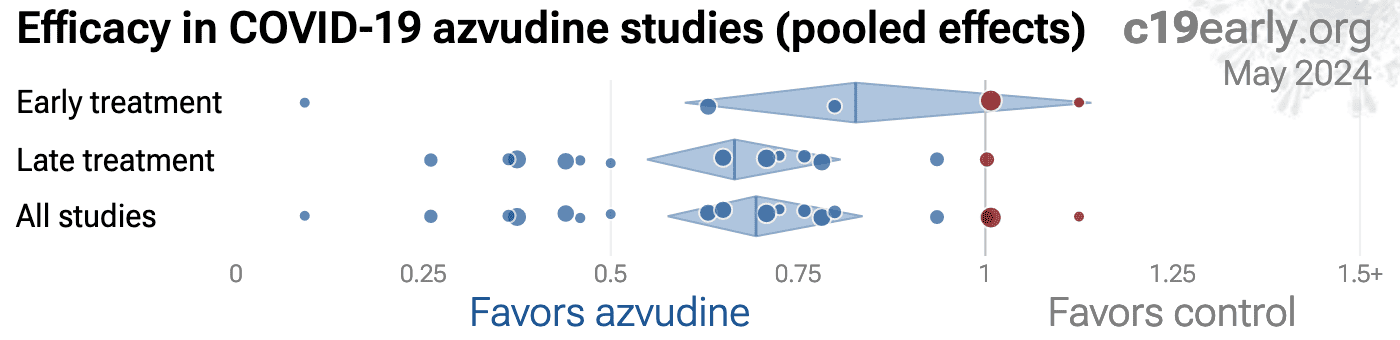
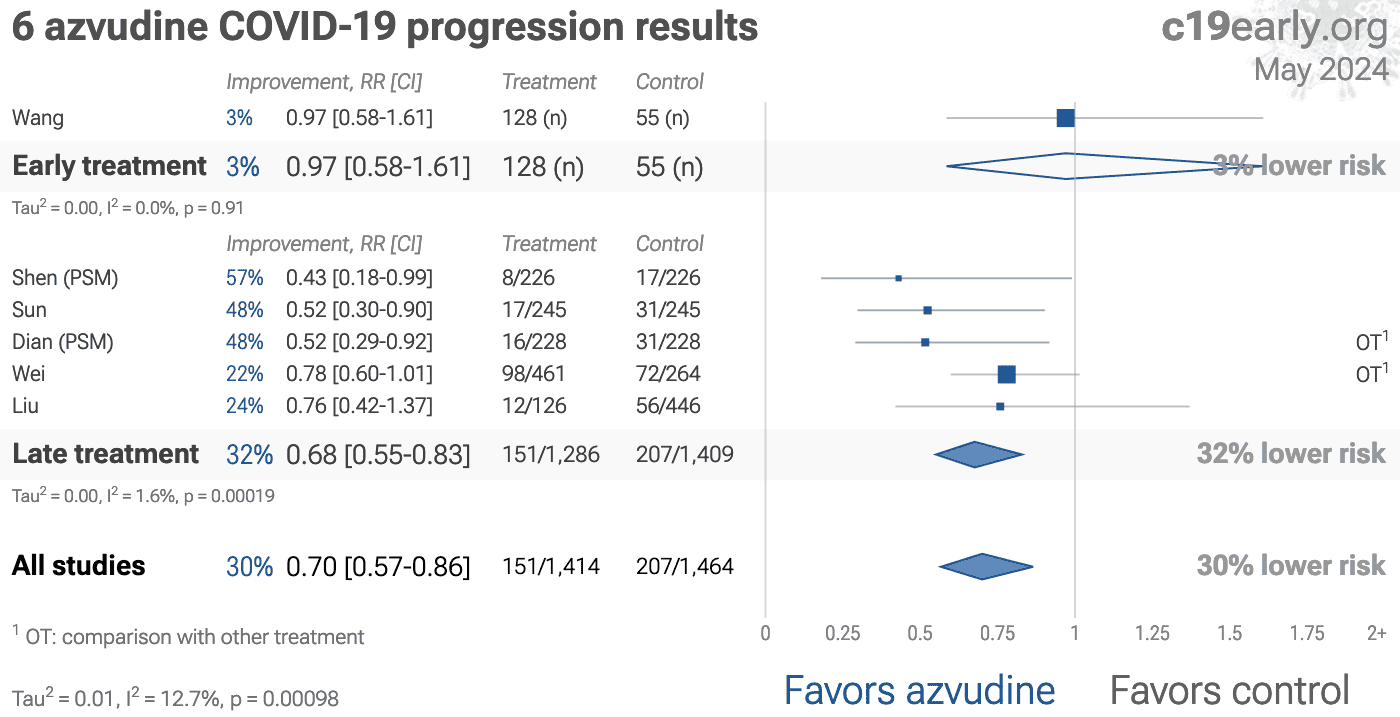
Fig. 4 plots individual results by treatment stage.
Fig. 5, 6, 7, 8, 9, 10, 11, 12, 13, and 14
show forest plots for random-effects meta-analysis of
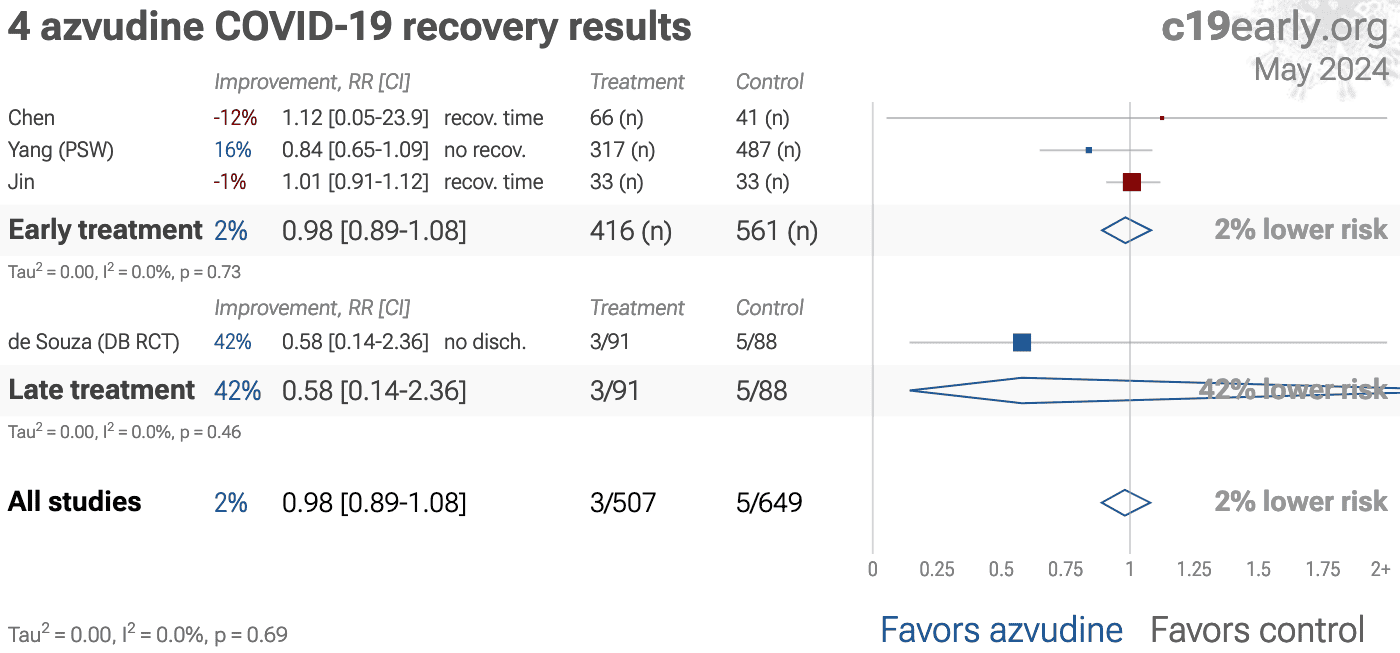
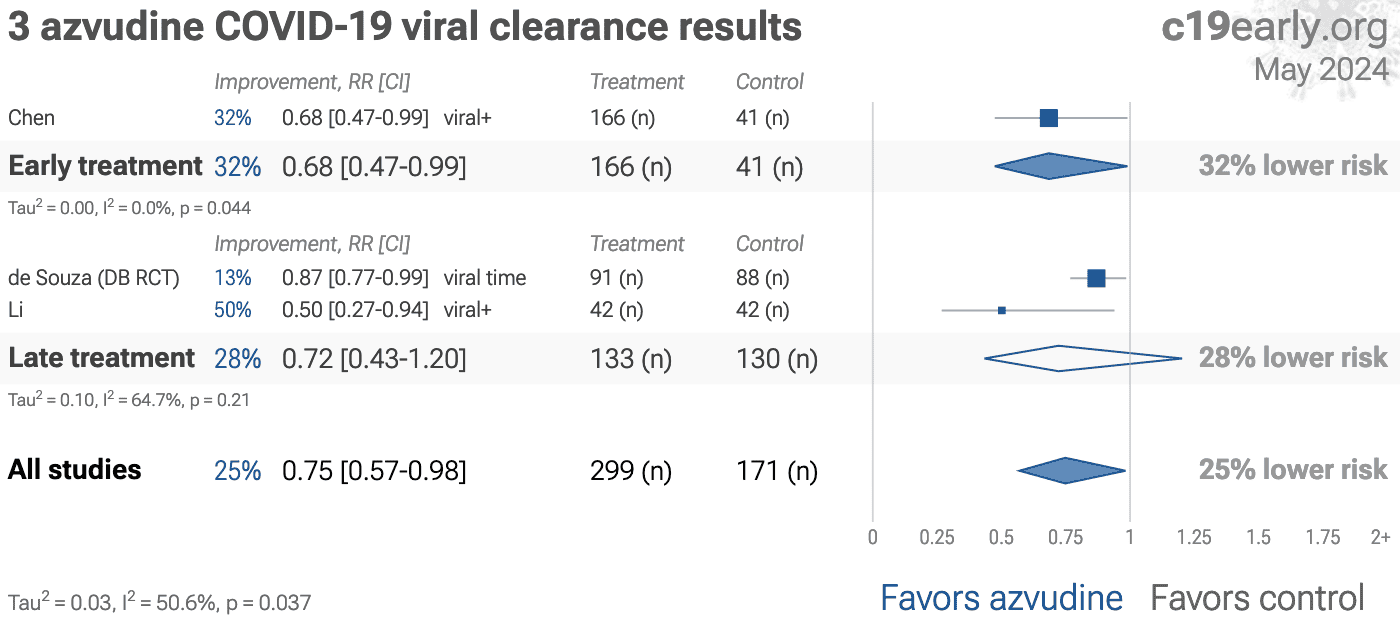
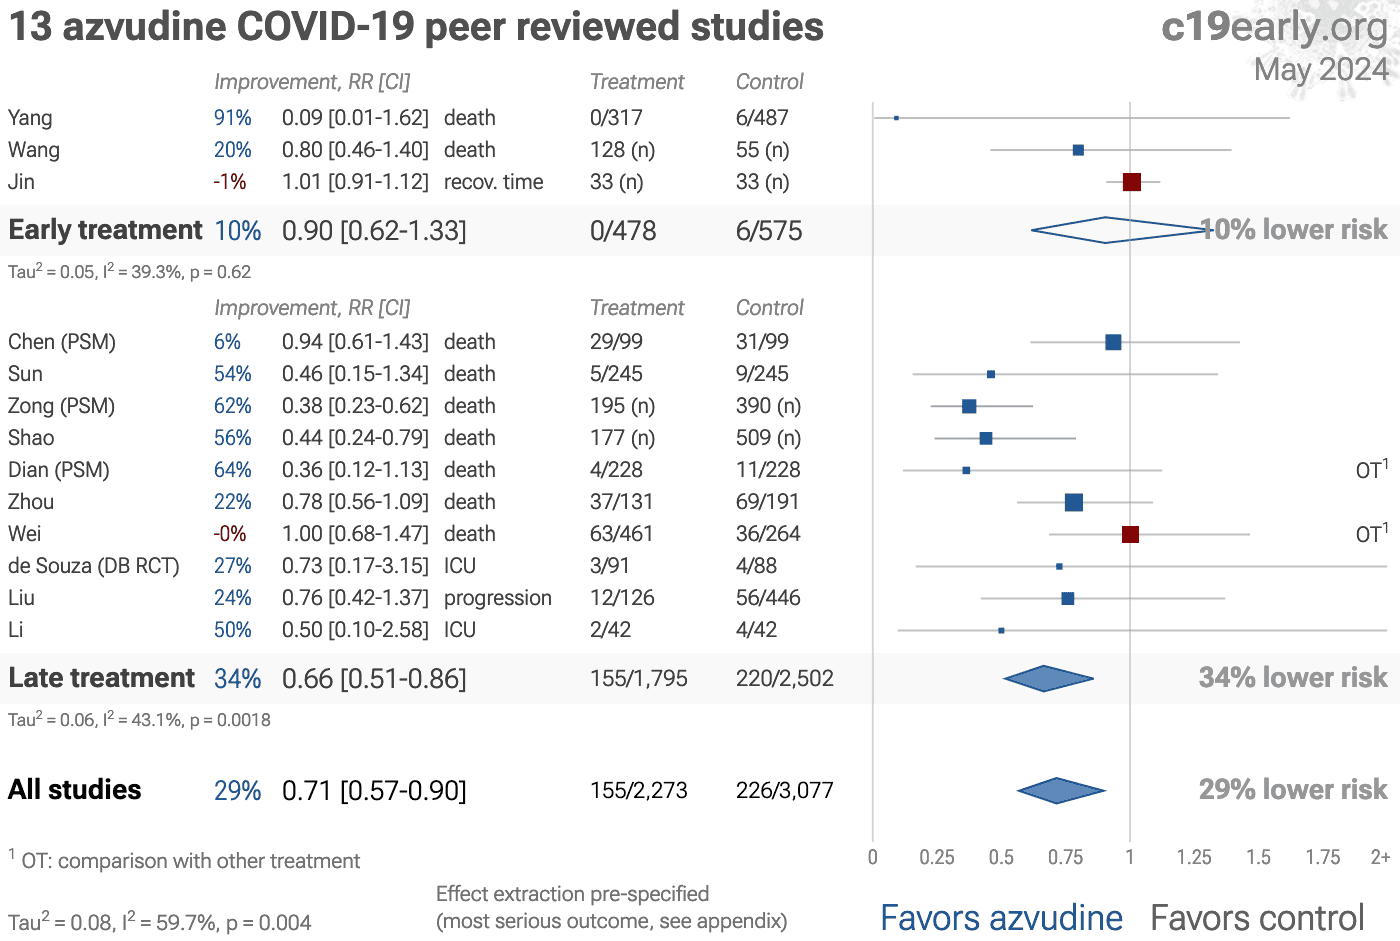
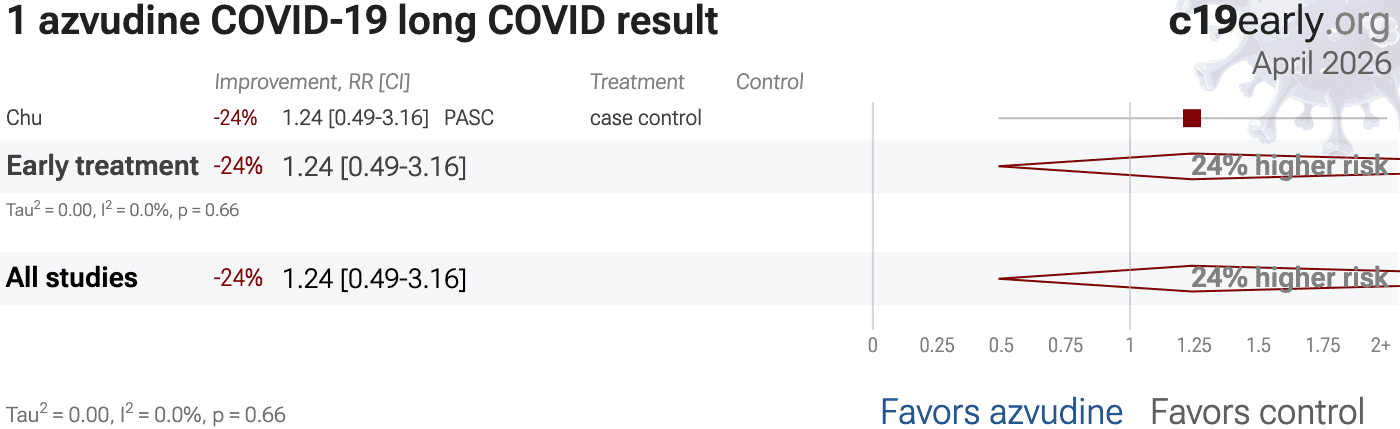
all studies with pooled effects, mortality results, ventilation, ICU admission, hospitalization, progression, recovery, viral clearance, peer reviewed studies, and long COVID.
| Relative Risk | Studies | Patients | |
|---|---|---|---|
| All studies | 0.73 [0.67‑0.81]**** | 42 | 50K |
| After exclusions | 0.72 [0.64‑0.81]**** | 36 | 40K |
| Peer-reviewedPeer-reviewed | 0.75 [0.67‑0.83]**** | 37 | 40K |
| RCTsRCTs | 0.63 [0.41‑0.97]* | 2 | 199 |
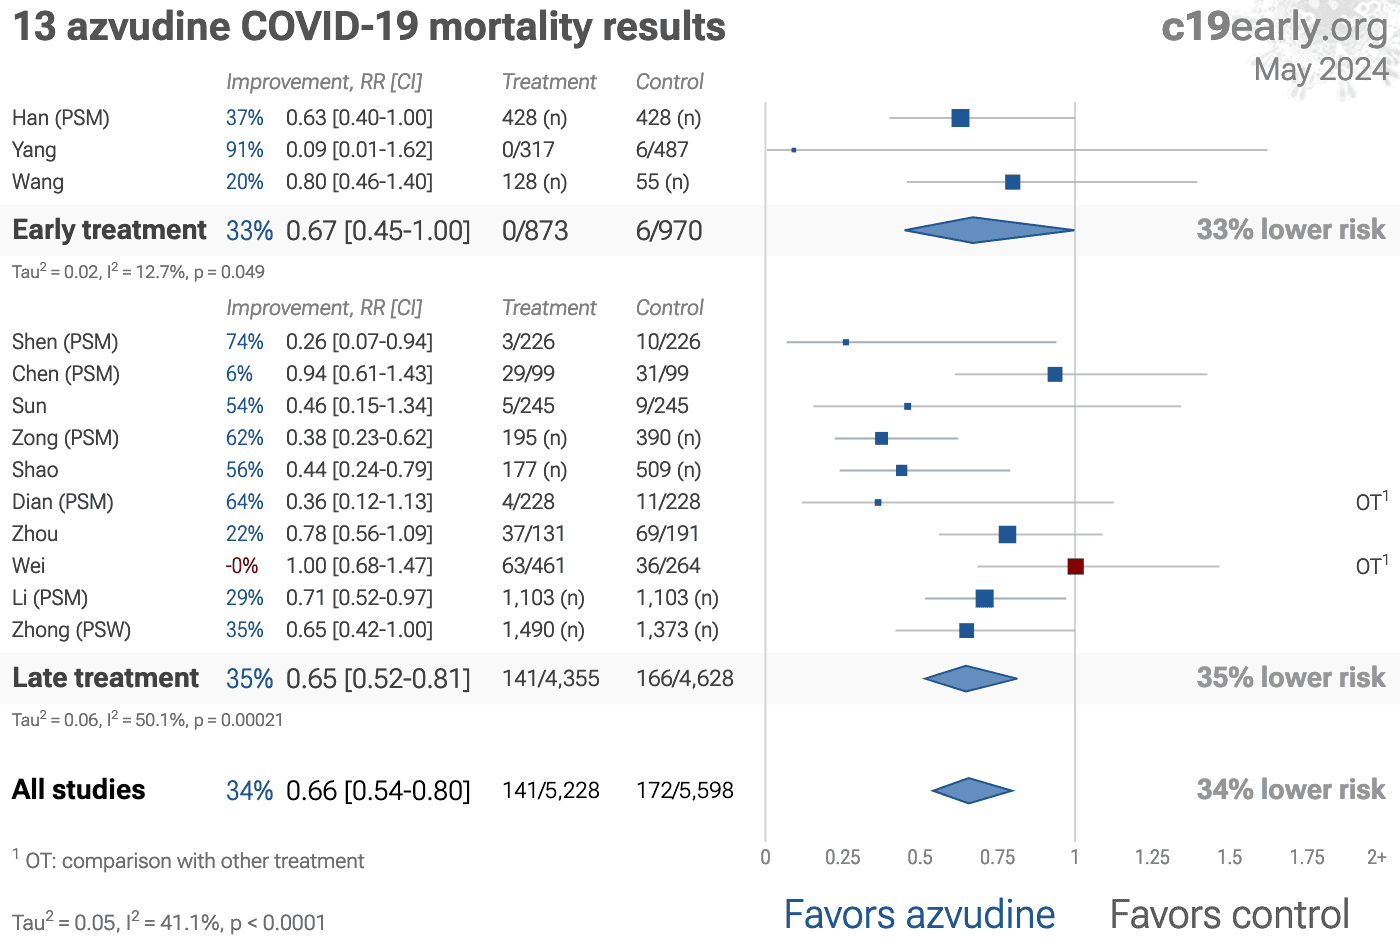
| Mortality | 0.70 [0.61‑0.79]**** | 30 | 50K |
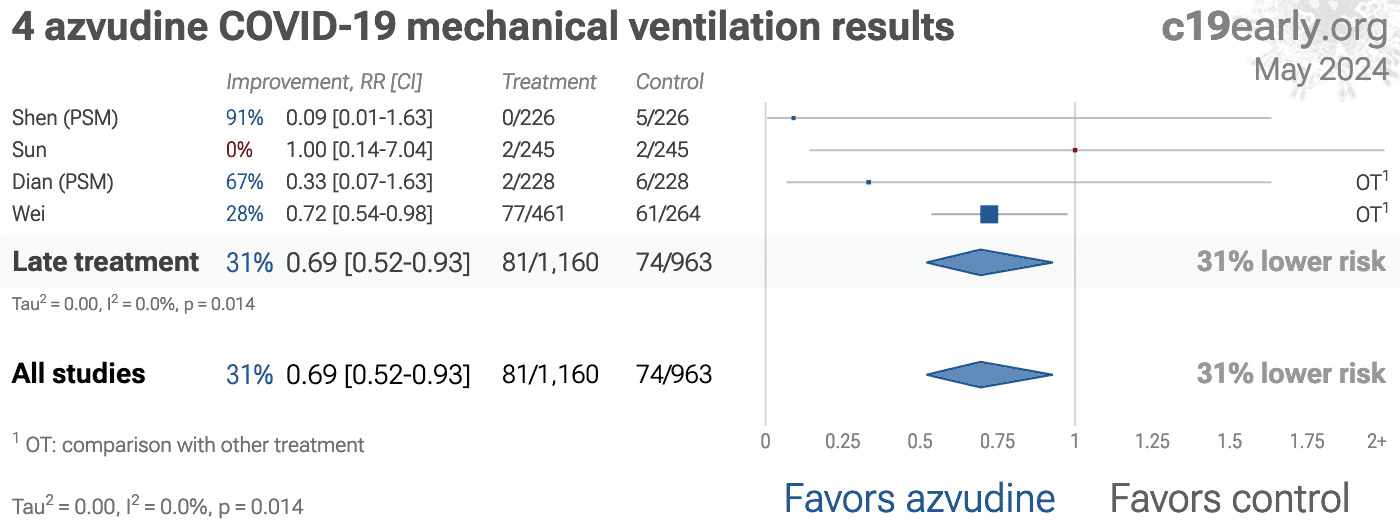
| VentilationVent. | 0.82 [0.61‑1.10] | 6 | 4,531 |
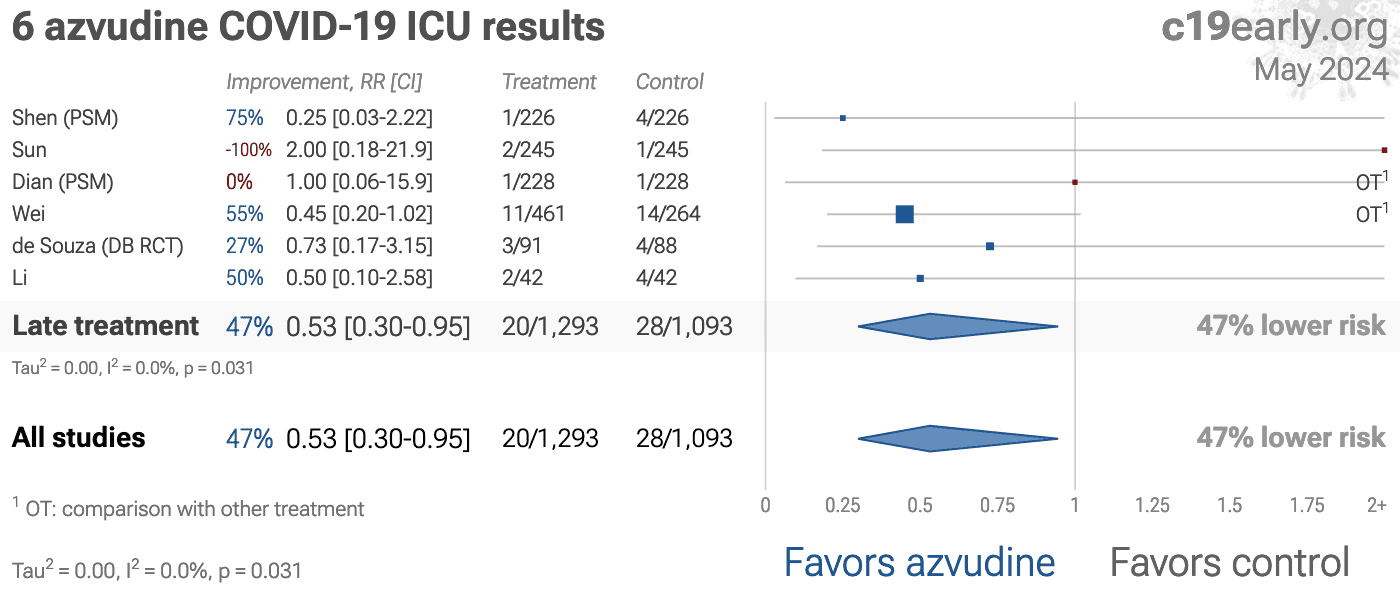
| ICU admissionICU | 0.79 [0.66‑0.95]* | 8 | 4,794 |
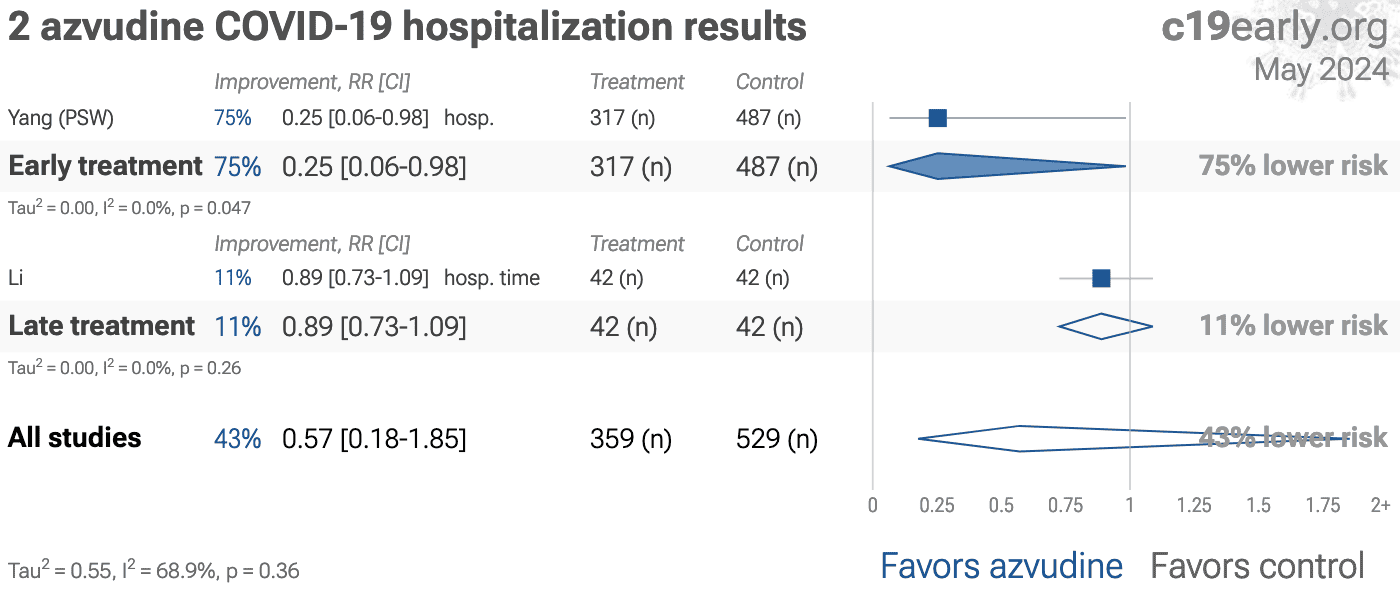
| HospitalizationHosp. | 0.90 [0.81‑1.00]* | 5 | 4,889 |
| Recovery | 0.90 [0.80‑1.01] | 6 | 5,174 |
| Viral | 0.84 [0.78‑0.91]**** | 10 | 6,404 |
| Early treatment | Late treatment | |
|---|---|---|
| All studies | 0.68 [0.48‑0.97]*0.68* [0.48‑0.97] | 0.74 [0.66‑0.82]****0.74**** [0.66‑0.82] |
| After exclusions | 0.64 [0.42‑0.97]*0.64* [0.42‑0.97] | 0.72 [0.64‑0.82]****0.72**** [0.64‑0.82] |
| Peer-reviewedPeer-reviewed | 0.68 [0.45‑1.03]0.68 [0.45‑1.03] | 0.75 [0.67‑0.83]****0.75**** [0.67‑0.83] |
| RCTsRCTs | 0.63 [0.41‑0.97]*0.63* [0.41‑0.97] |
|
| Mortality | 0.48 [0.30‑0.78]**0.48** [0.30‑0.78] | 0.72 [0.63‑0.83]****0.72**** [0.63‑0.83] |
| VentilationVent. | 0.82 [0.61‑1.10]0.82 [0.61‑1.10] |
|
| ICU admissionICU | 0.79 [0.66‑0.95]*0.79* [0.66‑0.95] |
|
| HospitalizationHosp. | 0.25 [0.06‑0.98]*0.25* [0.06‑0.98] | 0.91 [0.83‑1.00]*0.91* [0.83‑1.00] |
| Recovery | 0.98 [0.89‑1.08]0.98 [0.89‑1.08] | 0.83 [0.70‑0.98]*0.83* [0.70‑0.98] |
| Viral | 0.69 [0.58‑0.81]****0.69**** [0.58‑0.81] | 0.88 [0.83‑0.93]****0.88**** [0.83‑0.93] |
Fig. 4. Scatter plot showing the most serious outcome in all studies, and for studies within each stage. Diamonds shows the results of random-effects meta-analysis.
Loading..
Loading..
Fig. 5. Random-effects meta-analysis for all studies.
This plot shows pooled effects,
see the specific outcome analyses for individual outcomes.
Analysis validating pooled outcomes for
COVID-19 can be found below.
Effect extraction is pre-specified, using the most serious outcome reported.
For details see the appendix.
Loading..
Fig. 13. Random-effects meta-analysis for peer reviewed studies.
Zeraatkar et al. analyze 356 COVID-19 trials, finding no significant
evidence that preprint results are inconsistent with peer-reviewed studies.
They also show extremely long peer-review delays, with a median of 6 months to
journal publication. A six month delay was equivalent to around 1.5 million
deaths during the first two years of the pandemic. Authors recommend using
preprint evidence, with appropriate checks for potential falsified data, which
provides higher certainty much earlier. Davidson et al. also showed no
important difference between meta-analysis results of preprints and
peer-reviewed publications for COVID-19, based on 37 meta-analyses including
114 trials.
Effect extraction is pre-specified, using the most serious outcome reported,
see the appendix for details.
Analysis validating pooled outcomes for
COVID-19 can be found below.
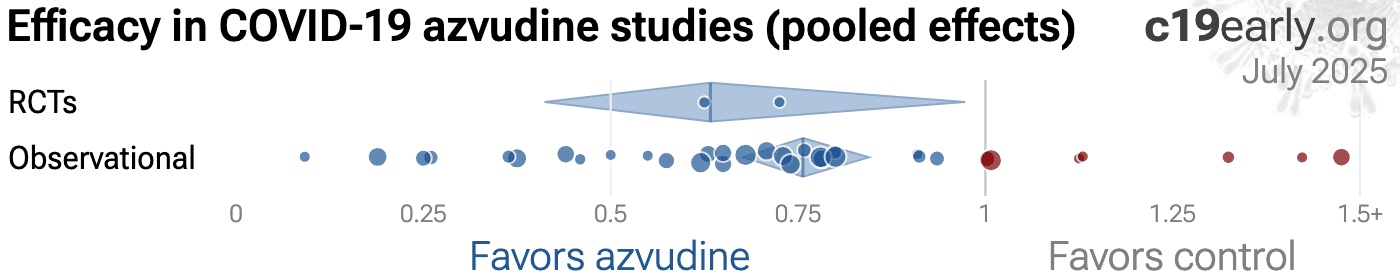
Fig. 15 shows a comparison of results for RCTs and observational studies.
Random-effects meta-analysis of RCTs shows
37% improvement,
compared to 26% for other studies.
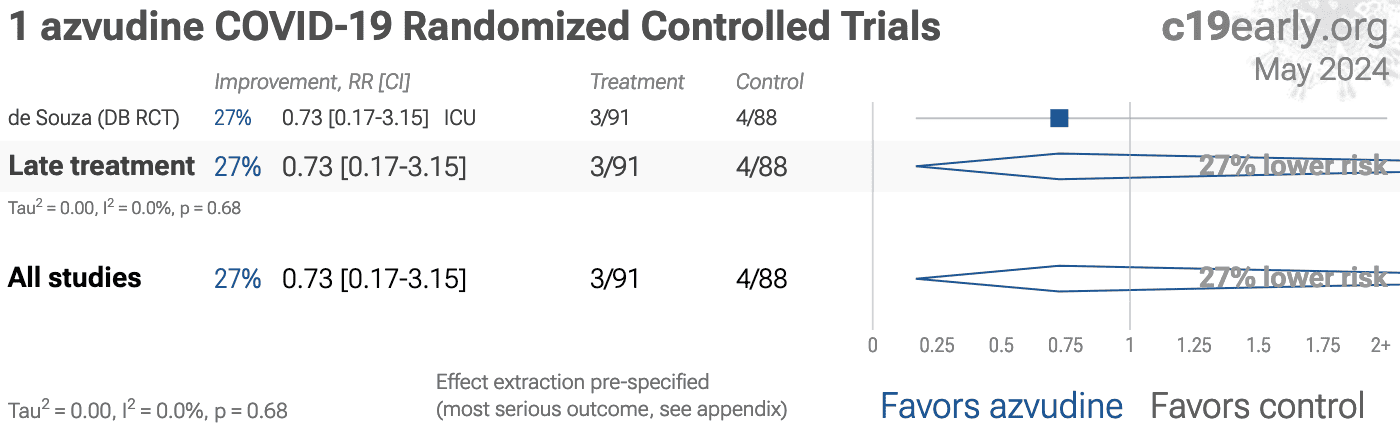
Fig. 16 shows a forest plot for random-effects
meta-analysis of all Randomized Controlled Trials.
RCT results are included in Table 1 and Table 2.
Fig. 15. Results for RCTs and observational studies.
RCTs help to make study groups more similar and can provide a higher level of
evidence, however they are subject to many biases58, and
analysis of double-blind RCTs has identified extreme levels of bias59.
For COVID-19, the overhead may delay treatment, dramatically compromising
efficacy; they may encourage monotherapy for simplicity at the cost of
efficacy which may rely on combined or synergistic effects; the participants
that sign up may not reflect real world usage or the population that benefits
most in terms of age, comorbidities, severity of illness, or other factors;
standard of care may be compromised and unable to evolve quickly based on
emerging research for new diseases; errors may be made in randomization and
medication delivery; and investigators may have hidden agendas or vested
interests influencing design, operation, analysis, reporting, and the
potential for fraud. All of these biases have been observed with COVID-19
RCTs. There is no guarantee that a specific RCT provides a higher level of
evidence.
RCTs are expensive and many RCTs are funded
by pharmaceutical companies or other organizations with conflicts of interest, for example
governments that previously denied treatment with the study drug.
For COVID-19, this creates an incentive to show efficacy for
patented commercial products, and an incentive to show a lack of efficacy for
inexpensive treatments. The bias is expected to be significant, for example
Als-Nielsen et al. analyzed 370 RCTs from Cochrane reviews, showing that
trials funded by for-profit organizations were 5 times more likely to
recommend the experimental drug compared with those funded by nonprofit
organizations. Bekelman et al. and Lundh et al. show that
industry-sponsored studies are more likely to be favorable.
For COVID-19, some major philanthropic organizations are
largely funded by investments with extreme conflicts of interest for and
against specific COVID-19 interventions.
High quality RCTs for novel acute diseases are more challenging, with
increased ethical issues due to the urgency of treatment, increased risk due
to enrollment delays, and more difficult design with a rapidly evolving
evidence base. For COVID-19, the most common site of initial infection is the
upper respiratory tract. Immediate treatment is likely to be most successful
and may prevent or slow progression to other parts of the body. For a
non-prophylaxis RCT, it makes sense to provide treatment in advance and
instruct patients to use it immediately on symptoms, just as some governments
have done by providing medication kits in advance. Unfortunately, no RCTs have
been done in this way. Every treatment RCT to date involves delayed treatment.
Among the 225 treatments we have analyzed,
67% of RCTs involve very late treatment 5+ days after
onset. No non-prophylaxis COVID-19 RCTs match the potential real-world use of
early treatments. They may more accurately represent results for treatments
that require visiting a medical facility, e.g., those requiring intravenous
administration.
Evidence shows that observational studies
can also provide reliable results. Concato et al. found that well-designed
observational studies do not systematically overestimate the magnitude of the
effects of treatment compared to RCTs. Anglemyer et al. analyzed reviews
comparing RCTs to observational studies and found little evidence for
significant differences in effect estimates.
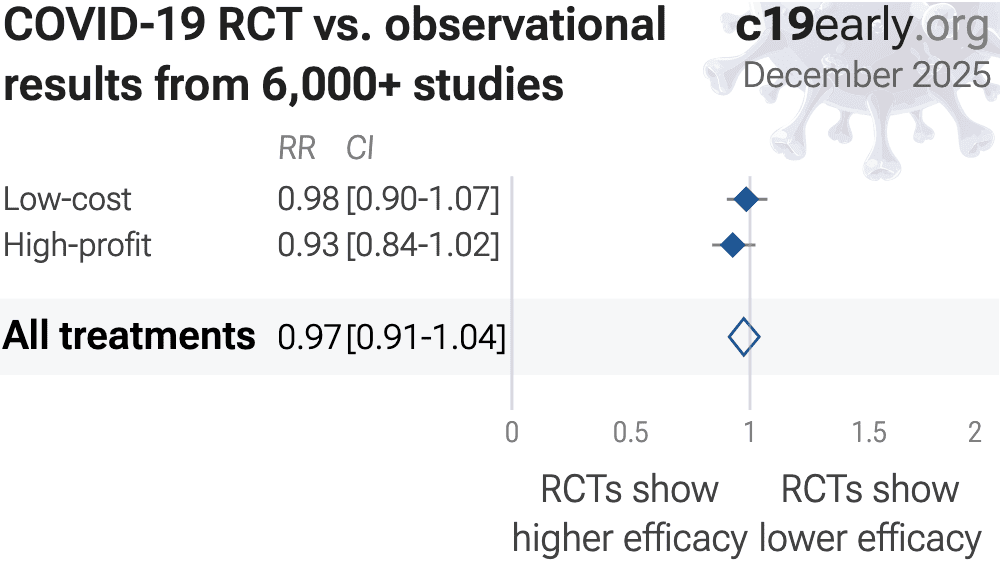
We performed a similar analysis across the 225 treatments
we cover, showing no significant difference in the results of RCTs compared to
observational studies, RR 0.97 [0.91‑1.03]51. Similar results are found for all low-cost treatments, RR
0.98 [0.90‑1.06]. High-cost treatments
show a non-significant trend towards RCTs showing greater efficacy,
RR 0.92 [0.84‑1.02].
Details can be found in the
supplementary data.
Lee et al. showed that only 14% of the guidelines of the Infectious
Diseases Society of America were based on RCTs. Evaluation of studies relies
on an understanding of the study and potential biases. Limitations in an RCT
can outweigh the benefits, for example excessive dosages, excessive treatment
delays, or remote survey bias may have a greater effect on results. Ethical
issues may also prevent running RCTs for known effective treatments. For more
on issues with RCTs see67,68.
Concato et al. report a paradoxical finding—RCT results had higher
variability, and only RCTs were found to sometimes report significant results the opposite
of the overall result. The same trend is seen for the most popular (most politicized)
COVID-19 treatments—considering all statistically significant results reported in
studies, RCTs are slightly more likely to report a result in the opposite direction. In
other words, for these COVID-19 treatments and for the topics covered by Concato et al., assuming causality from a single study is more likely to result in an incorrect conclusion for
RCTs.
Increased risk of inconsistent results for RCTs suggests higher prevalence of
bias, which may arise due to many issues including design bias, conflicts of interest,
treatment differences by physicians aware of allocation, attrition bias, ascertainment
bias, randomization failures, errors, or fraud.
Currently, 59 of the treatments we analyze show statistically significant efficacy or harm, defined as ≥10% decreased risk or >0% increased risk from ≥3 studies. Of these, 54% have been confirmed in RCTs, with a mean delay of 7.8 months (62% with 8.7 months delay for low-cost treatments). The remaining treatments either have no RCTs, or the point estimate is consistent.
Neither observational studies nor RCTs prove causation—any study can be
flawed or fraudulent. We need much more, for example a combination of results from many
independent teams, detailed understanding of each study, knowledge of conflicts/team
reliability, dose-response relationships, delay-response relationships, logical results across outcomes, or details consistent with preclinical expectations.
All studies must be evaluated individually. RCTs for a
given medication and disease may be more reliable, however they may also be
less reliable. For off-patent medications, very high conflict of interest
trials may be more likely to be RCTs, and more likely to be large trials that
dominate meta-analyses.
Loading..
Fig. 16. Random-effects meta-analysis for all Randomized Controlled Trials.
This plot shows pooled effects,
see the specific outcome analyses for individual outcomes.
Analysis validating pooled outcomes for
COVID-19 can be found below.
Effect extraction is pre-specified, using the most serious outcome reported.
For details see the appendix.
To avoid bias in the selection of studies, we analyze all
non-retracted studies. Here we show the results after excluding
studies with major issues likely to alter results, non-standard studies, and
studies where very minimal detail is currently available. Our bias evaluation
is based on analysis of each study and identifying when there is a significant
chance that limitations will substantially change the outcome of the study. We
believe this can be more valuable than checklist-based approaches such as
Cochrane GRADE, which can be easily influenced by potential bias, may ignore
or underemphasize serious issues not captured in the checklists, and may
overemphasize issues unlikely to alter outcomes in specific cases (for example
certain specifics of randomization with a very large effect size and
well-matched baseline characteristics).
The studies excluded are as below.
Fig. 18 shows a forest plot for random-effects
meta-analysis of all studies after exclusions.
Chen, potential significant differential censoring.
Li (B), potential significant differential censoring.
Peng, unadjusted results with no group details.
Yuan, substantial unadjusted confounding by indication likely.
Zhou, substantial unadjusted confounding by indication likely; unadjusted results with no group details.
Zou, unadjusted results with no group details; significant confounding by time possible.
Loading..
Fig. 18. Random-effects meta-analysis for all studies after exclusions.
This plot shows pooled effects,
see the specific outcome analyses for individual outcomes.
Analysis validating pooled outcomes for
COVID-19 can be found below.
Effect extraction is pre-specified, using the most serious outcome reported.
For details see the appendix.
Low-cost treatments were subject to bias and censorship during the pandemic.
Scientific bias is seen in the design, analysis, presentation, and selective
reporting of studies, which often favored negative results. A similar bias is seen in the media
coverage for low-cost treatments.
While broadly seen, bias was particularly notable for ivermectin and hydroxychloroquine, e.g., Scott Alexander noted that "if you say anything in favor of ivermectin you will be cast out of civilization and thrown into the circle of social hell reserved for Klan members and 1/6 insurrectionists. All the health officials in the world will shout 'horse dewormer!' at you and compare you to Josef Mengele."47.
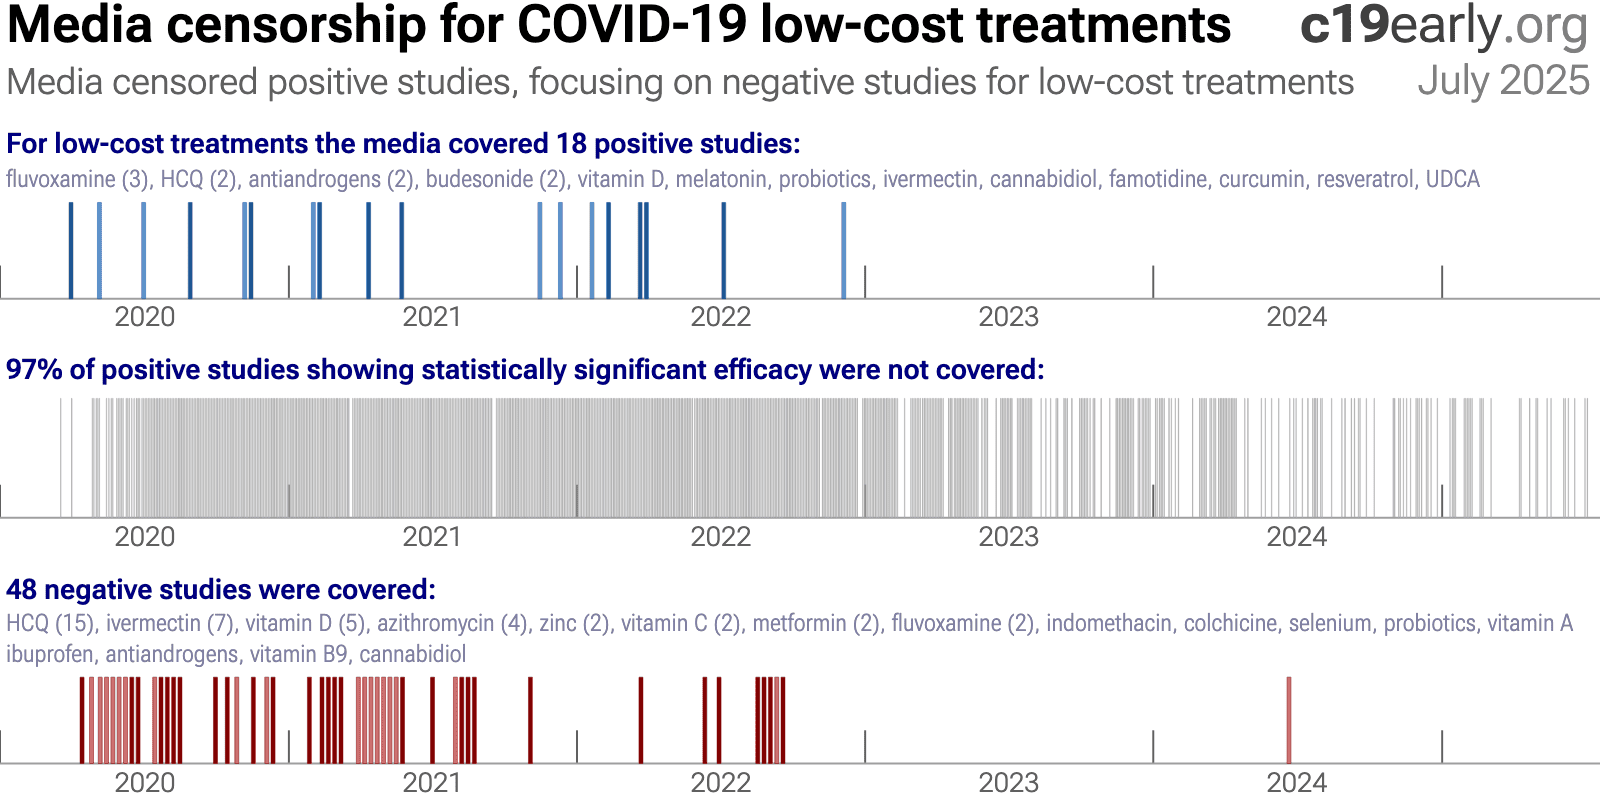
We analyze media coverage for the 225 treatments we cover using
Altmetric74, which reports the number of ~12,000 tracked news outlets that covered each study75. Studies are considered to have received significant media coverage if they were covered by at least 0.5% of the tracked news outlets.
Fig. 19 and 20 show the bias toward negative results for low-cost treatments, in contrast to the opposite bias for high-profit treatments.
Fig. 21 shows the bias toward coverage of negative results for azvudine.
This may result in widespread incorrect perceptions on the relative efficacy of high-profit and low-cost treatments. The impact is significant—increased cost limits the use of high-profit
treatments and treatment equity, and high-profit treatments were also more difficult to access, especially for earlier treatment which improves efficacy and minimizes community transmission.
Fig. 19. Mainstream media was biased against positive results for low-cost treatments.
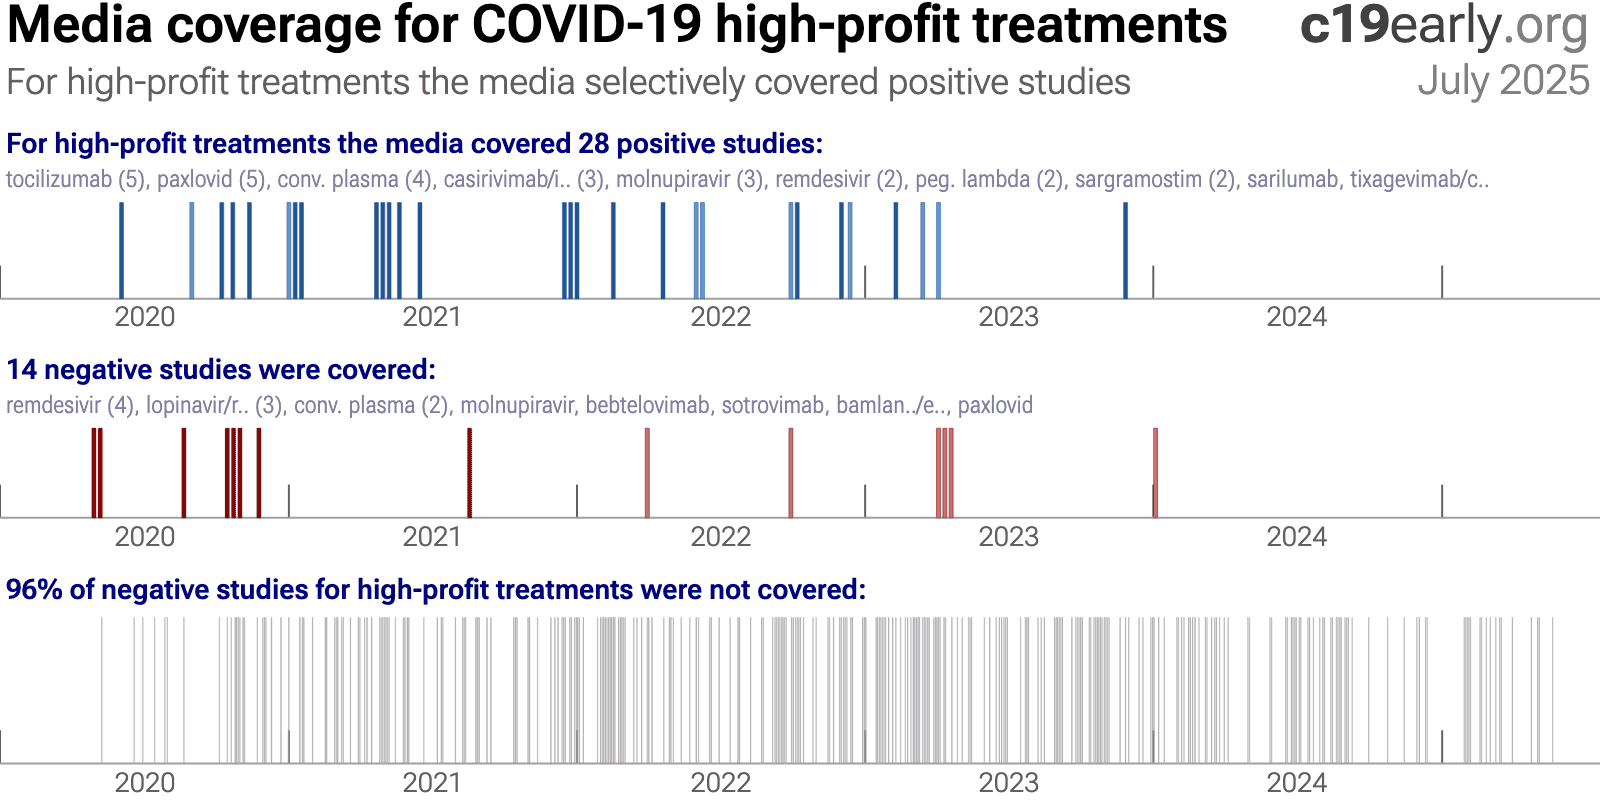
Fig. 20. In contrast to the results for low-cost treatments, mainstream media was biased towards positive results for high-cost treatments.
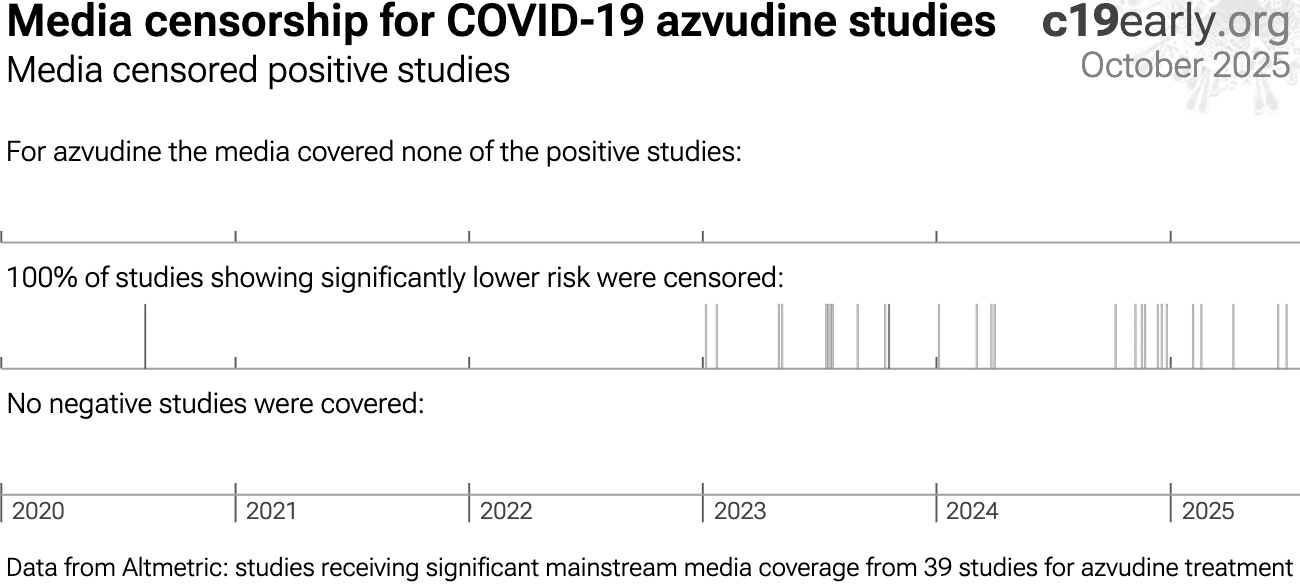
Fig. 21. Mainstream media did not cover any of the studies for azvudine.
A combination of factors may have led to the media's suppression of low-cost treatments:
•
Politicization
led to a media environment where coverage was often framed to support a political
narrative rather than to provide objective scientific information. As Scott Alexander
said: "if you say anything in favor of ivermectin you will be cast out
of civilization and thrown into the circle of social hell reserved for Klan members and
1/6 insurrectionists. All the health officials in the world will shout 'horse dewormer!'
at you and compare you to Josef Mengele."
There was strong social pressure to
discredit low-cost treatments.•
Censorship
of
information conflicting with selected authorities. For example, individuals and
organizations presenting conflicting science were often banned on Twitter and
YouTube.•
FDA requires "no
adequate, approved, and available alternatives"
in order to grant an EUA for
novel high-profit interventions, creating a strong incentive for authorities to ignore or
downplay existing low-cost treatments.•
Regulatory
capture
biases authorities towards high-profit interventions.•
Authorities ignored
most evidence for low-cost treatments
, for example the NIH references only 2% of
studies in delayed, rarely-updated, biased commentaries with no quantitive analysis.•
Media coverage of
science is often not very accurate
, e.g., misunderstanding confounding issues. For
example the media widely considered the RECOVERY HCQ RCT to be conclusive on efficacy, but
very late treatment of late stage patients (mostly on oxygen already) with an excessive
toxic dose (shown dangerous in a dose comparison RCT) provides no information on the
recommended early/prophylactic treatment. With difficulting in understanding basic
confounders like treatment delay and dose, the media may favor deferring to authorities.
Many studies for low-cost treatments require greater expertise to analyze. Relatively few
journalists have a strong ability to analyze clinical trials and are outnumbered by the
rest.•
Substantial funding
from pharmaceutical advertising
biases editorial decisions towards high-profit
interventions.•
PR power
-
companies/teams with strong PR presence are favored in the media, which correlates with
high-profit and high conflict of interest studies.•
The media was very
negative in general
, inflating risk, fear, and anxieties. A negative bias may
improve ratings and revenue, increasing motivation to continue watching coverage. A
combination of low-cost treatments greatly reducing risk conflicts with the negative
narrative.25 low-cost treatments were approved in one
or more countries, yet many countries approved no low-cost treatments.
The countries that did adopt low-cost treatments analyzed the evidence early and made
timely approvals. With few exceptions, authorities did not change their initial views,
regardless of how much evidence accumulated showing either efficacy or harm. Why?
The harms of smoking here hidden for 25 yearsC. Authorities did not analyze the data in real-time, failing to act when
harm was known.
Widespread acknowledgement of harm came only after attempts by two new surgeon generals,
along with pressure from health advocates and a new president, and a review of 7,000 studies.
Similarly for COVID-19, most authorities and experts did not proactively
analyze data in real-time. This guarantees delayed recognition of efficacy or harm, by
which time moral, legal, career, and reputational liabilities strongly disincentivize any
admission of error. Claims of no efficacy (for effective treatments) or safety (for
harmful treatments) were often made prior to strong data being available. Correction
would require admitting to errors that increased mortality, which is unlikely with the
same generation of officials.
Analysis of potential treatments was rarely done, and when done these were
typically minimal efforts.
For example, NIH reviews were highly delayed, cover only a tiny fraction of treatments,
reference only 2% of studies for the treatments covered, and include no
quantitative analysis.
They appear as rarely updated side projects from
external panels implicitly tasked with justifying prior failures.
As with smoking, the thousands of studies could (and should)
have been analyzed and acted on in real-time.
A key structural improvement, applicable to all current and future
diseases, is for authorities to implement real-time proactive analysis of clinical
evidence. This does not remove all bias, but does make it possible to act on evidence,
whereas delayed action may be unlikely due to moral, legal, career, and reputational
liabilities.
c19early.org
Delayed public health acknowledgments
Official acknowledgment of efficacy or harm is often delayed—legal, career, and status risks disincentivize admission of error.
| Evidence | Official Acknowledgment | Approx. Delay | |
|---|---|---|---|
| Citrus Fruit (vitamin C) for Scurvy (effectiveness) | 1747: James Lind conducted one of the first-ever controlled clinical trials, proving that oranges and lemons cured scurvy in sailors. | 1795: The British Royal Navy finally made a daily ration of lemon juice a standard issue for all its sailors, effectively eliminating the disease. | 48 years |
| Handwashing (lower mortality) | 1847: Dr. Ignaz Semmelweis provided conclusive proof that having doctors wash their hands with a chlorine solution before delivering babies reduced maternal mortality rates from over 18% to around 1%. | ~1870s: Semmelweis's findings were rejected and he was ridiculed. His work was only validated decades later (after his death). | ~20+ years |
| Helicobacter pylori (bacteria causes ulcers) | 1982-1984: Marshall and Warren discovered that Helicobacter pylori bacteria causes ulcers, confirmed via direct exposure. Officials maintained that ulcers were caused by stress and spicy food. | 1994: The US NIH released a consensus statement officially recommending antibiotics as the standard treatment for peptic ulcers, overturning decades of acid-suppression therapy. | ~12 years |
| Asbestos (causes asbestosis & cancer) | 1924: The British Medical Journal published the first case study of a death from "asbestosis." By 1918, U.S. insurance companies had stopped selling life insurance to asbestos workers. | 1971 (US): The Occupational Safety and Health Administration (OSHA) was formed and began regulating asbestos as a carcinogen, setting the first federal workplace safety standards for it. | ~47 years |
| Leaded Gasoline (neurotoxicity) | ~1924: Dangers of low-level lead exposure were known. Experts like Alice Hamilton warned the U.S. Surgeon General that adding lead to gasoline would cause widespread public poisoning. | 1973 (US): The Environmental Protection Agency (EPA) ordered the first phasedown of lead in gasoline, following the Clean Air Act of 1970. A full ban for on-road vehicles took effect in 1996. | ~49 years |
| Harms of Smoking (causes lung cancer) | 1939: Franz Müller (Germany) published the first case-control epidemiological study strongly linking tobacco smoking to lung cancer. This was followed by major U.S. & U.K. studies in the 1950s. | 1964 (US): The U.S. Surgeon General's report, "Smoking and Health," was released. It was the first U.S. government report to definitively link smoking to lung cancer and heart disease. | 25 years |
Heterogeneity in COVID-19 studies arises from many factors including:
The time between infection or the onset of symptoms and
treatment may critically affect how well a treatment works. For example an
antiviral may be very effective when used early but may not be effective in
late stage disease, and may even be harmful. Oseltamivir, for example, is
generally only considered effective for influenza when used within 0-36 or
0-48 hours76,77. Baloxavir marboxil studies for influenza
also show that treatment delay is critical — Ikematsu et al. report
an 86% reduction in cases for post-exposure prophylaxis, Hayden et al.
show a 33 hour reduction in the time to alleviation of symptoms for treatment
within 24 hours and a reduction of 13 hours for treatment within 24-48 hours,
and Kumar et al. report only 2.5 hours improvement for inpatient
treatment.
| Treatment delay | Result |
| Post-exposure prophylaxis | 86% fewer cases78 |
| <24 hours | -33 hours symptoms79 |
| 24-48 hours | -13 hours symptoms79 |
| Inpatients | -2.5 hours to improvement80 |
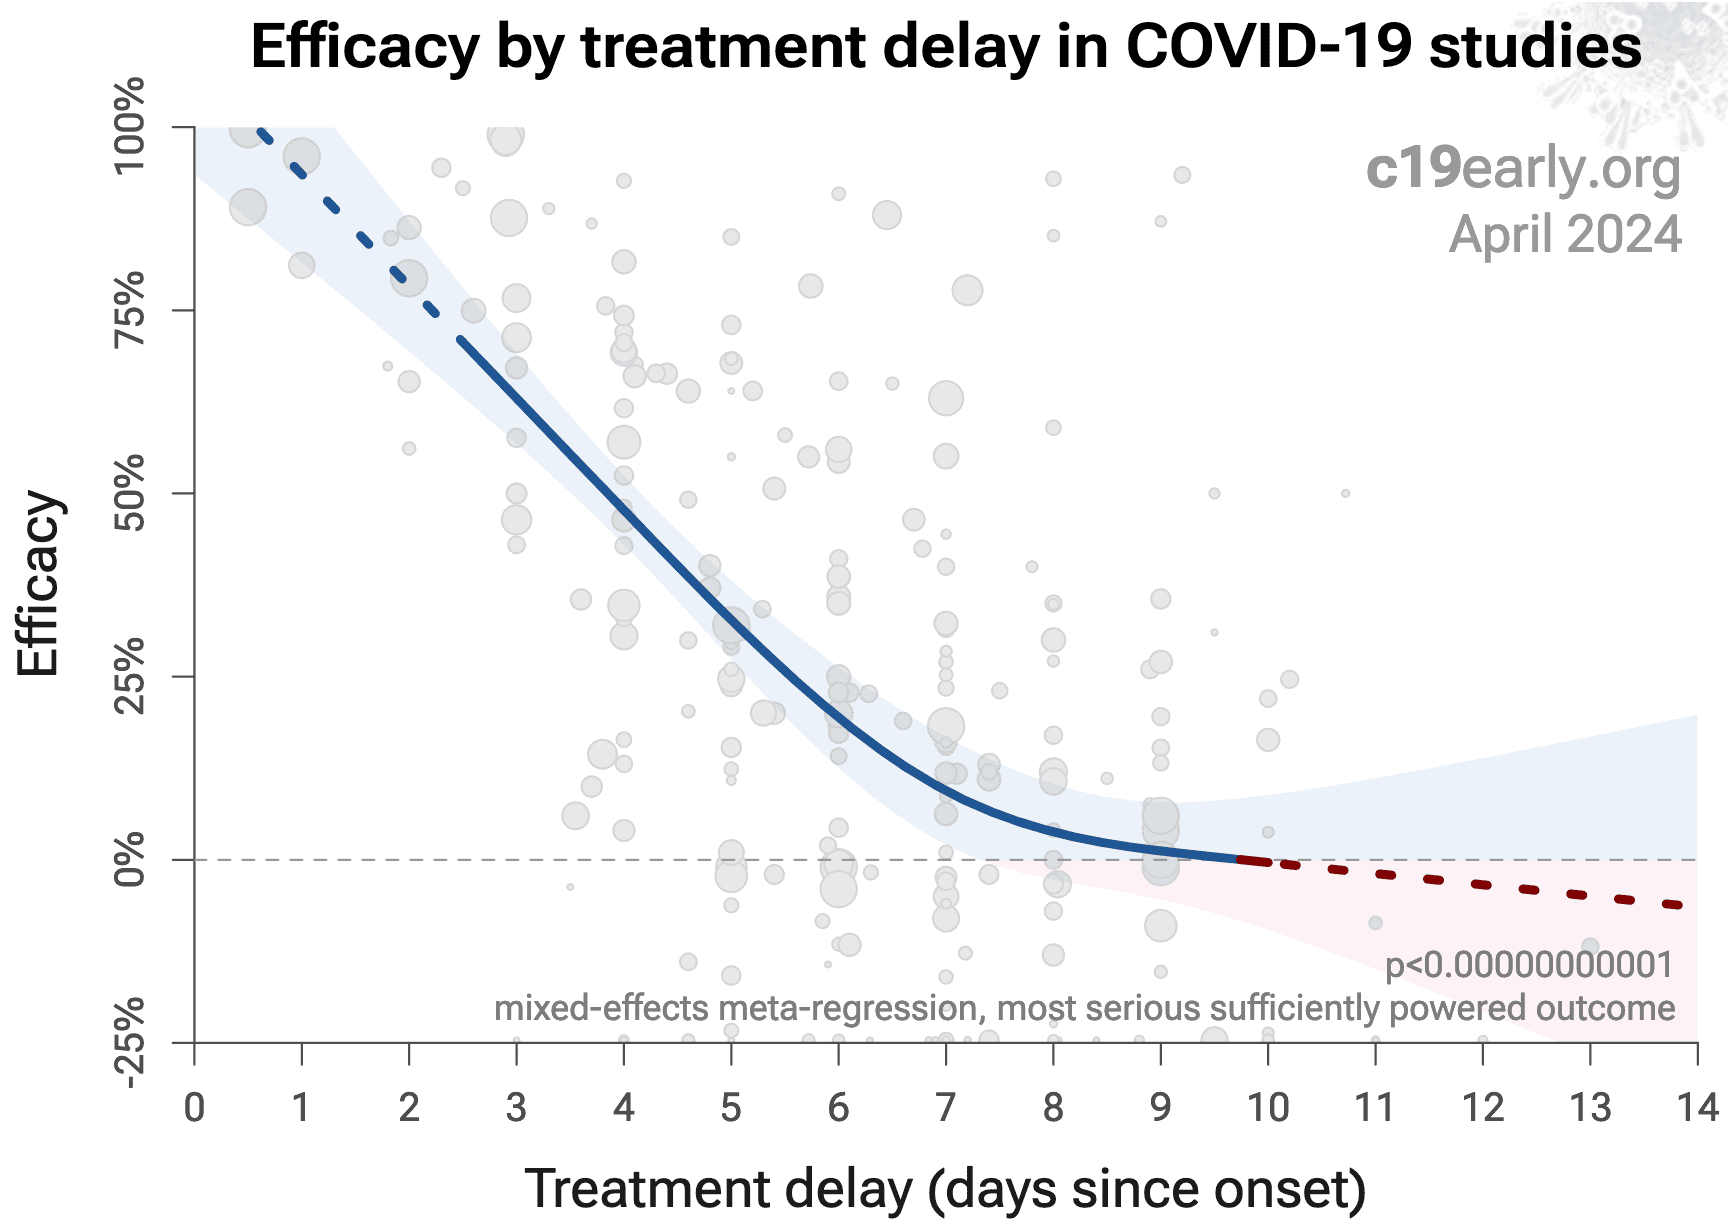
Fig. 22 shows a mixed-effects meta-regression for
efficacy as a function of treatment delay in COVID-19 studies from 225 treatments, showing that efficacy
declines rapidly with treatment delay. Early treatment is critical for COVID-19.
Fig. 22. Early treatment is more effective. Meta-regression showing efficacy as a function of treatment delay in COVID-19 studies from 225 treatments.
Details of the patient population including age and comorbidities may
critically affect how well a treatment works. For example, many COVID-19
studies with relatively young low-comorbidity patients show all patients
recovering quickly with or without treatment. In such cases, there is little
room for an effective treatment to improve results, for example as in
López-Medina et al.
Efficacy may depend critically on the distribution of
SARS-CoV-2 variants encountered by patients. Risk varies significantly across
variants82, for example the Gamma variant shows significantly
different characteristics83-86. Different
mechanisms of action may be more or less effective depending on variants, for
example the degree to which TMPRSS2 contributes to viral entry can differ
across variants87,88.
Effectiveness may depend strongly on the dosage and treatment regimen.
The quality of medications may vary significantly between
manufacturers and production batches, which may significantly affect efficacy
and safety. Williams et al. analyze ivermectin from 11 different sources,
showing highly variable antiparasitic efficacy across different manufacturers.
Xu et al. analyze a treatment from two different manufacturers, showing 9
different impurities, with significantly different concentrations for each
manufacturer.
Across all
studies there is a strong association between different outcomes, for example
improved recovery is strongly associated with lower mortality. However,
efficacy may differ depending on the effect measured, for example a treatment
may be more effective against secondary complications and have minimal effect
on viral clearance.
The
distribution of studies will alter the outcome of a meta-analysis. Consider a
simplified example where everything is equal except for the treatment delay,
and effectiveness decreases to zero or below with increasing delay. If there
are many studies using very late treatment, the outcome may be negative, even
though early treatment is very effective.
All meta-analyses combine heterogeneous studies, varying in population,
variants, and potentially all factors above, and therefore may obscure
efficacy by including studies where treatment is less effective. Generally, we
expect the estimated effect size from meta-analysis to be less than that for
the optimal case.
Looking at all studies is valuable for providing an overview of all research,
important to avoid cherry-picking, and informative when a positive result is
found despite combining less-optimal situations. However, the resulting
estimate does not apply to specific cases such as
early treatment in high-risk populations.
While we present results for all studies, we also present treatment time and
individual outcome analyses, which may be more informative for specific use
cases.
This section validates the use of pooled effects for COVID-19, which enables
earlier detection of efficacy, however pooled effects are no longer required
for azvudine as of July 2023. Efficacy is now known based on specific outcomes. Efficacy based on specific outcomes was delayed by 5.6 months compared to using pooled outcomes.
For COVID-19, delay in clinical results translates into
additional death and morbidity, as well as additional economic and societal
damage. Combining the results of studies reporting different outcomes is
required.
There may be no mortality in a trial with low-risk patients,
however a reduction in severity or improved viral clearance may translate
into lower mortality in a high-risk population.
Different studies may report lower severity, improved recovery, and lower mortality,
and the significance may be very high when combining the results.
"The studies reported different outcomes" is not a good reason for
disregarding results.
Pooling the results of studies reporting different outcomes allows us to use
more of the available information. Logically we should, and do, use additional
information when evaluating treatments—for example dose-response and
treatment delay-response relationships provide additional evidence of efficacy
that is considered when reviewing the evidence for a treatment.
We present both specific outcome and pooled analyses.
In order to combine the results of studies reporting different outcomes we use
the most serious outcome reported in each study, based on the thesis that
improvement in the most serious outcome provides comparable measures of
efficacy for a treatment. A critical advantage of this approach is
simplicity and transparency.
There are many other ways to combine evidence for different outcomes, along
with additional evidence such as dose-response relationships, however these
increase complexity.
Trials with high-risk patients may be restricted due to ethics for treatments
that are known or expected to be effective, and they increase difficulty for
recruiting. Using less severe outcomes as a proxy for more serious outcomes
allows faster and safer collection of evidence.
For many COVID-19 treatments, a reduction in mortality logically
follows from a reduction in hospitalization, which follows from a reduction in
symptomatic cases, which follows from a reduction in PCR positivity. We can
directly test this for COVID-19.
Analysis of the the association between different outcomes across studies from
all 225
treatments we cover confirms the validity of pooled outcome analysis for COVID-19.
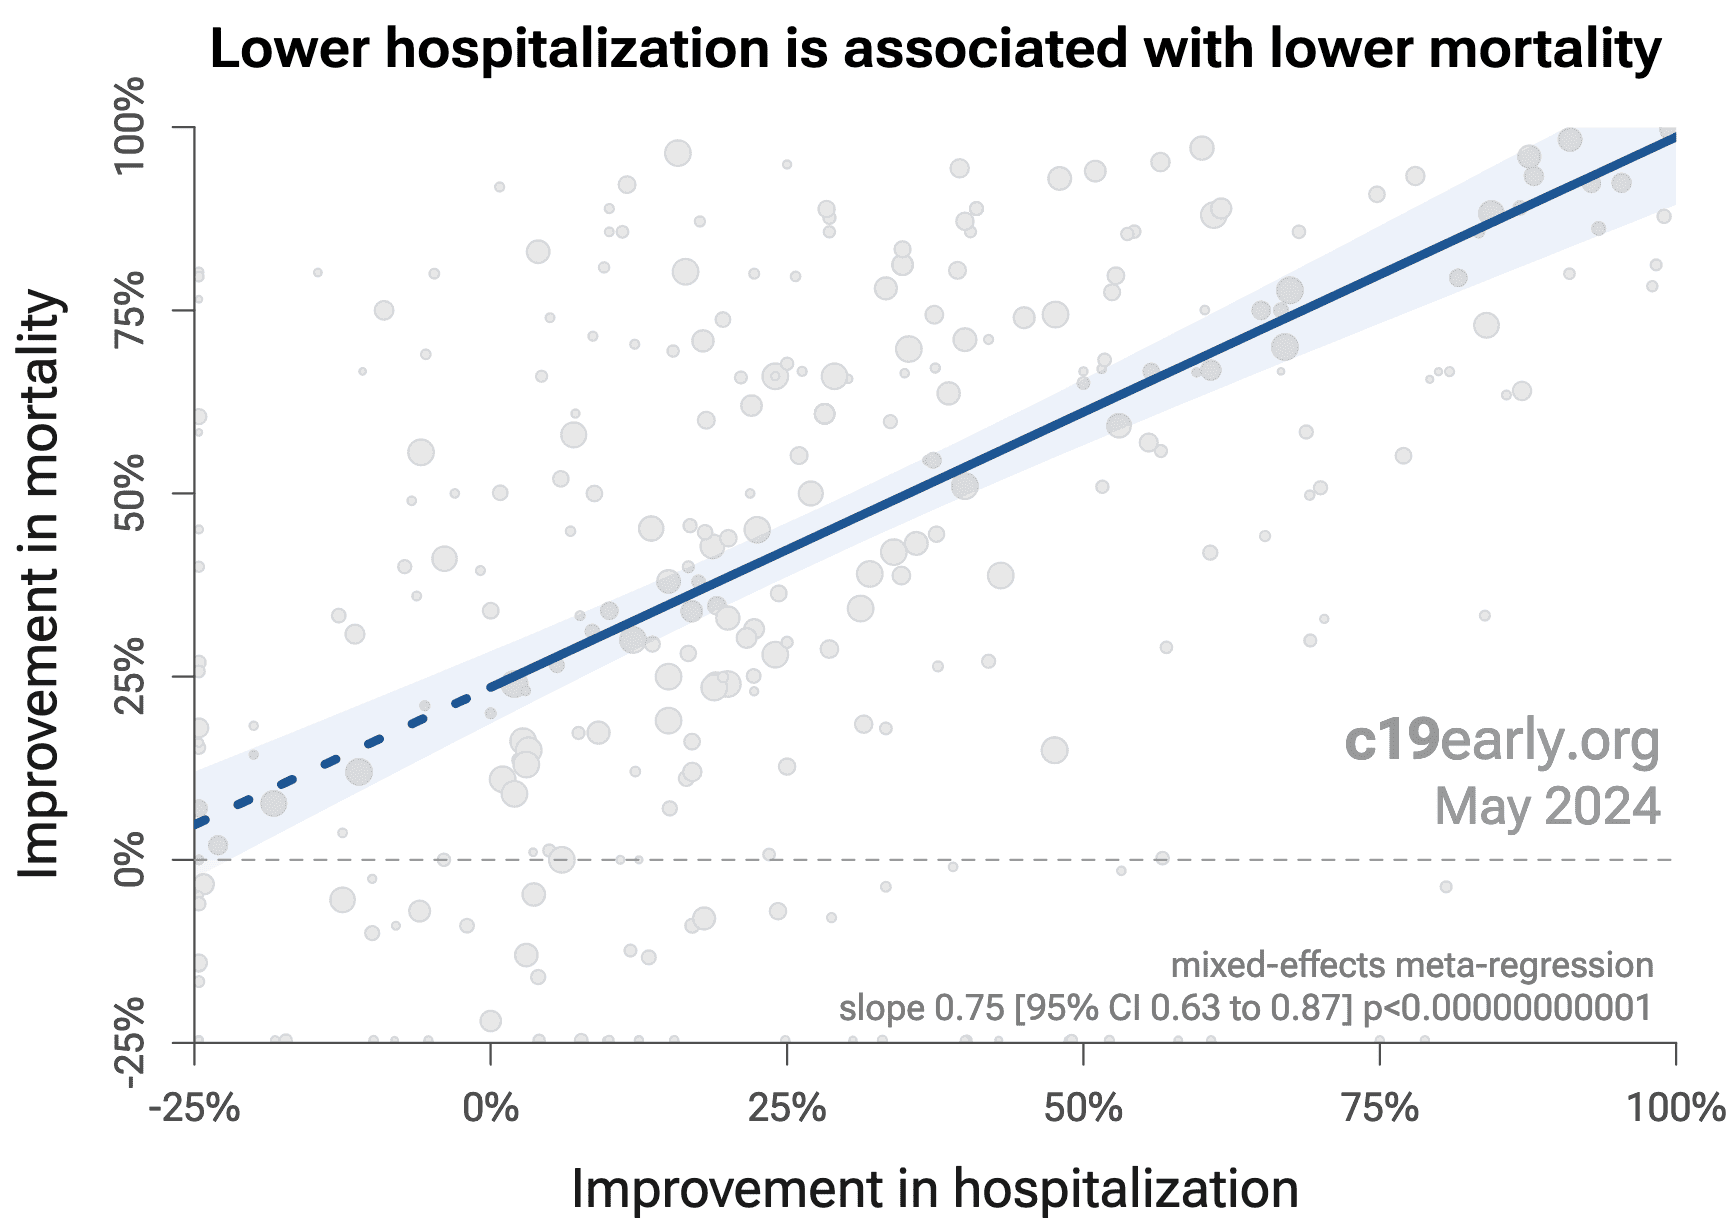
Fig. 23 shows that lower hospitalization is very strongly associated
with lower mortality (p < 0.000000000001).
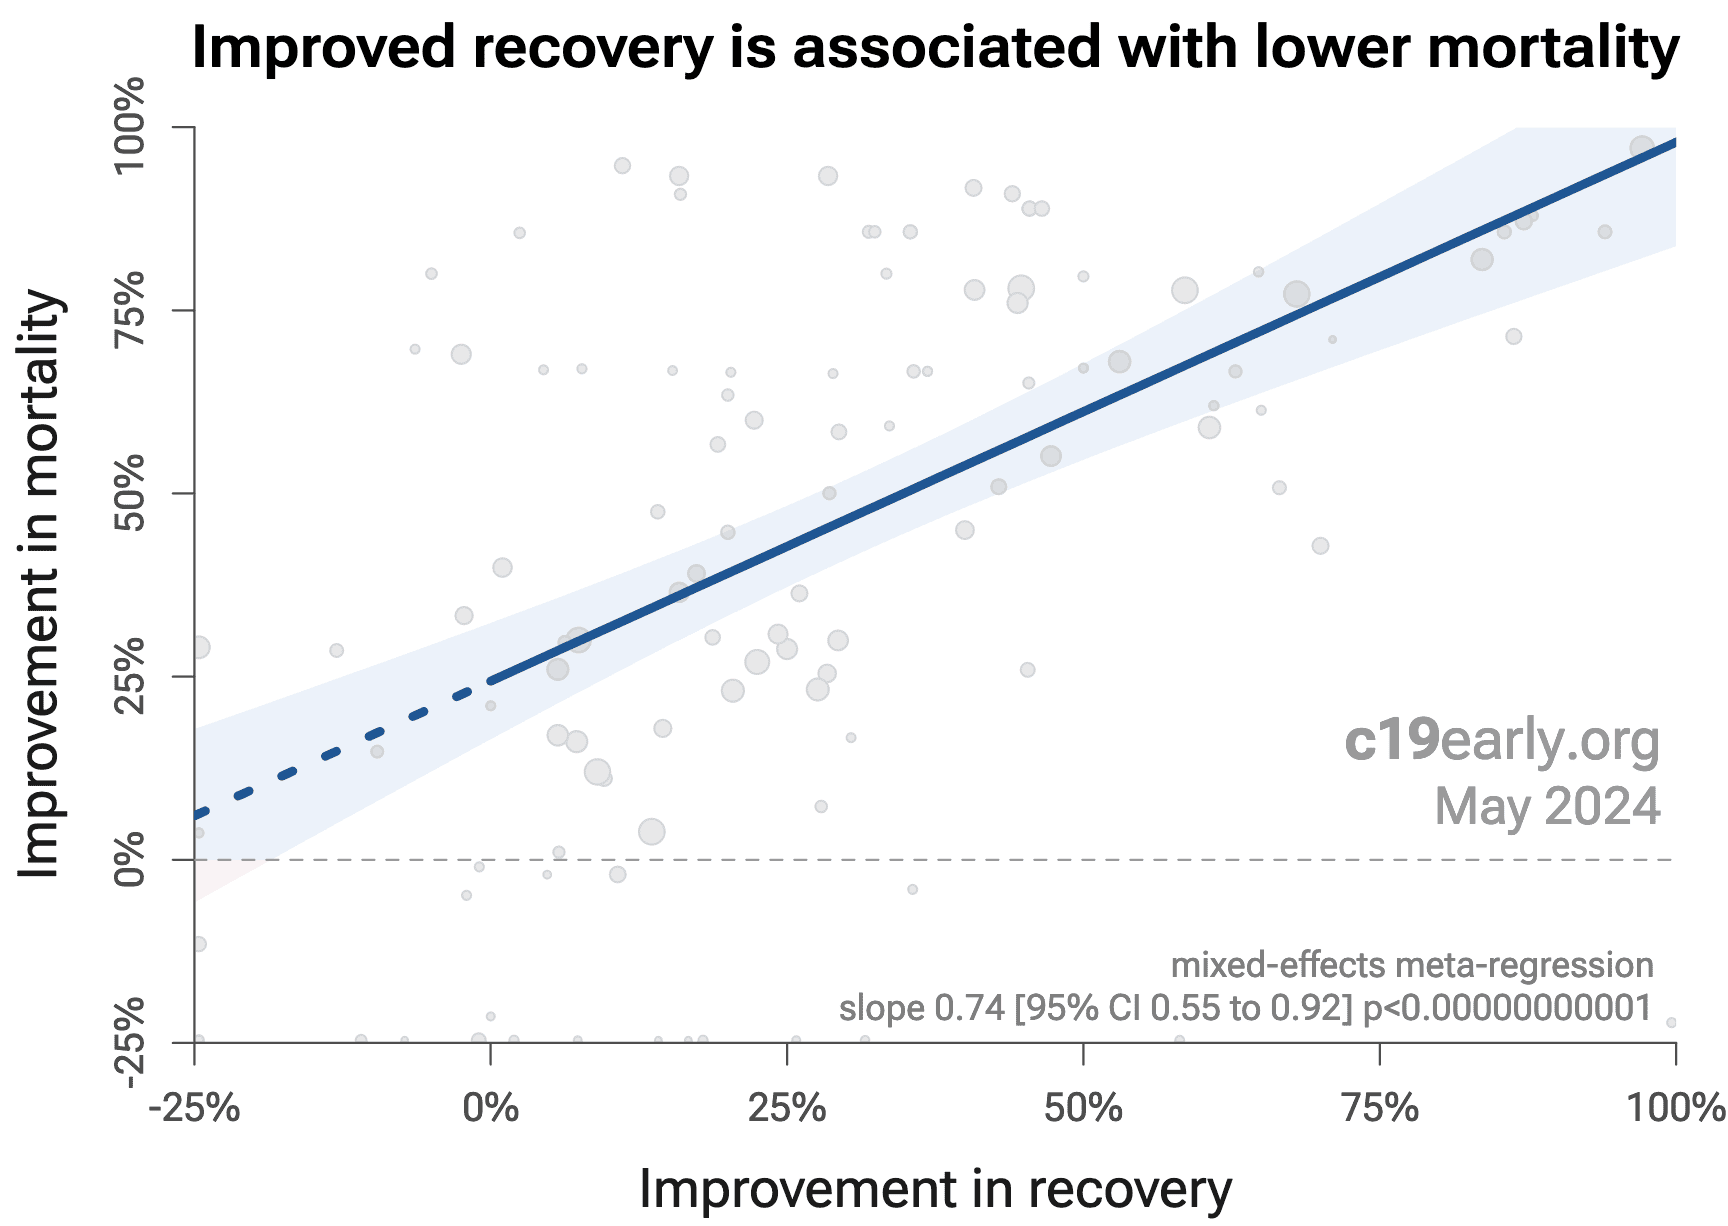
Similarly, Fig. 24 shows that improved recovery is very strongly associated
with lower mortality (p < 0.000000000001).
Considering the extremes, Singh et al. show an association between viral clearance and
hospitalization or death, with p = 0.003 after excluding one large
outlier from a mutagenic treatment, and based on 44 RCTs including 52,384
patients.
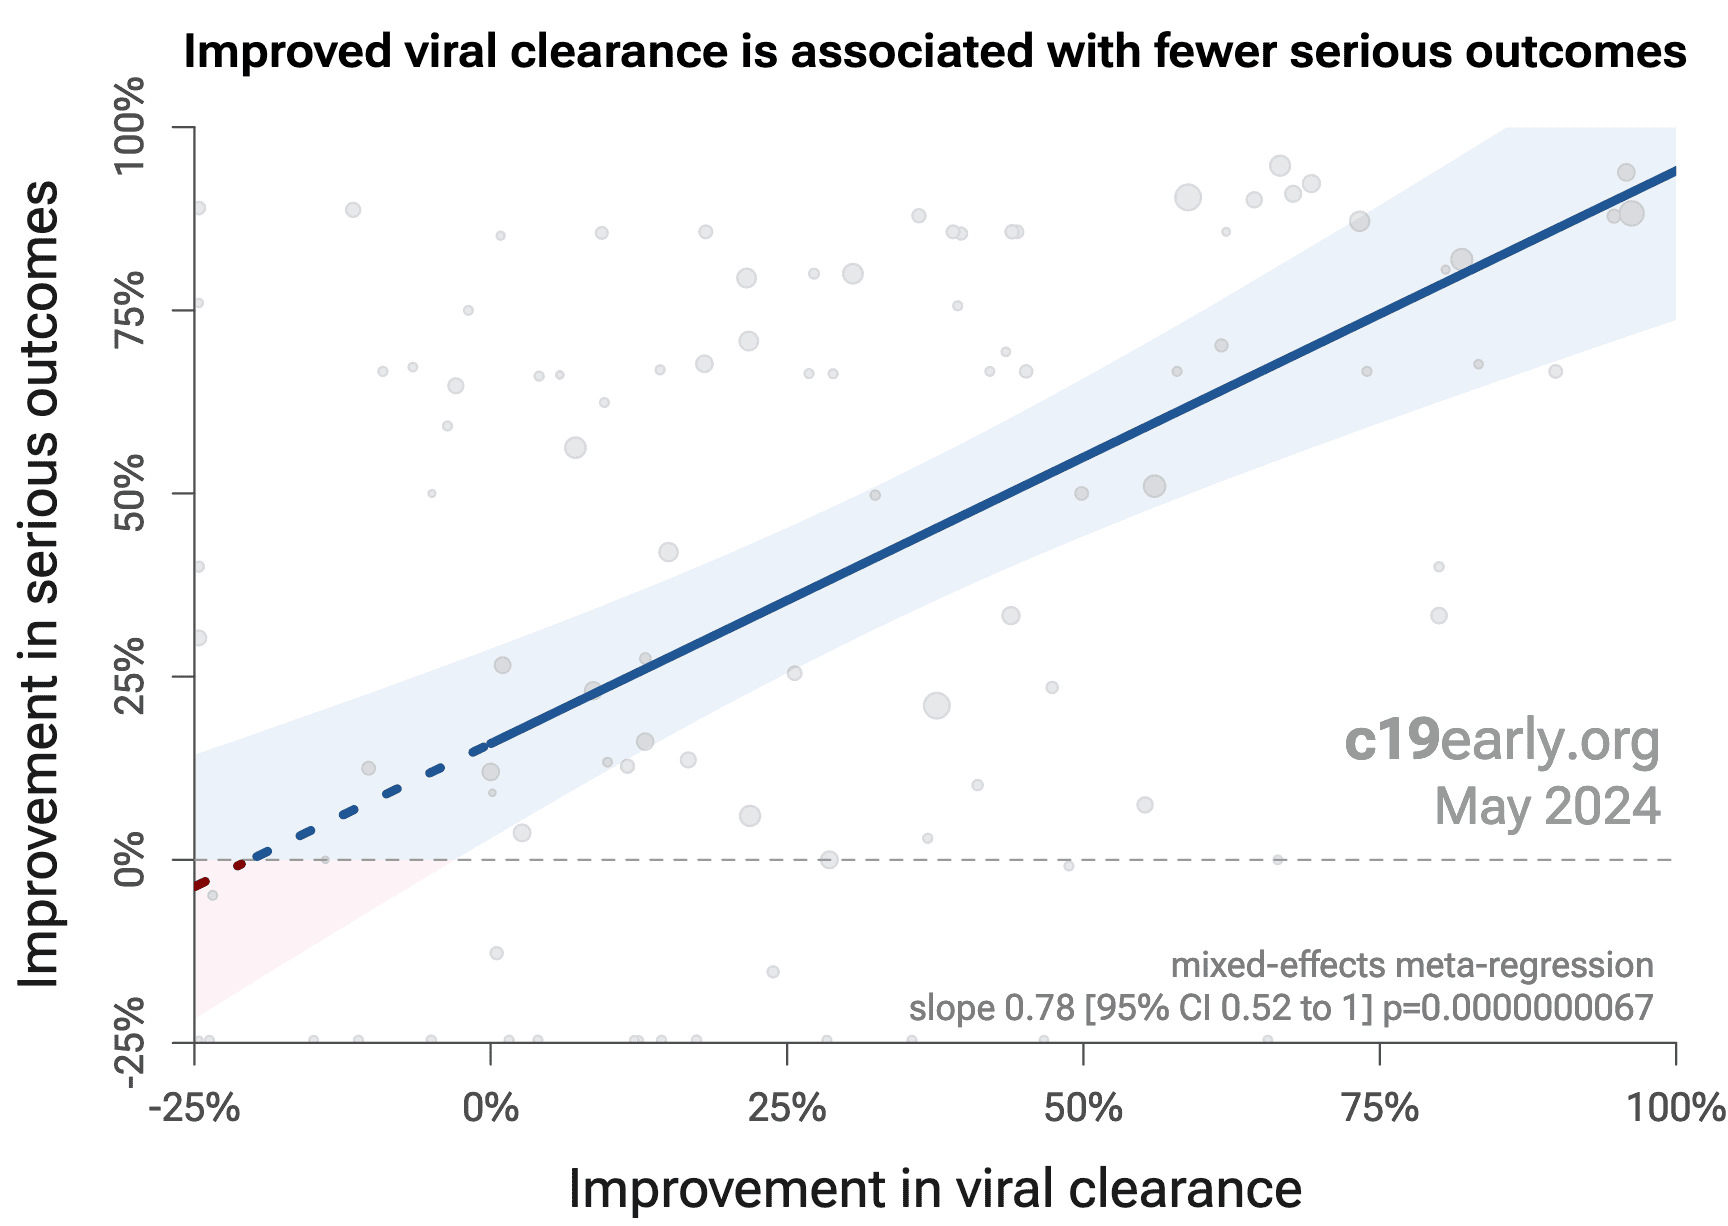
Fig. 25 shows that improved viral clearance is strongly associated
with fewer serious outcomes. The association is very similar to
Singh et al., with higher confidence due to the larger number of
studies. As with Singh et al., the confidence increases
when excluding the outlier treatment, from p = 0.000000011 to p = 0.00000000032.
Fig. 23. Lower hospitalization is associated with lower mortality, supporting pooled outcome analysis.
Fig. 24. Improved recovery is associated with lower mortality, supporting pooled outcome analysis.
Fig. 23. Improved viral clearance is associated with fewer serious outcomes, supporting pooled outcome analysis.
Currently, 59 of the treatments we analyze show statistically significant efficacy or harm, defined as ≥10% decreased risk or >0% increased risk from ≥3 studies. 85% of these have been confirmed with one or more specific outcomes, with a mean delay of 4.6 months. When restricting to RCTs only, 53% of treatments showing statistically significant efficacy/harm with pooled effects have been confirmed with one or more specific outcomes, with a mean delay of 7.4 months.
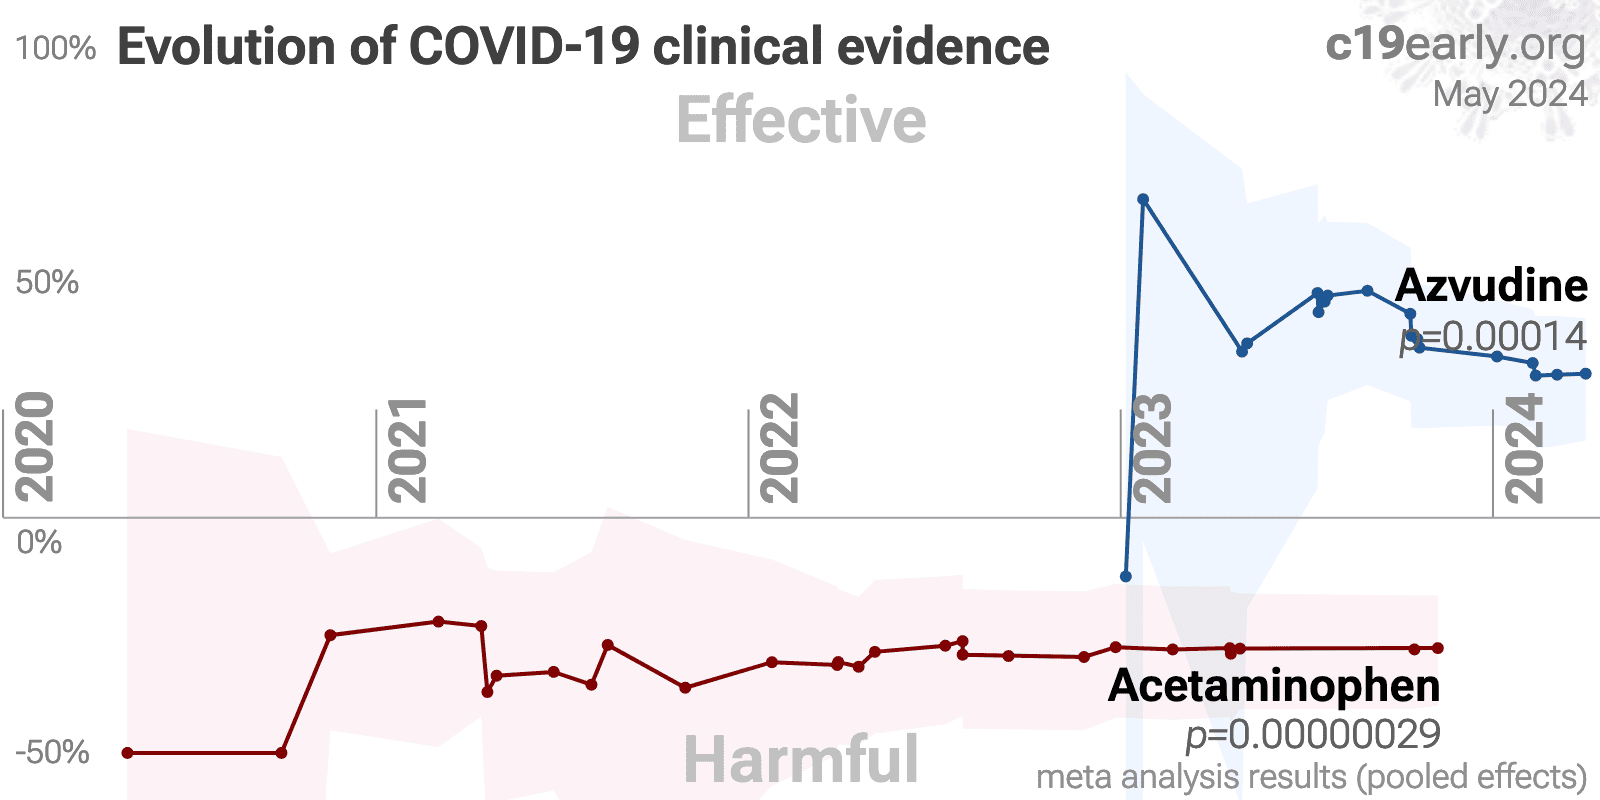
Fig. 26 shows when treatments were found effective during the
pandemic. Pooled outcomes often resulted in earlier detection of efficacy.
Fig. 26. The time when studies showed that
treatments were effective, defined as statistically significant improvement of
≥10% from ≥3 studies.
Pooled results typically show efficacy earlier than specific
outcome results. Results from all studies often shows efficacy much earlier
than when restricting to RCTs.
Results reflect conditions as used in trials to date, these depend on the
population treated, treatment delay, and treatment regimen.
Pooled analysis could hide efficacy, for example a treatment that is
beneficial for late stage patients but has no effect on viral clearance may
show no efficacy if most studies only examine viral clearance. In practice, it
is rare for a non-antiviral treatment to report viral clearance and to not
report clinical outcomes; and in practice other sources of heterogeneity such
as differences in treatment delay are more likely to hide efficacy.
Analysis validates the use of pooled effects and shows significantly faster
detection of efficacy on average.
However, as with all meta-analyses, it is important to review the different
studies included. We also present individual outcome analyses, which may be
more informative for specific use cases.
Publishing is often biased
towards positive results. Trials with patented drugs may have a financial conflict of interest that
results in positive studies being more likely to be published, or bias towards more positive results. For example with molnupiravir, trials with negative results remain unpublished to
date (CTRI/2021/05/033864 and CTRI/2021/08/0354242).
For azvudine, there is currently not
enough data to evaluate publication bias with high confidence.
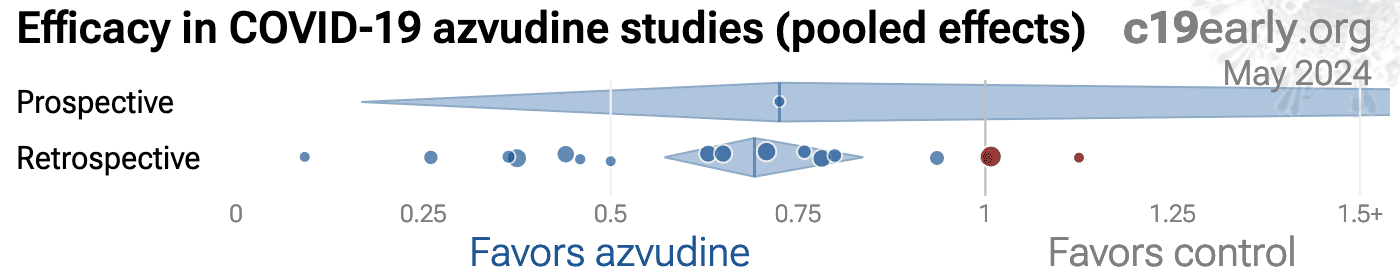
One method to evaluate bias is to compare prospective vs.
retrospective studies. Prospective studies are more likely to be published
regardless of the result, while retrospective studies are more likely to
exhibit bias. For example, researchers may perform preliminary analysis with
minimal effort and the results may influence their decision to continue.
Retrospective studies also provide more opportunities for the specifics of
data extraction and adjustments to influence results.
Fig. 27 shows a scatter plot of
results for prospective and retrospective studies.
76% of retrospective studies
report a statistically significant positive effect for
one or more outcomes, compared to
75% of prospective studies, showing similar results.
The median effect size for
retrospective studies is 31% improvement,
compared to 32% for prospective
studies, showing similar results.
Fig. 27. Prospective vs. retrospective studies.
The diamonds show the results of random-effects meta-analysis.
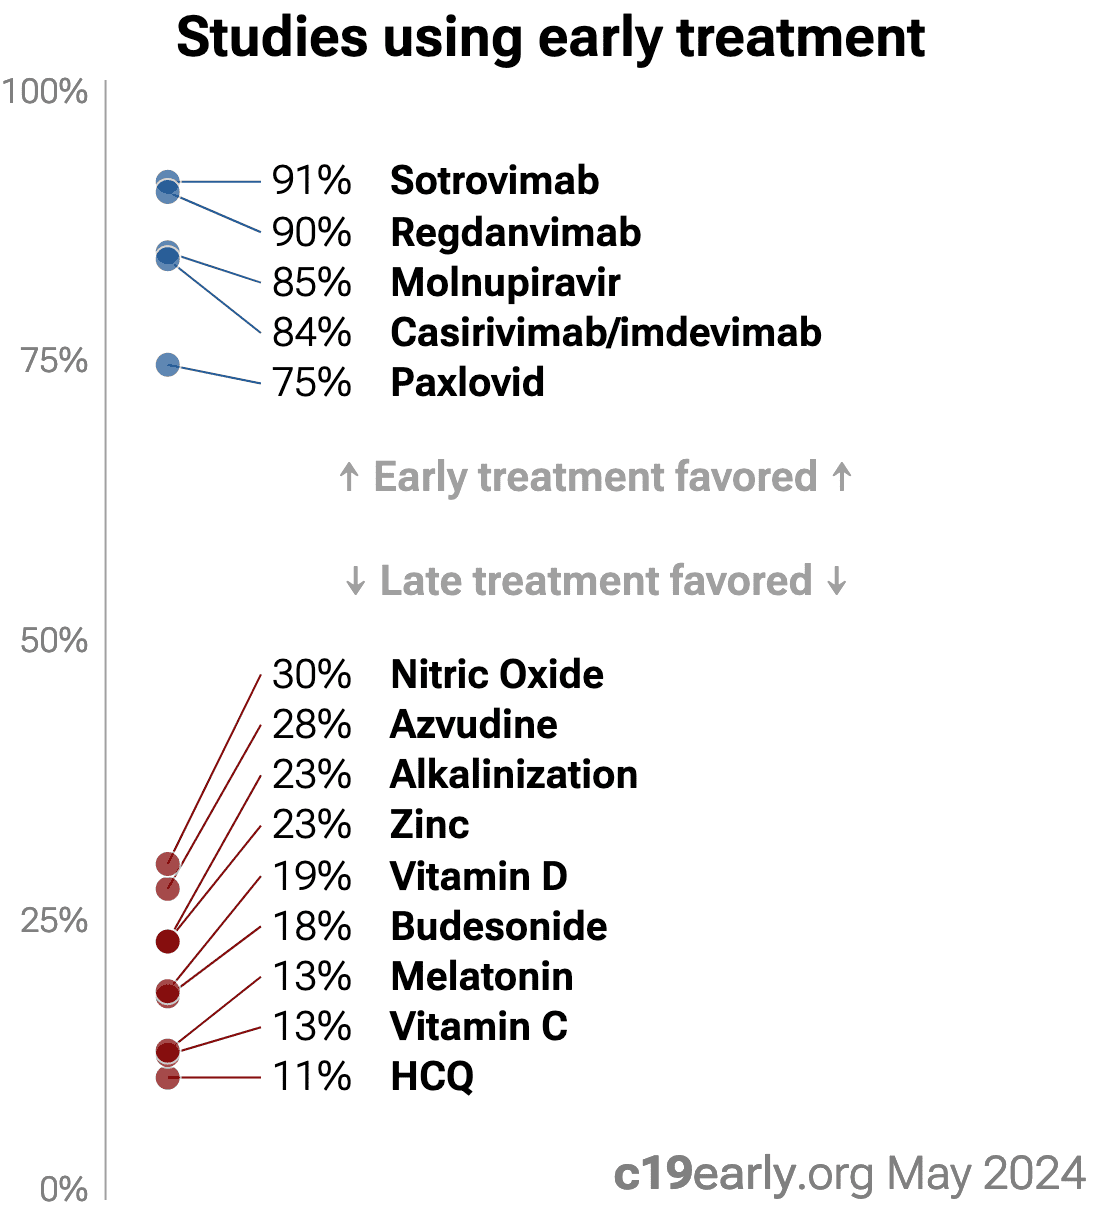
Fig. 28.
Early treatment was more common for high-profit drugs.
Studies for azvudine were mostly late treatment studies, in
contrast with typical high-profit drugs that were more likely to be tested with early
treatment.
Funnel
plots have traditionally been used for analyzing publication bias. This is
invalid for COVID-19 acute treatment trials — the underlying assumptions
are invalid, which we can demonstrate with a simple example. Consider a set of
hypothetical perfect trials with no bias. Fig. 29 plot A
shows a funnel plot for a simulation of 80 perfect trials, with random group
sizes, and each patient's outcome randomly sampled (10% control event
probability, and a 30% effect size for treatment). Analysis shows no asymmetry
(p > 0.05). In plot B, we add a single typical variation in COVID-19 treatment
trials — treatment delay. Consider that efficacy varies from 90% for
treatment within 24 hours, reducing to 10% when treatment is delayed 3 days.
In plot B, each trial's treatment delay is randomly selected. Analysis now
shows highly significant asymmetry, p < 0.0001, with six variants of
Egger's test all showing p < 0.05113-120.
Note that these tests fail even though treatment delay is uniformly
distributed. In reality treatment delay is more complex — each trial has
a different distribution of delays across patients, and the distribution
across trials may be biased (e.g., late treatment trials may be more common).
Similarly, many other variations in trials may produce asymmetry, including
dose, administration, duration of treatment, differences in SOC,
comorbidities, age, variants, and bias in design, implementation, analysis,
and reporting.
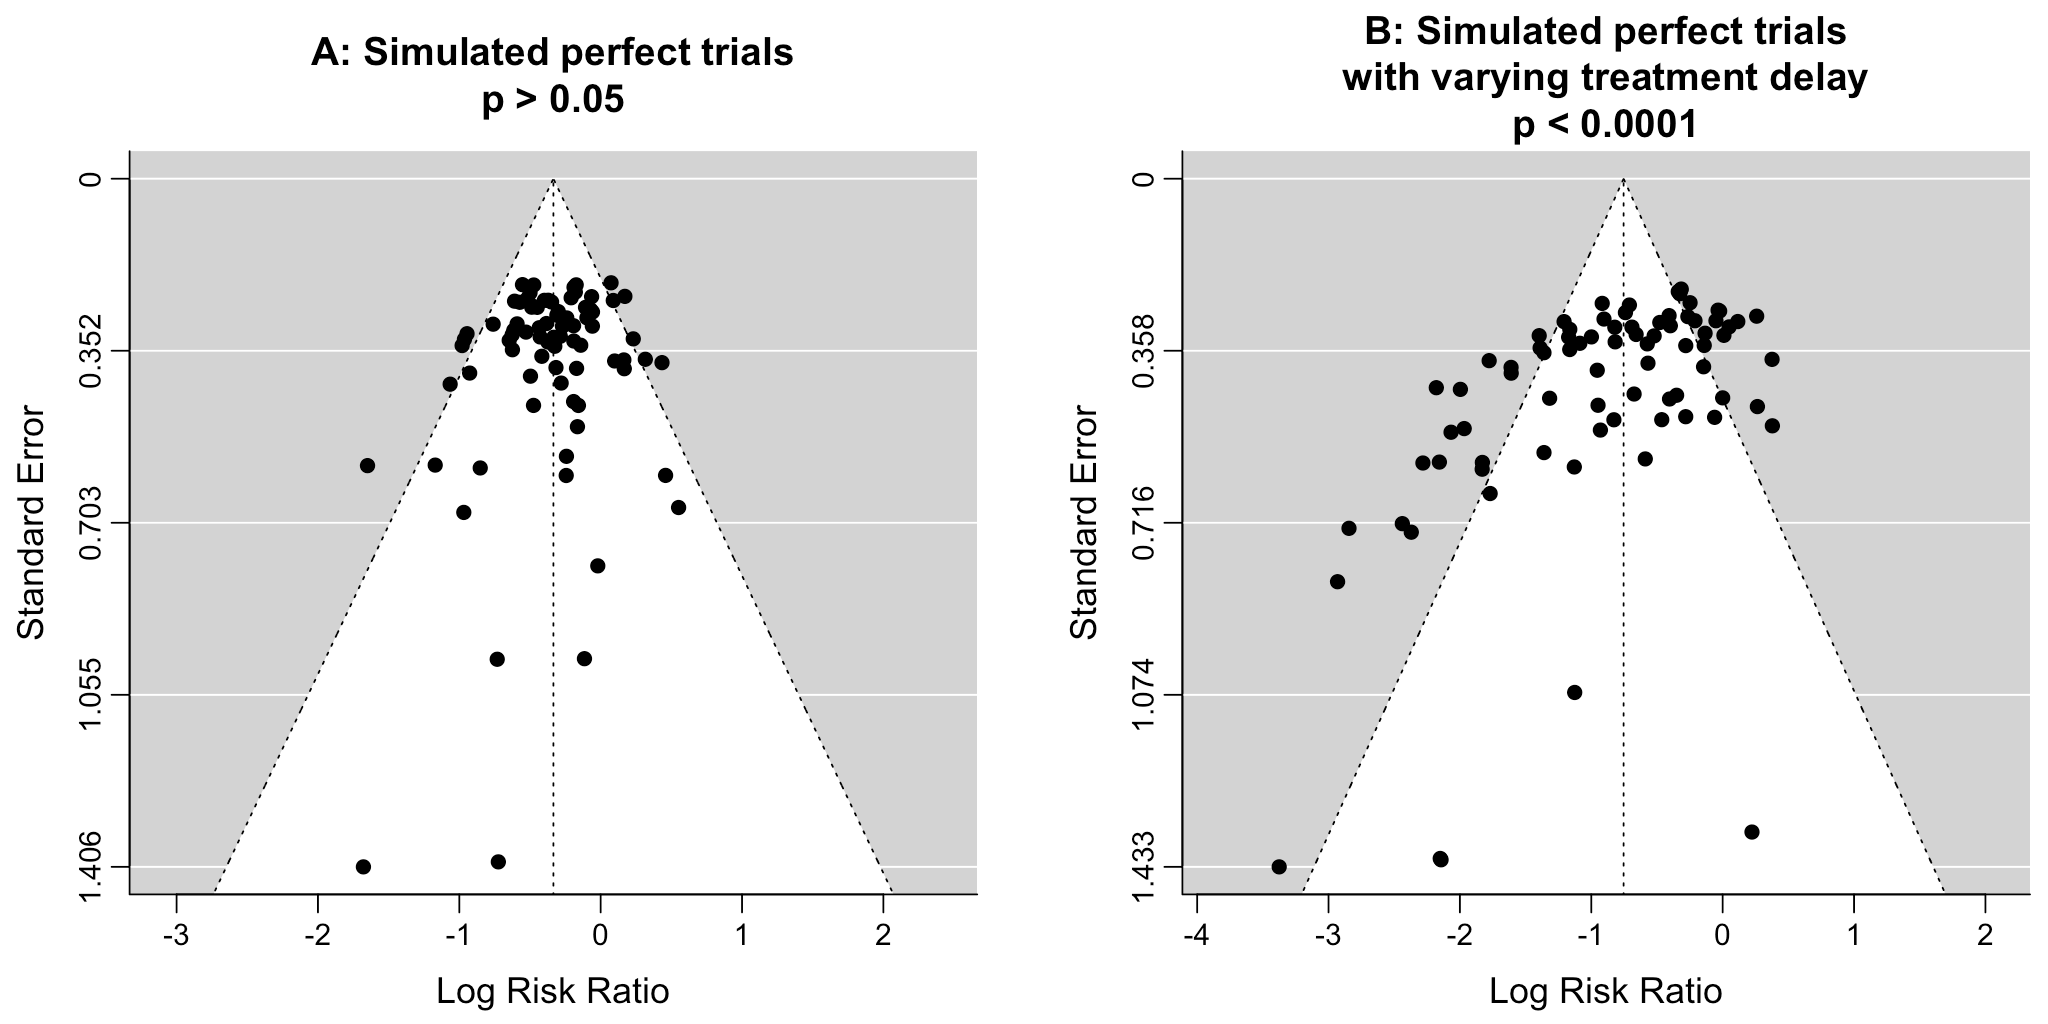
Fig. 29. Example funnel plot analysis for simulated perfect trials.
Summary statistics from
meta-analysis necessarily lose information. As with all meta-analyses, studies
are heterogeneous, with differences
in treatment delay, treatment regimen, patient demographics, variants,
conflicts of interest, standard of care, and other factors. We provide analyses for specific
outcomes and by treatment delay, and we aim to identify key characteristics in
the forest plots and summaries. Results should be viewed in the context of
study characteristics.
Some analyses classify treatment based on early or late
administration, as done here, while others distinguish between mild, moderate,
and severe cases. Viral load does not indicate degree of symptoms — for
example patients may have a high viral load while being asymptomatic. With
regard to treatments that have antiviral properties, timing of treatment is
critical — late administration may be less helpful regardless of
severity.
Details of treatment delay per patient is often not available.
For example, a study may treat 90% of patients relatively early, but the
events driving the outcome may come from 10% of patients treated very late.
Our 5 day cutoff for early treatment may be too conservative, 5 days may be too late in many cases.
Comparison across treatments is confounded by differences in
the studies performed, for example dose, variants, and conflicts of interest.
Trials with conflicts of interest may use designs better suited to the
preferred outcome.
In some cases, the most serious outcome has very few events,
resulting in lower confidence results being used in pooled analysis, however
the method is simpler and more transparent. This is less critical as the
number of studies increases. Restriction to outcomes with sufficient power may
be beneficial in pooled analysis and improve accuracy when there are few
studies, however we maintain our pre-specified method to avoid any
retrospective changes.
Studies show that combinations of treatments can be highly
synergistic and may result in many times greater efficacy than individual
treatments alone91-111.
Therefore standard of care may be critical and benefits may diminish or
disappear if standard of care does not include certain treatments.
This real-time analysis is constantly updated based on
submissions. Accuracy benefits from widespread review and submission of
updates and corrections from reviewers. Less popular treatments may receive
fewer reviews.
No treatment or intervention is 100% available and
effective for all current and future variants. Efficacy may vary significantly
with different variants and within different populations. All treatments have
potential side effects. Propensity to experience side effects may be predicted
in advance by qualified physicians. We do not provide medical advice. Before
taking any medication, consult a qualified physician who can compare all
options, provide personalized advice, and provide details of risks and
benefits based on individual medical history and situations.
Li (C) et al. present a review covering azvudine for COVID-19.
SARS-CoV-2 infection and replication involves a complex
interplay of 500+ host and viral proteins and other
factors38-45, providing many therapeutic
targets.
Over 11,000 compounds have been predicted to reduce COVID-19
risk46, either by directly
minimizing infection or replication, by supporting immune system function, or
by minimizing secondary complications.
Fig. 30 shows an overview of the results for azvudine
in the context of multiple COVID-19 treatments, and Fig. 31 shows a plot
of efficacy vs. cost for COVID-19 treatments.
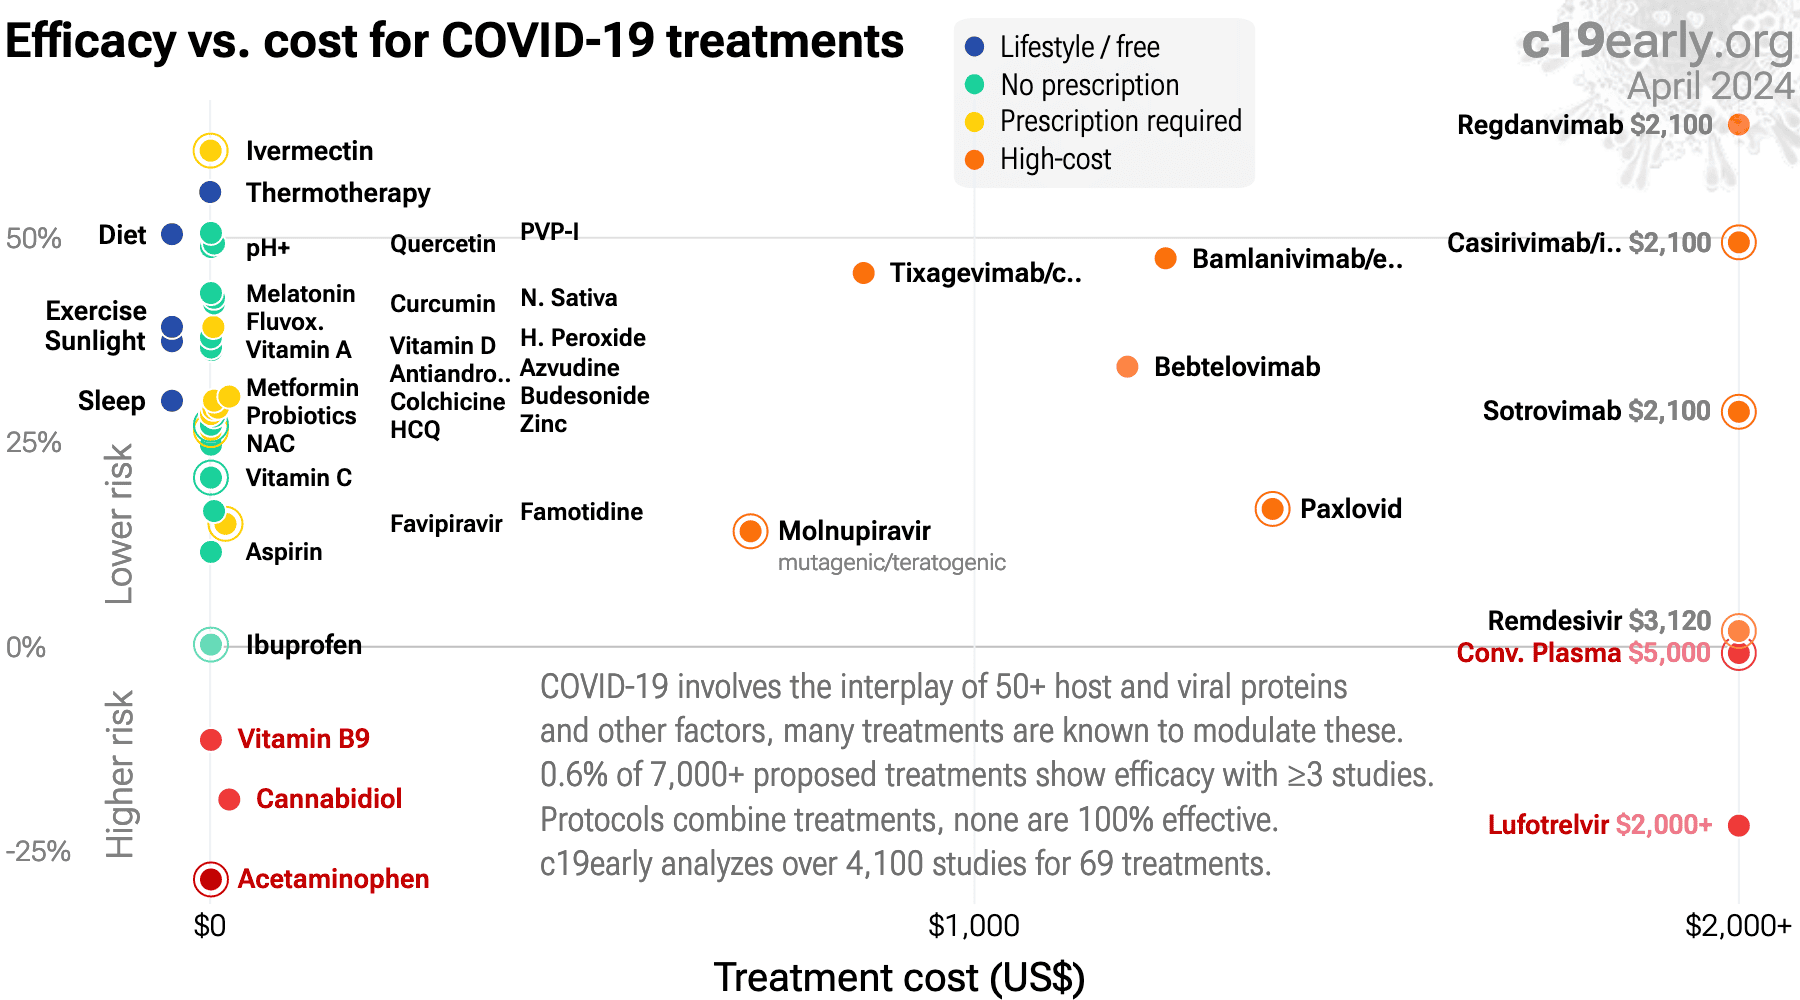
Fig. 31. Efficacy vs. cost for COVID-19 treatments.
Azvudine is
an effective treatment for COVID-19.
Significantly lower risk is seen for mortality, ICU admission, hospitalization, progression, and viral clearance. 32 studies from 22 independent teams in 2 countries show significant
benefit.
Meta-analysis using the most serious outcome reported shows
27% [19‑33%] lower risk. Results are similar for Randomized Controlled Trials, higher quality studies, and peer-reviewed studies.
Results are very robust—in worst case exclusion sensitivity analysis 22 of
42 studies must be excluded before statistical significance is lost.
Azvudine is a nucleoside analog with potential host cell and organ toxicity. Studies to date highlight liver, reproductive, and hematologic toxicity - there is not the same volume of evidence for harm as there is with remdesivir, but there is also less data overall. Therefore, results may be less favorable with longer follow-up, and long-term morbidity could be an issue. COVID-19 studies show significantly increased risk of liver injury1,2.
5 other meta-analyses show significant improvements with azvudine for mortality3-7, mechanical ventilation3, clinical improvement3, progression7, and viral clearance3,5,6 .
Contact.
Contact us on X at @CovidAnalysis.
Funding.
We have received no funding or
compensation in any form, and do not accept donations. This is entirely volunteer work.
Conflicts of interest.
We have no conflicts of interest.
We have no affiliation with any pharmaceutical companies, supplement companies, governments, political parties, or advocacy organizations.AI.
We use AI models (Gemini, Grok, Claude, and
ChatGPT) tasked with functioning as additional peer-reviewers to check for errors, suggest
improvements, and review spelling and grammar. Any corrections are verified and applied
manually. Our preference for em dashes is independent of AI.Updates.
Our COVID-19 meta-analyses involve the extraction of over 226,000
datapoints from thousands of papers for 225 treatments. We thank the
thousands of scientists, physicians, and other contributors that have provided updates,
suggestions, feedback, and corrections. These are all welcome and can be submitted
at https://c19early.org/azvmeta.html.
Dedication.
This work is dedicated to top
evidence-based physicians that worked tirelessly to analyze evidence and greatly reduce
mortality and morbidity during the pandemic. In alphabetical order:
Dr. Thomas J. Borody, Dr. Mary Talley Bowden, Dr. Flavio Cadegiani, Dr. Shankara Chetty,
Dr. Ryan Cole, Dr. George Fareed, Dr. Sabine Hazan, Dr. Pierre Kory, Dr. Tess Lawrie, Dr.
Robert Malone, Dr. Paul Marik, Dr. Peter McCullough, Dr. Didier Raoult, Dr. Harvey Risch,
Dr. Jackie Stone, Dr. Brian Tyson, Dr. Joseph Varon, and Dr. Vladimir (Zev) Zelenko.
Public domain.
This is a public domain work
distributed in accordance with the Creative Commons CC0 1.0 Universal license, which
dedicates the work to the public domain by waiving all rights worldwide under copyright law.
You can distribute, remix, adapt, and build upon this work in any medium or format,
including for commercial purposes, without asking permission. Referenced material and
third-party images retain any original copyrights or restrictions.
See: https://creativecommons.org/publicdomain/zero/1.0/.
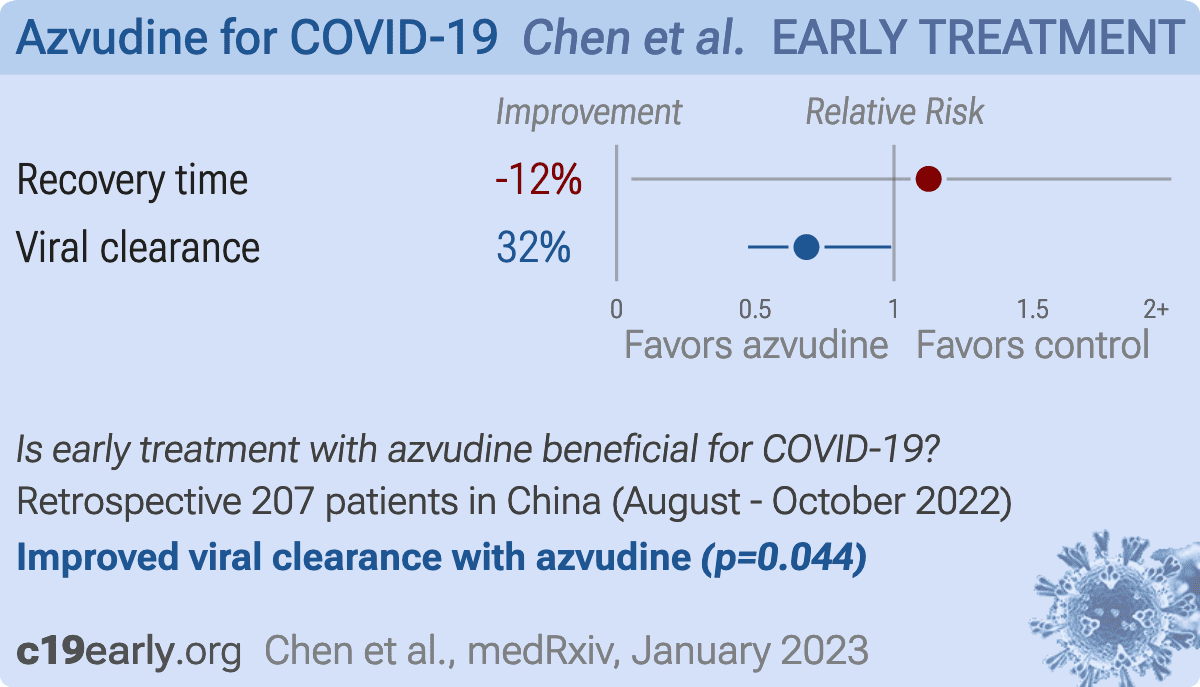
Retrospective 207 COVID-19 patients in China, showing azvudine associated with faster viral clearance, with azvudine-treated patients obtaining a negative PCR test result 1.7 days faster on average compared to supportive care alone after adjusting for age and sex.
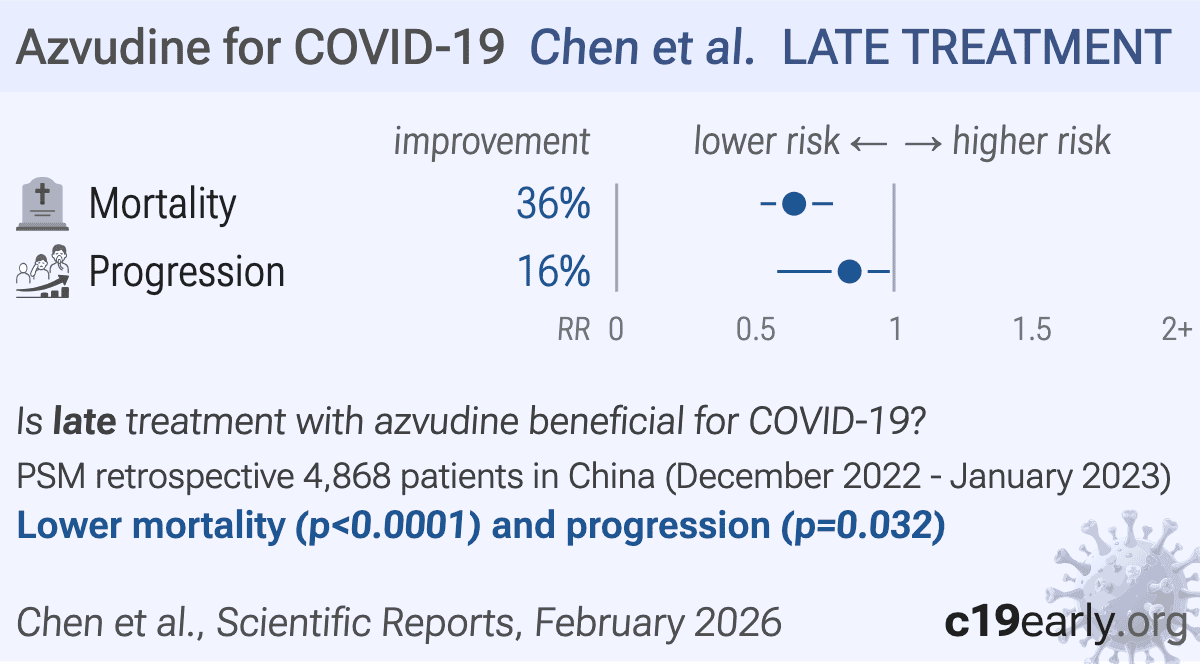
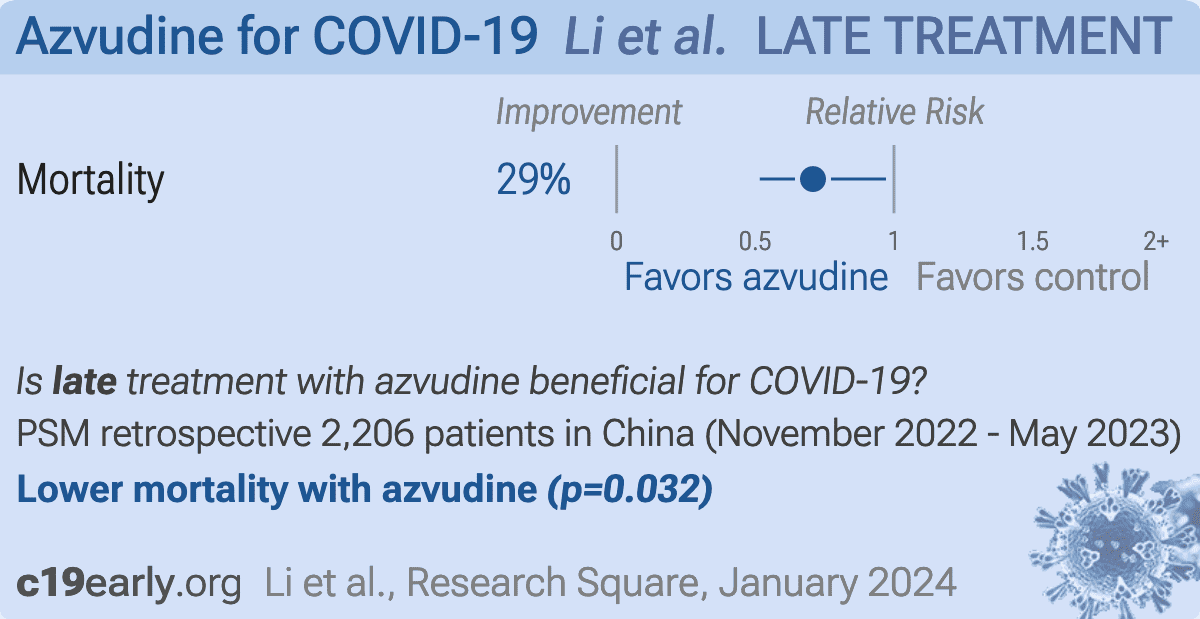
PSM retrospective 4,868 hospitalized COVID-19 patients with hypertension showing reduced mortality with azvudine.
For composite disease progression, the azvudine group had more raw events (330) than the control group (320) out of identical starting populations (2434 per group). Yet, the study reports a significantly protective Hazard Ratio (0.84). The data suggests a large differential in person-days driven by informative censoring (e.g., early discharge of control patients), biasing the Cox model. The person-days calculated for the composite progression endpoint drastically differ between groups (approx 28,100 for azvudine vs 22,700 for control) despite starting with identical sample sizes and following a 30-day max horizon. This suggests control patients were systematically censored earlier, creating a survival bias in the time-to-event analysis. Authors also acknowledge that the composite disease progression finding was not robust across sensitivity analyses.
The mortality result should have higher reliability, with consistent results across all five sensitivity analyses - probabilistic PSM, mean imputation, excluding first-day discharges, doubly robust estimation, and IPTW. However, differential censoring likely affects the results here as well. The raw counts in the PSM groups shows a more modest ~15% benefit.
In Table 3, the reported percentages do not match the counts. For example, serum phosphorus in the control group reports 74 cases out of 2223 (which is 3.3%) but shows 23%. Table 3 reports 70 Grade >= 3 events for hypertriglyceridemia in the control group and 100 in the azvudine group, however these are much larger than the number of events for all grades. Table 3 lists available data for hypertriglyceridemia as control = 2465 and azvudine = 2454. These numbers exceed the post-matching cohort size of 2434 patients per group.
The text states the mortality rate in the control group was 8.79% (n = 214), but later claims there were 216 cases.
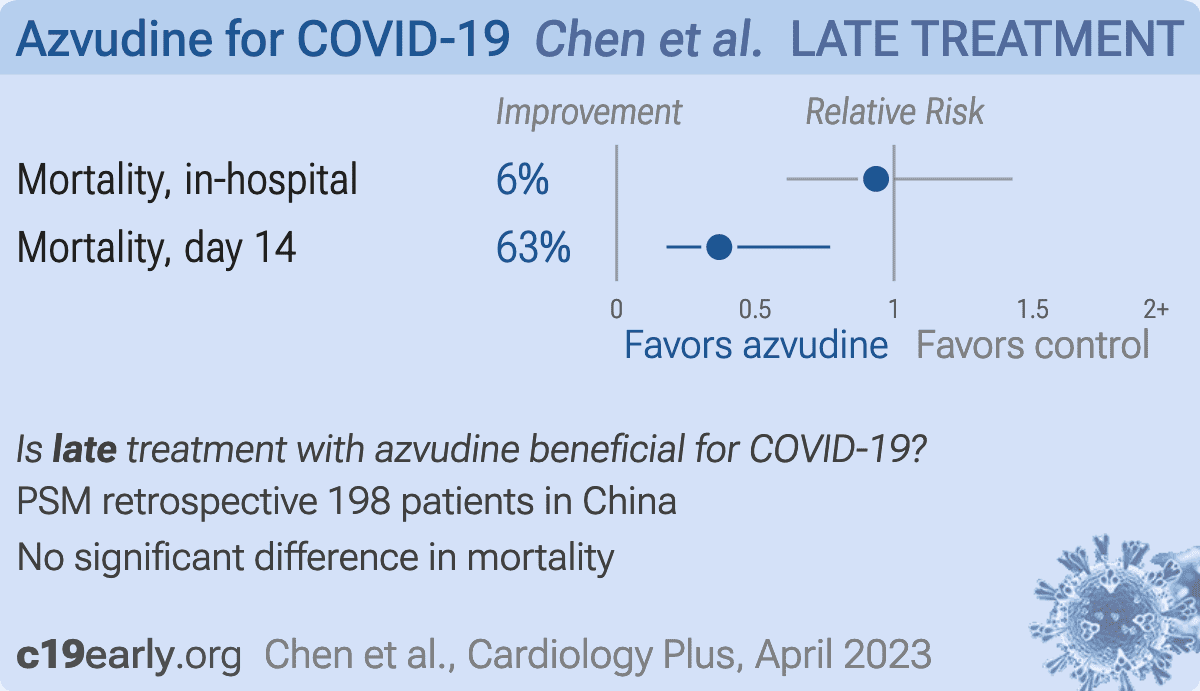
PSM retrospective 332 hospitalized moderate to critically ill COVID-19 patients with myocardial injury in China, showing improved 14 day mortality but no difference in overall in-hospital mortality with azvudine treatment.
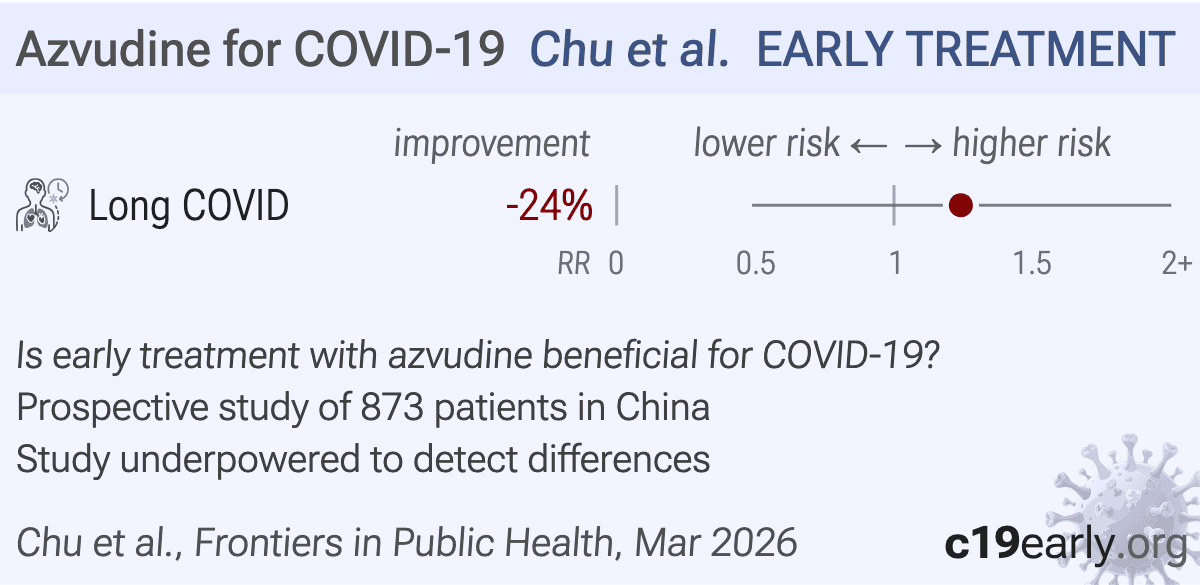
Prospective study of 2,792 COVID-19 patients in China. After propensity score matching, neither paxlovid nor azvudine showed a statistically significant association with long COVID.
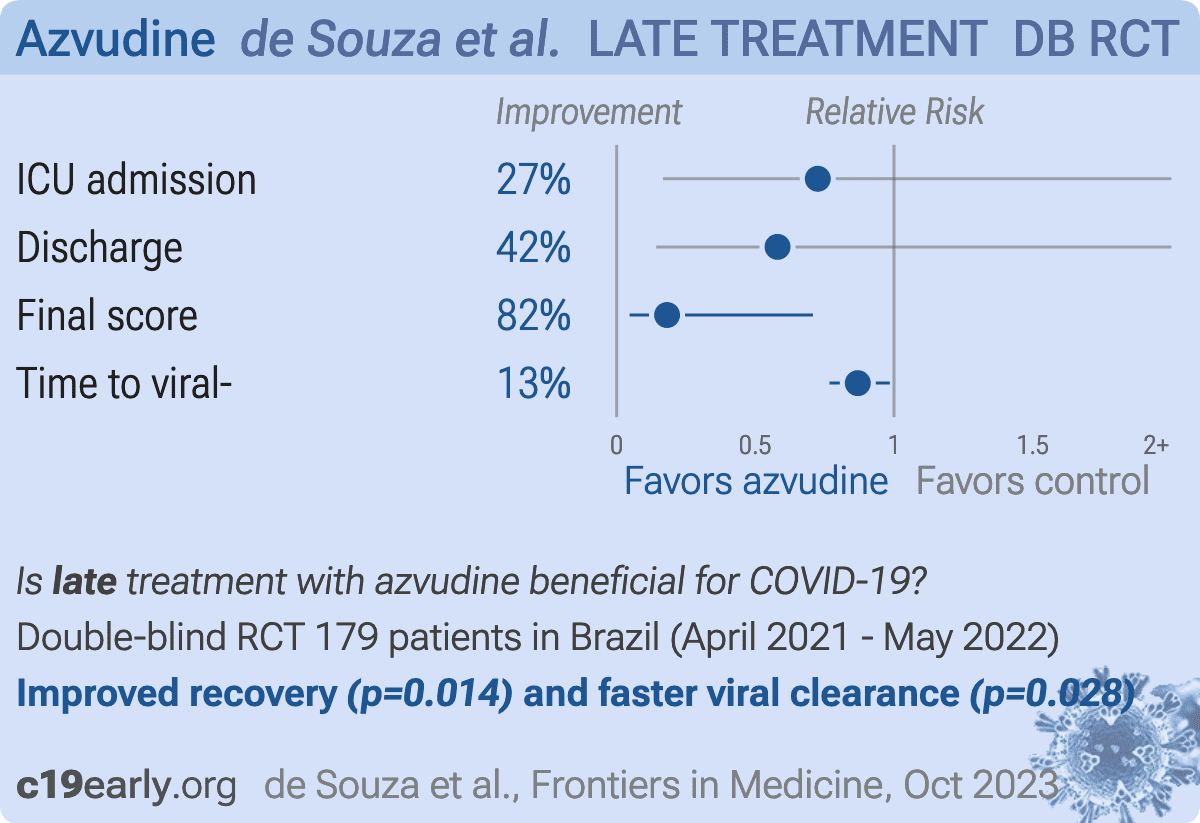
RCT 179 hospitalized patients in Brazil, showing improved recovery with azvudine treatment.
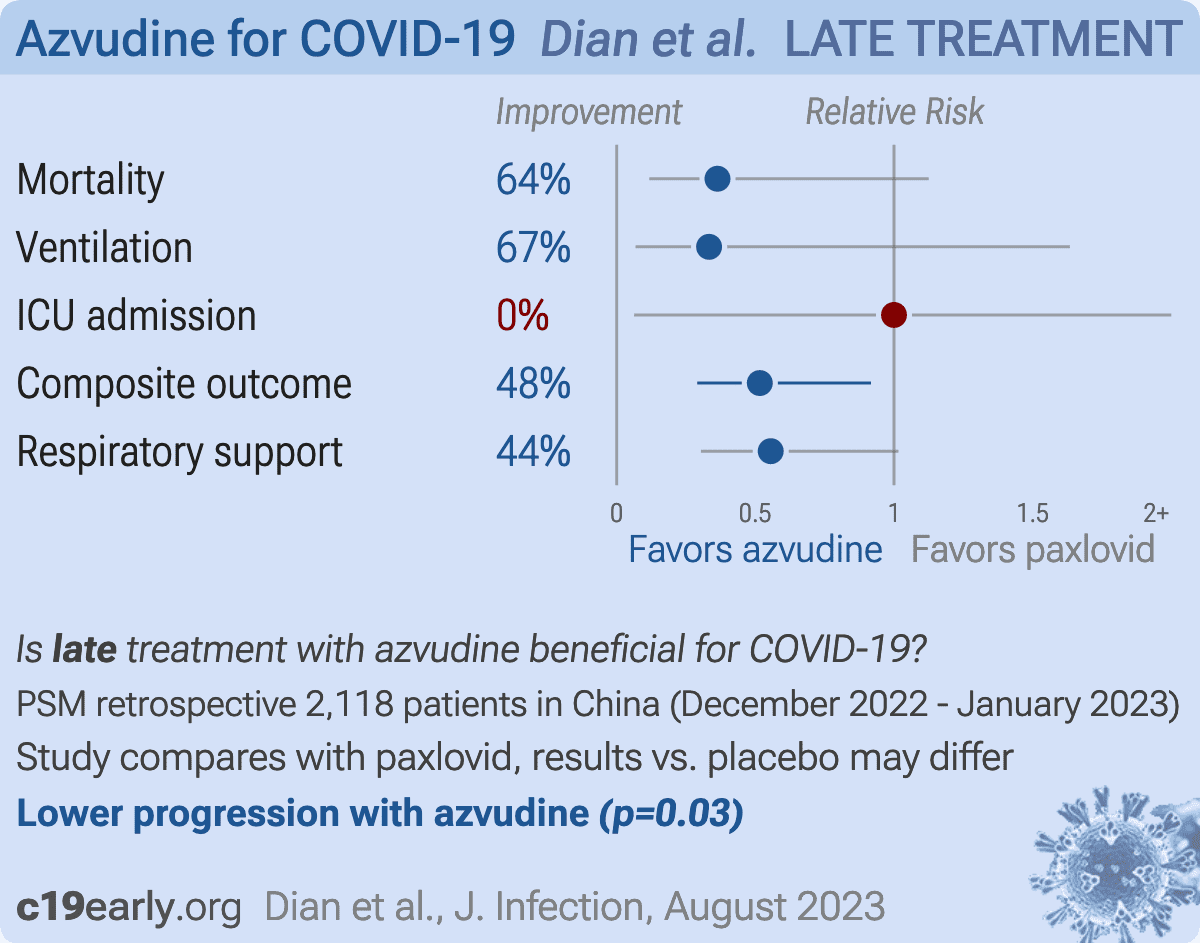
Retrospective 2,118 hospitalized COVID-19 patients in China, showing improved results with azvudine vs. paxlovid.
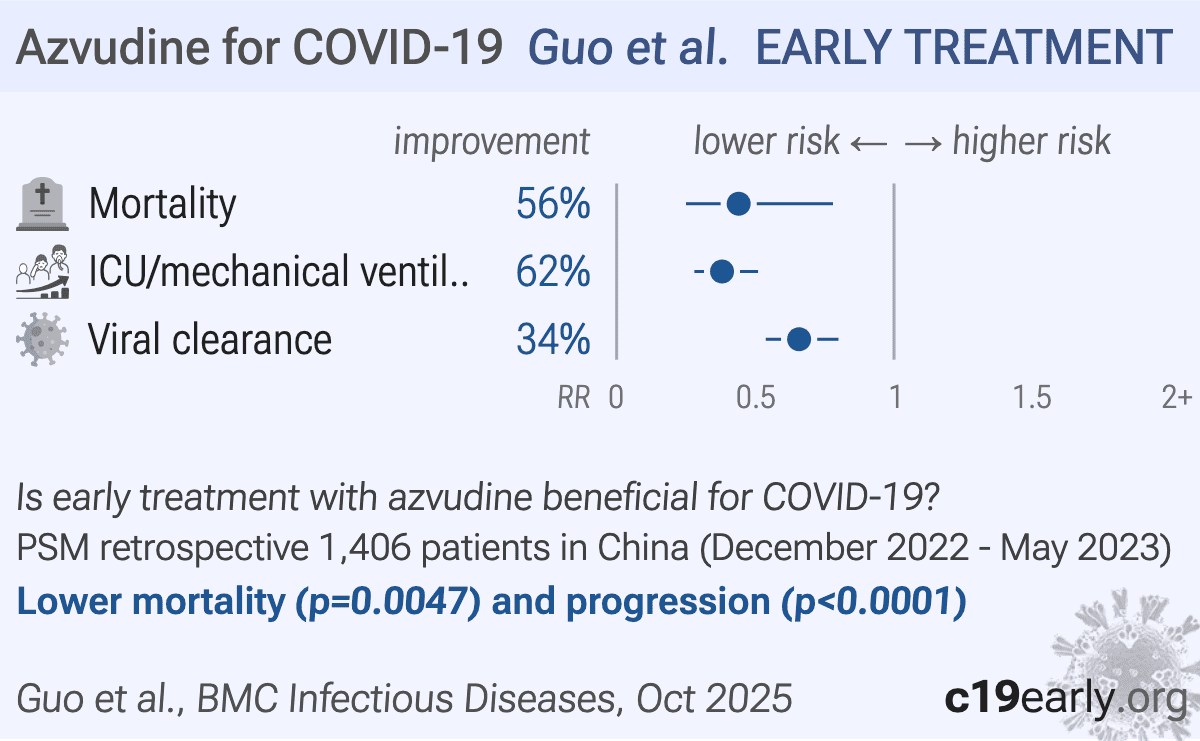
Retrospective 1,406 hospitalized COVID-19 patients (703 matched pairs) in China showing significantly lower mortality and mechanical ventilation/ICU admission, and faster viral clearance with azvudine.
PSM retrospective 6,218 hospitalized COVID-19 patients in China showing lower 28-day all-cause mortality with azvudine treatment compared to controls (HR 0.63, 95% CI 0.40-1.00). Subgroup analysis found significantly faster clinical improvement when azvudine was initiated within 5 days of symptom onset compared to controls.
Retrospective 7,216 hospitalized COVID-19 patients in China showing reduced mortality and composite outcomes with azvudine treatment.
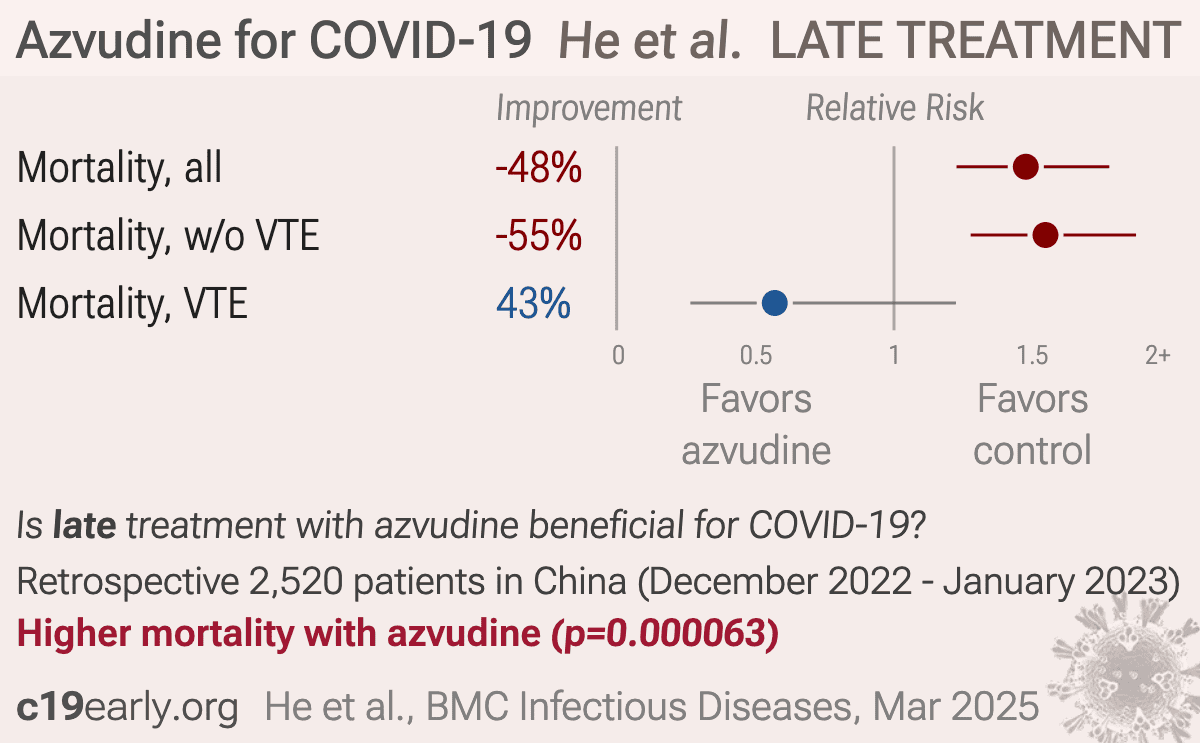
Retrospective 2,520 hospitalized COVID-19 pneumonia patients focusing on prophylactic anticoagulation but also reporting results for azvudine and paxlovid.
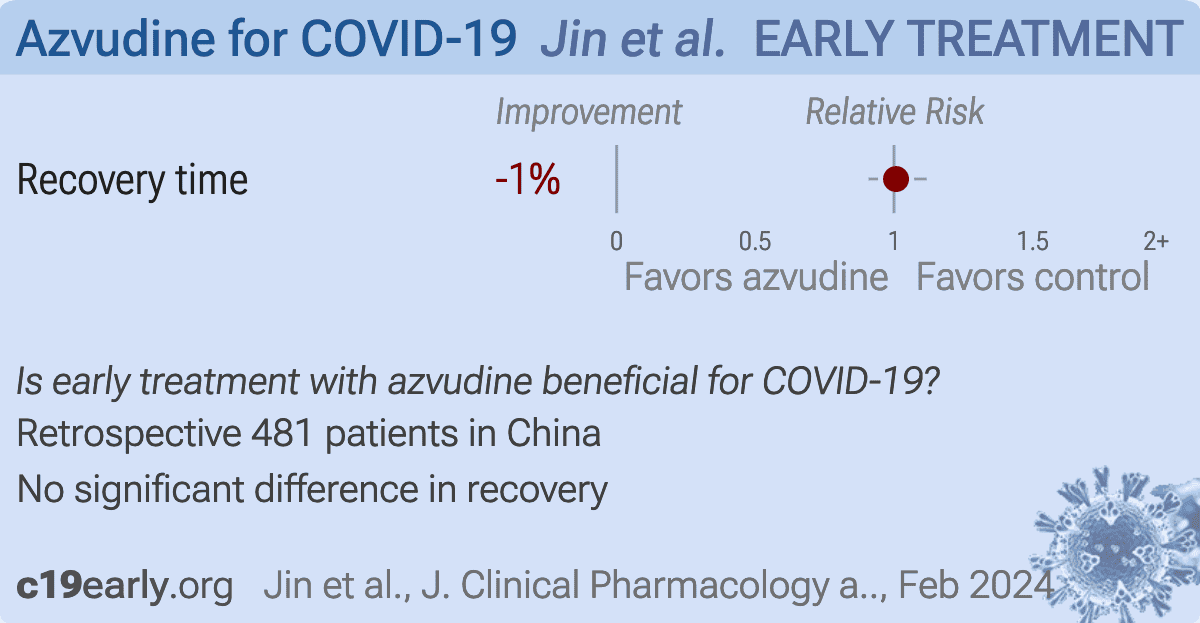
Retrospective 481 low-risk COVID-19 patients in China showing no significant difference in recovery or symptomatic severity with azvudine, but slightly lower total viral load.
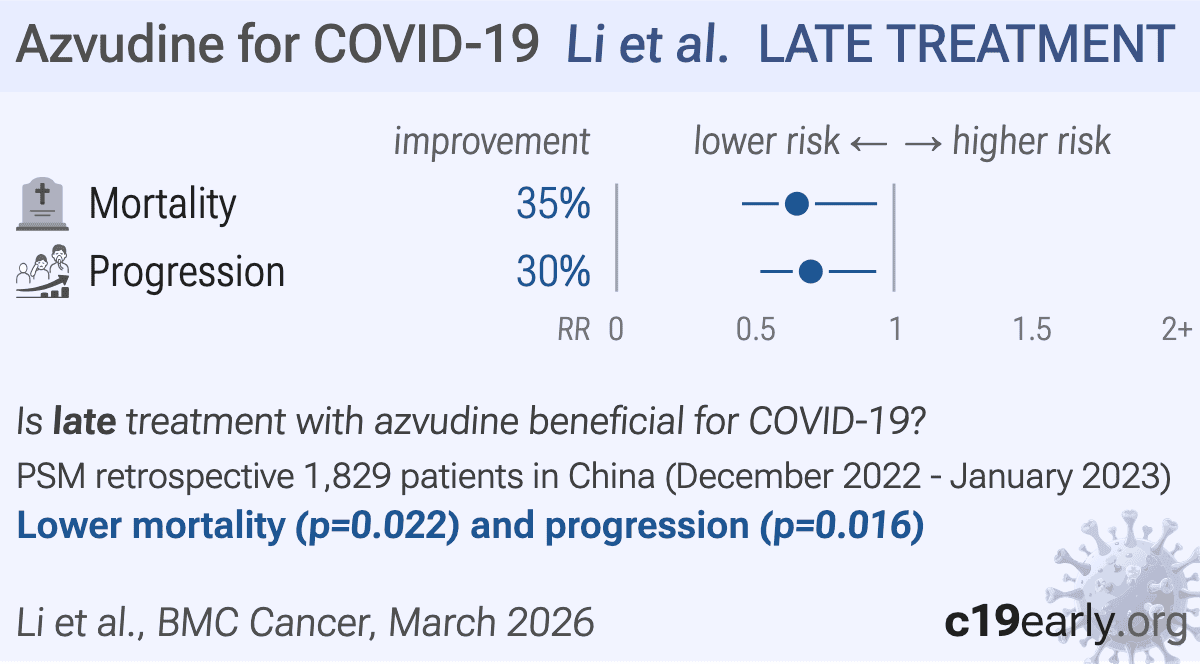
Retrospective 1,829 hospitalized cancer patients with COVID-19 in China showing lower mortality and disease progression with azvudine treatment.
While the authors used a PSM-matched cohort for efficacy, they used 'Available data' (unmatched cohorts: Control n=5609, Azvudine n=593) for the safety analysis in Table 2. In the unmatched data, the azvudine group had significantly higher baseline severity (21.8% severe vs 8.7% in control). Therefore the reported 'distinct toxicity profile' (e.g., higher hypokalemia, lymphocyte changes) is confounded by the fact that the azvudine group was substantially sicker at baseline.
The control group has 105 events over 11,009 person-days (1,200 patients), while the azvudine group has 47 events over 7,612 person-days (629 patients), or roughly 9.2 person-days per patient in the control group versus 12.1 person-days per patient in the azvudine group. If censoring at discharge were non-informative, we would expect roughly similar average follow-up times between groups. Instead, control patients have substantially shorter follow-up on average. This suggests control patients were being discharged (and thus censored) earlier, and since these are the patients who survived to discharge, healthier control patients are being removed from the risk set sooner. That preferentially leaves sicker control patients under observation, inflating the apparent mortality rate in the control group relative to the azvudine group. The raw HR of ~0.86 from the death counts in the PSM groups may be more accurate.
On page 12, the text states '47 deaths occurred in the azvudine group compared with 104 in the control group.' However, the forest plot in Figure 3 explicitly lists '105' events for the control group under all-cause death.
The observation endpoint is defined as 'discharge date, or day 30'. Patients who recover and are discharged early are censored from the mortality analysis at that time. Because healthier patients have systematically shorter follow-up times, this introduces informative censoring that biases the Kaplan-Meier estimates and person-time incidence calculations.
Table 2 contains several calculation errors. For example, azvudine hypokalemia is reported as 193/456 (42.32%) but listed as 43%; control ALT increased is 256/1779 (14.39%) but listed as 14.7%; azvudine lymphocyte count decreased is 220/593 (37.09%) but listed as 36.9%.
The authors state 'All authors declare that they have no competing interests.' However, the senior author (Z.R.) was the lead investigator on previous trials establishing avudine's efficacy.
Table 1 reports continuous variables using mean and standard deviation for laboratory parameters where the standard deviation drastically exceeds the mean. Because these values cannot be negative, this indicates extreme right-skewness, making mean/SD statistically misleading.
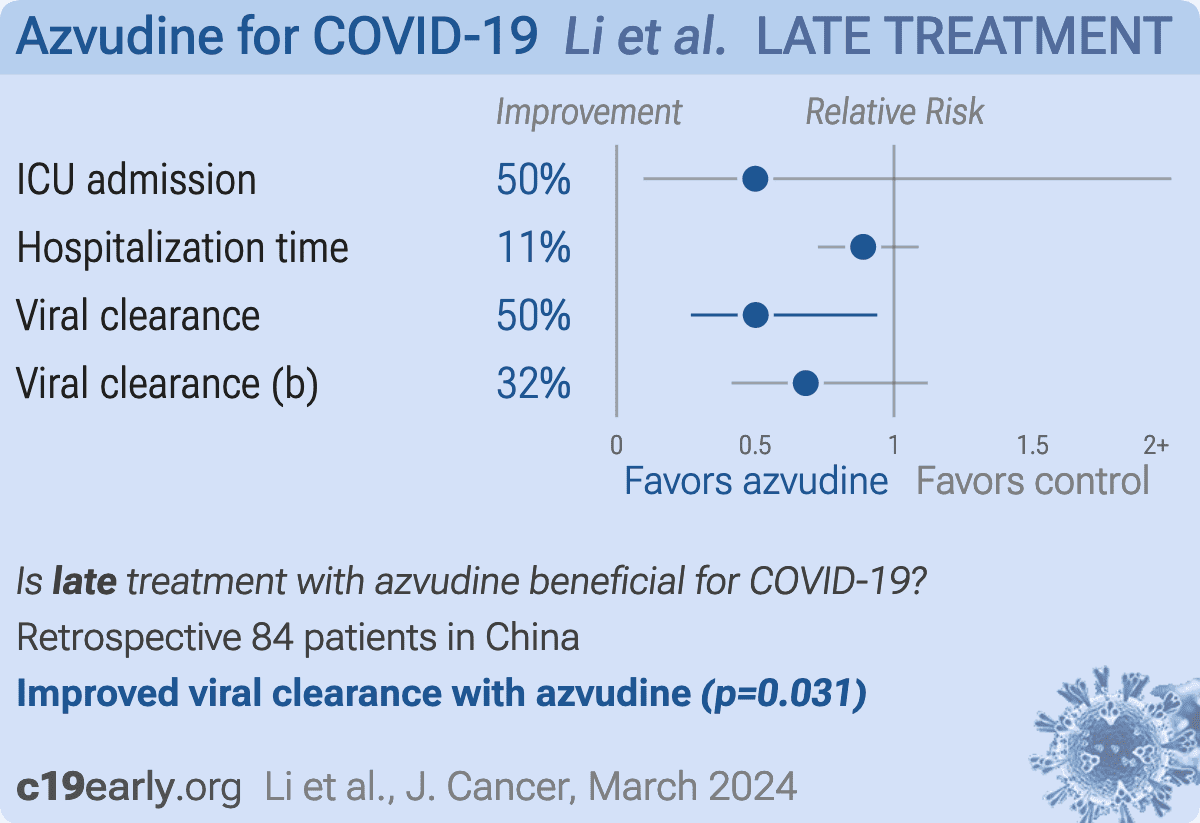
PSM retrospective 84 hospitalized COVID-19 patients with pre-existing cancer in China, showing faster viral clearance with azvudine. There was no significant difference in length of hospital stay or ICU admission.
Retrospective 4,201 hospitalized COVID-19 patients in China, showing lower mortality with azvudine.
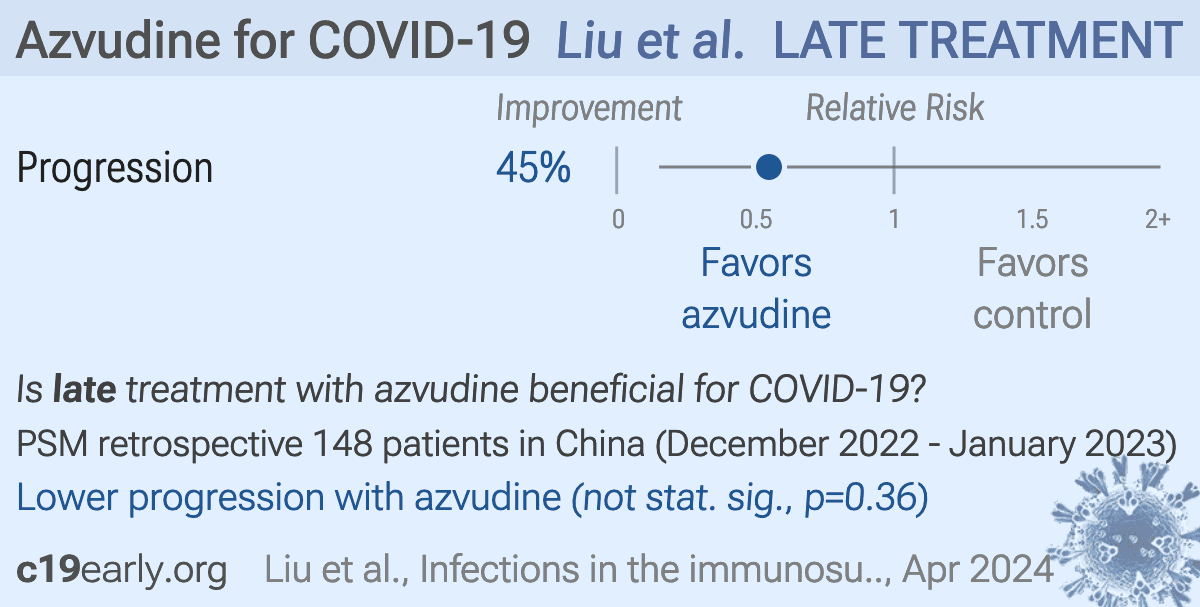
Retrospective 148 hospitalized kidney transplant patients with COVID-19 in China showing lower risk of disease progression with azvudine treatment compared, and higher risk with paxlovid treatment.
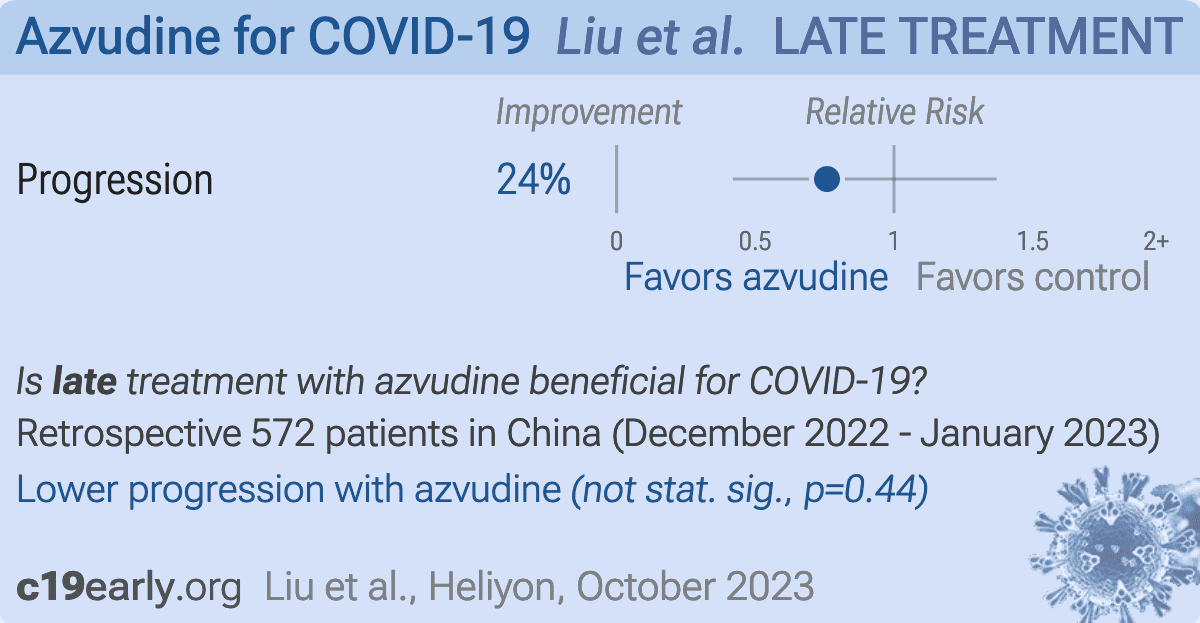
Retrospective 572 fully vaccinated hospitalized patients in China, showing lower risk with azvudine treatment, without statistical significance. The composite outcome included intubation, non-invasive respiratory support, ICU admission, and all-cause death. Azvudine was not included in the multivariable analysis (only combined antiviral therapy was used without explanation).
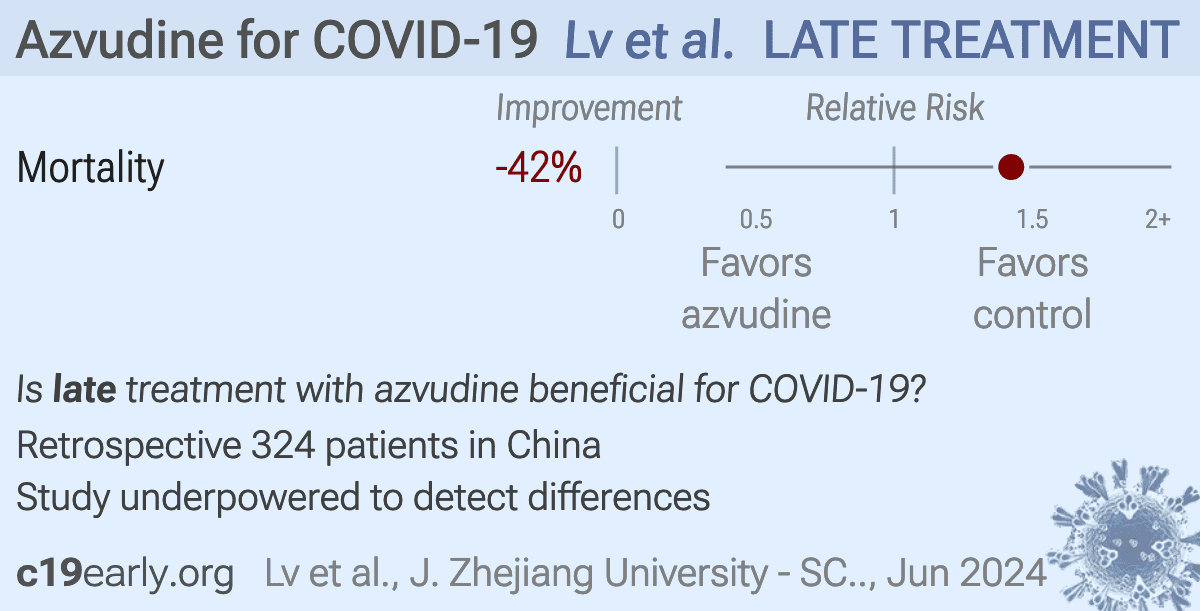
Retrospective 324 hospitalized kidney transplant recipients with COVID-19 showing no significant benefit with molnupiravir, paxlovid, or azvudine. The study was conducted during the omicron wave in China between December 2022 and January 2023. Adjusted results are only provided for all antivirals combined, however the results are similar before and after adjustment. Multivariable Cox regression analysis for all antivirals combined showed an adjusted hazard ratio for mortality of 6.06, p=0.099. While adjustment includes factors related to baseline severity, there may be residual confounding by indication.
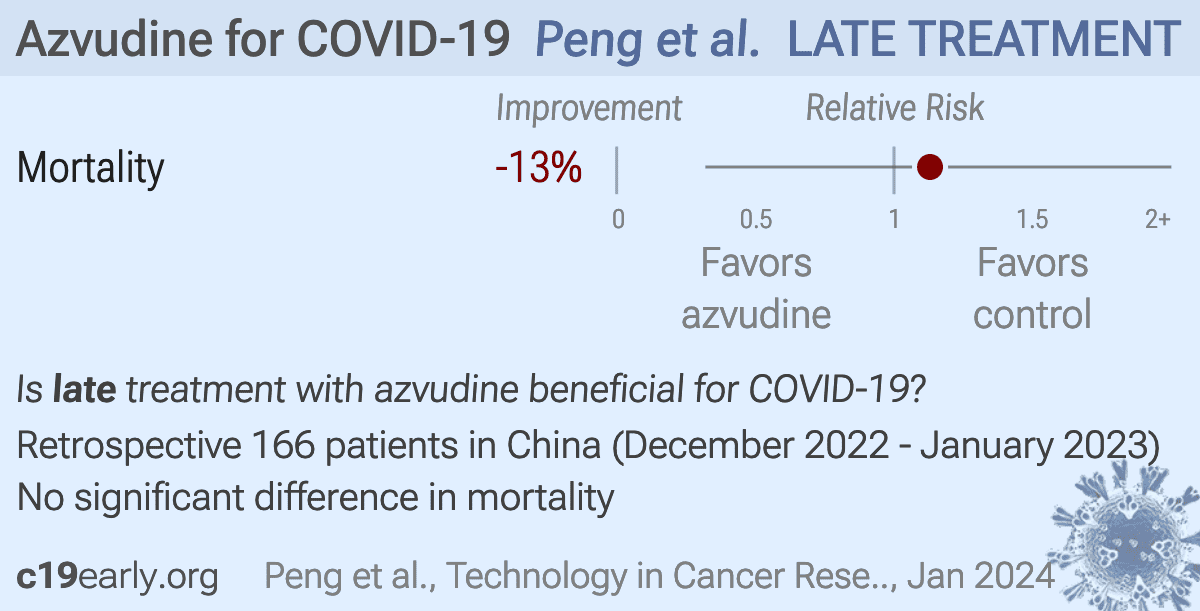
Retrospective 166 hospitalized NSCLC patients with COVID-19 showing no significant difference in mortality with paxlovid or azvudine in univariate analysis.
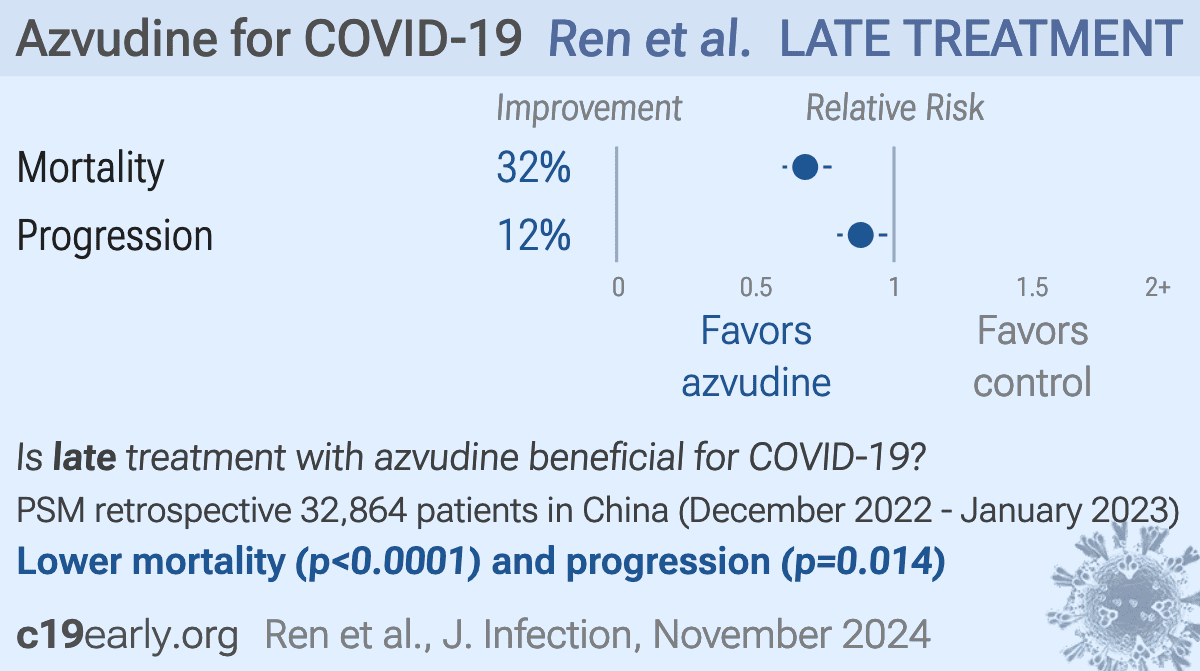
PSM retrospective 32,864 hospitalized COVID-19 patients in China showing lower all-cause mortality and disease progression with azvudine treatment.
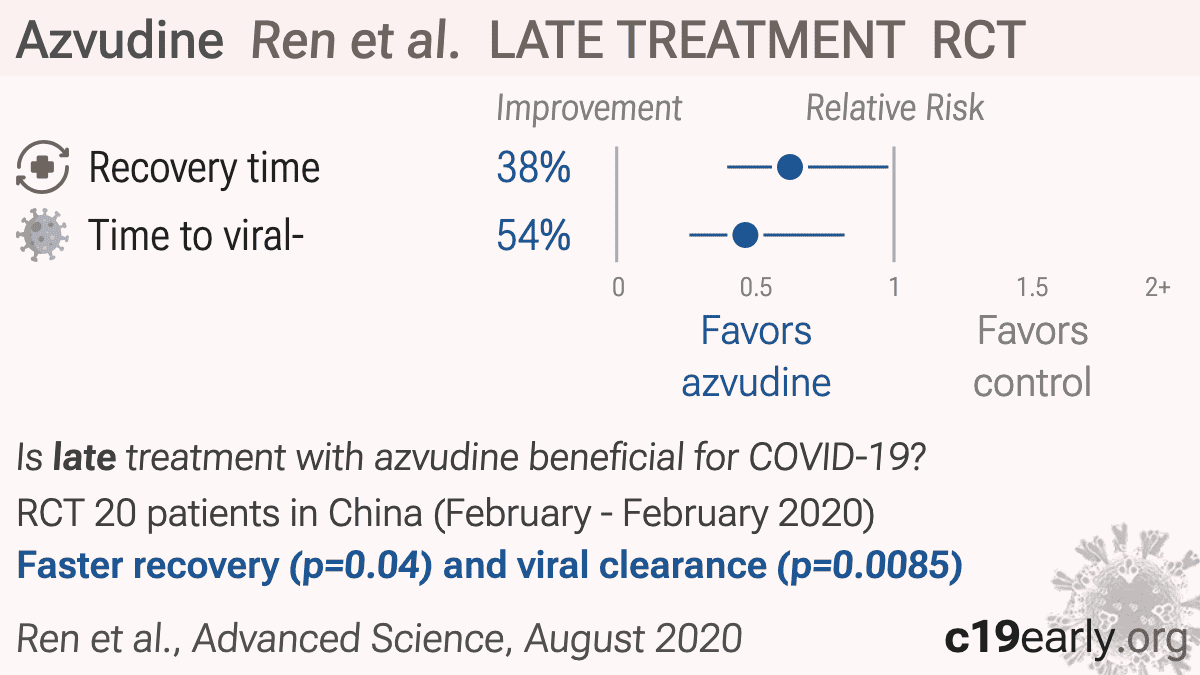
RCT 20 mild COVID-19 patients showing faster viral clearance and pneumonia improvement in chest CT images with azvudine treatment.
Retrospective 1,082 severely and critically ill COVID-19 patients in China showing lower 60 day mortality with azvudine. Mortality was also lower with paxlovid, but without statistical significance, and health related quality of life was significantly lower for paxlovid patients at 60 days.
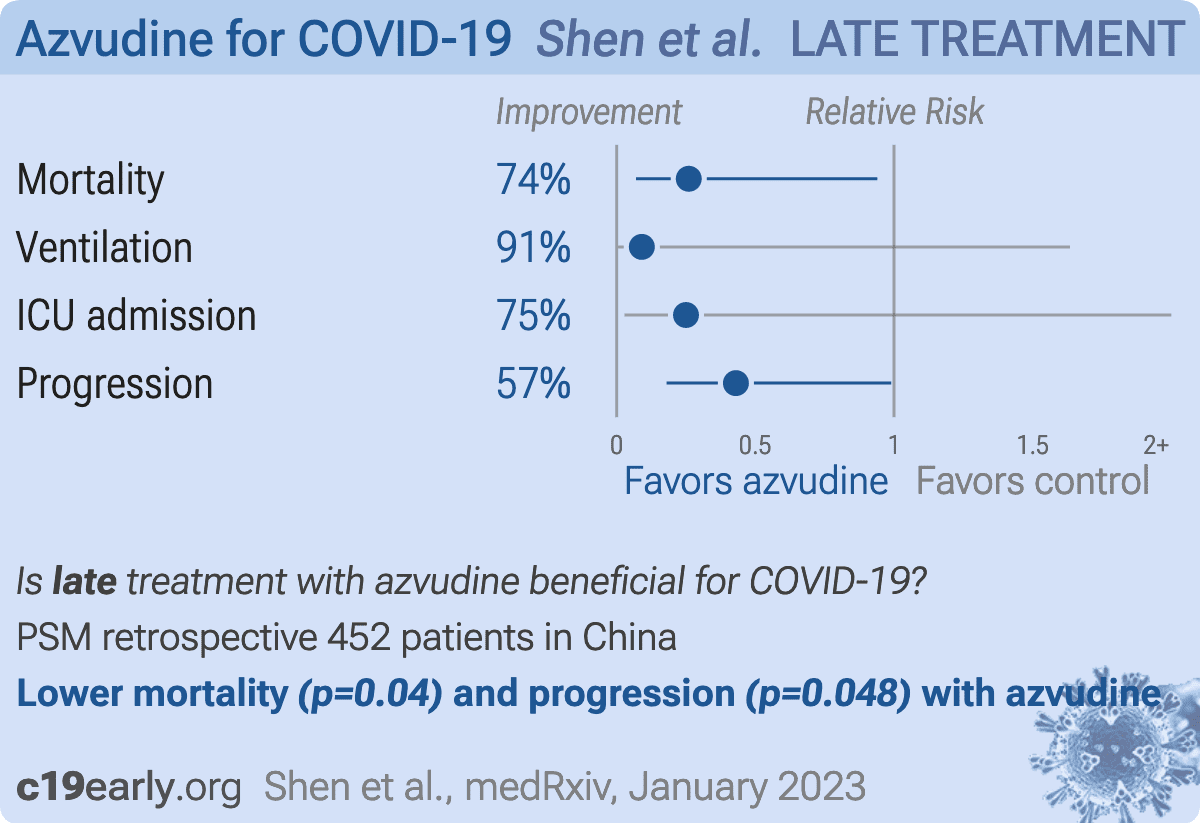
PSM retrospective 900 hospitalized COVID-19 patients in China showing lower risk of disease progression and death with azvudine treatment.
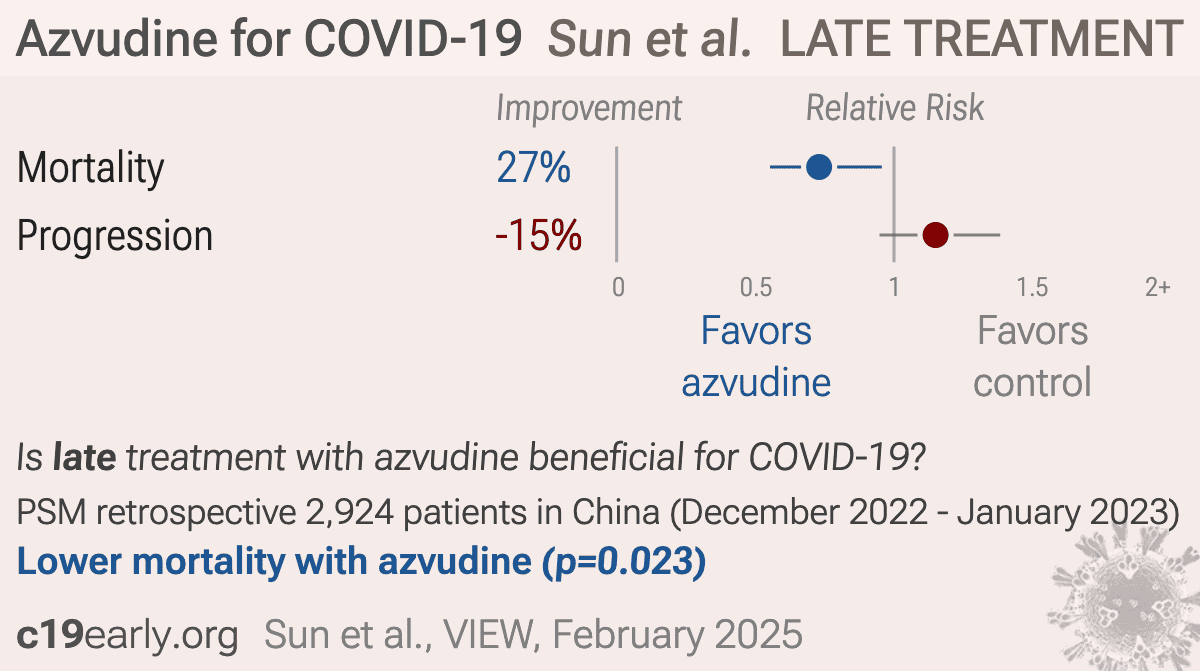
Retrospective 2,924 hospitalized COVID-19 patients with chronic respiratory diseases in China, showing lower all-cause mortality with azvudine, but no significant difference in composite disease progression.
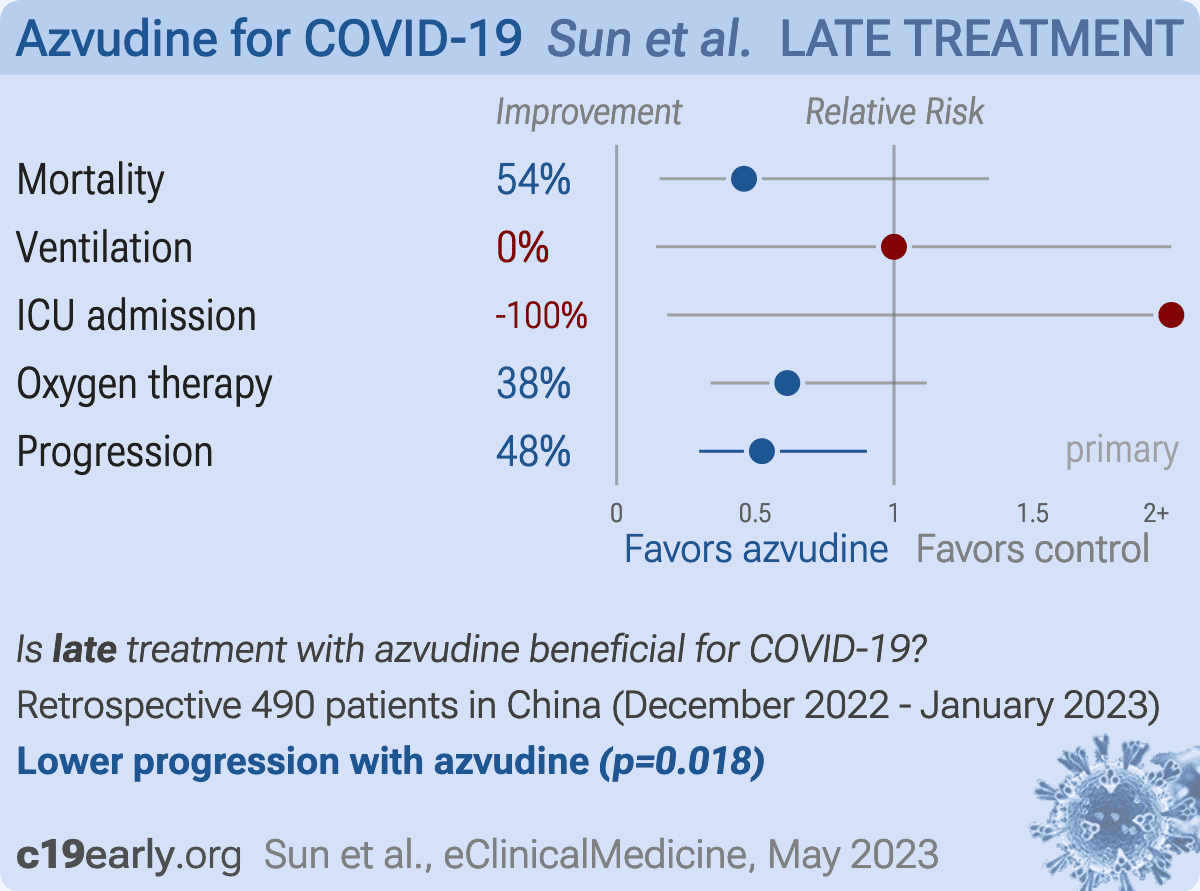
PSM retrospective 490 hospitalized COVID-19 patients with pre-existing conditions in China showing that azvudine was associated with a significantly lower risk of the composite outcome of disease progression, driven largely by lower rates of non-invasive respiratory support. However, there was no significant difference in all-cause mortality or other individual outcomes like ICU admission or invasive mechanical ventilation between the azvudine and control groups.
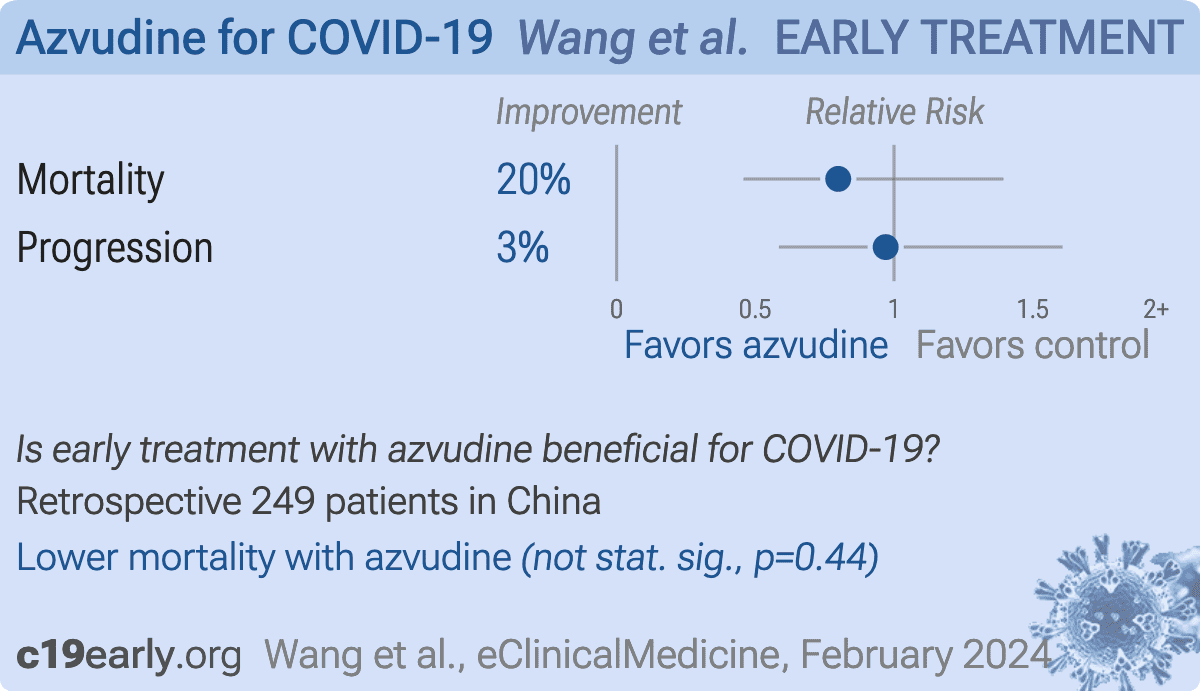
Retrospective 249 elderly patients with severe COVID-19, 128 treated with azvudine, 66 treated with paxlovid, and 55 receiving neither treatment, showing no significant differences for Ct value changes, progression, or survival for either treatment. Early viral decline was faster with paxlovid, without statistical significance.
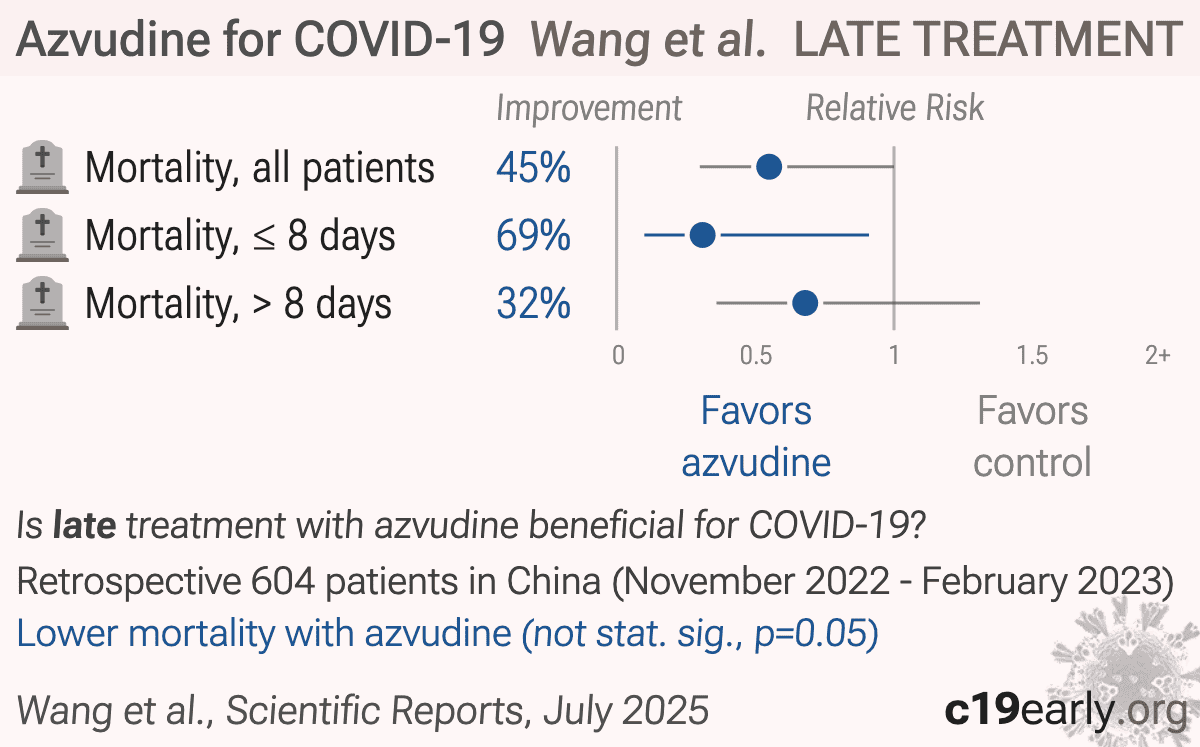
PSM retrospective 604 COVID-19 patients (302 receiving azvudine, 302 controls) showing reduced mortality with azvudine treatment when administered within 8 days of symptom onset.
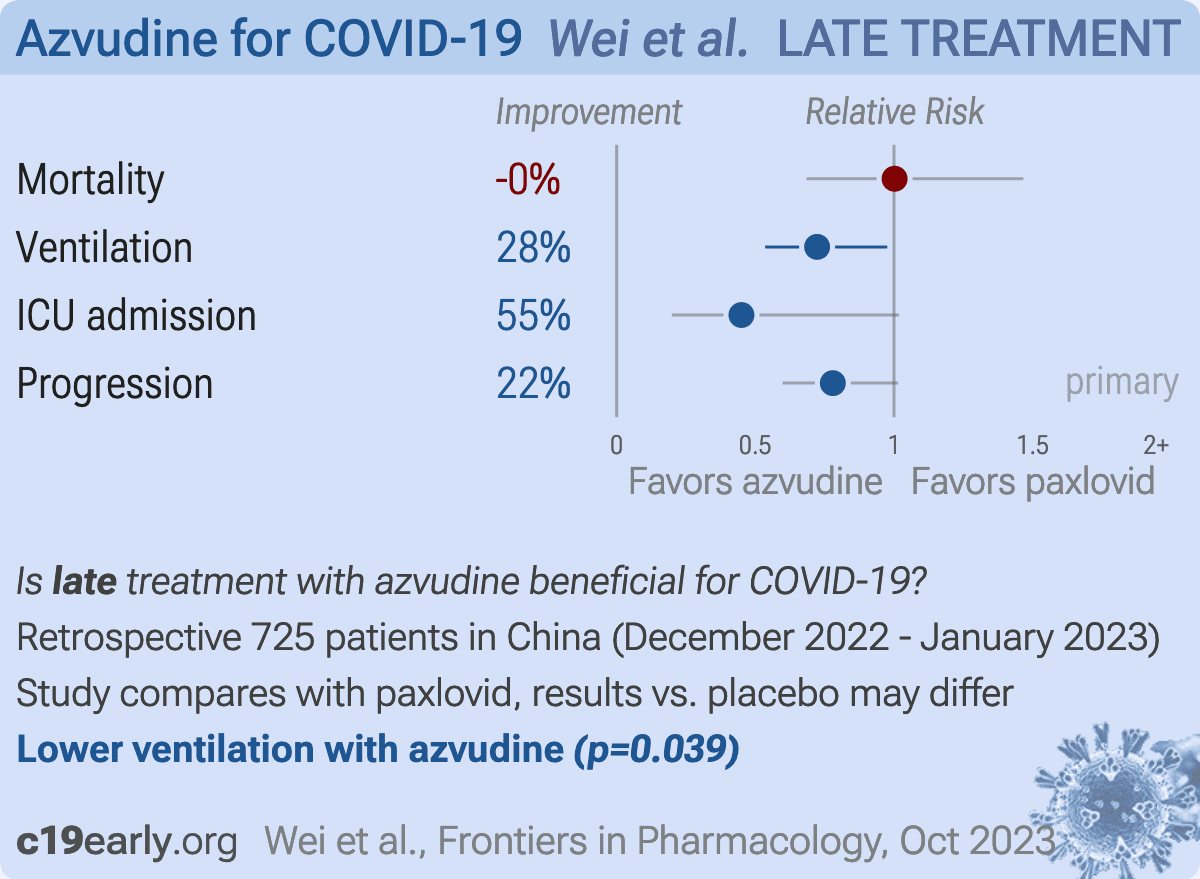
PSM retrospective 725 hospitalized COVID-19 patients in China compared the effectiveness and safety of the oral antivirals azvudine and paxlovid. There was no significant difference in the risk of disease progression between groups, but azvudine was associated with lower ICU admission and invasive ventilation use.
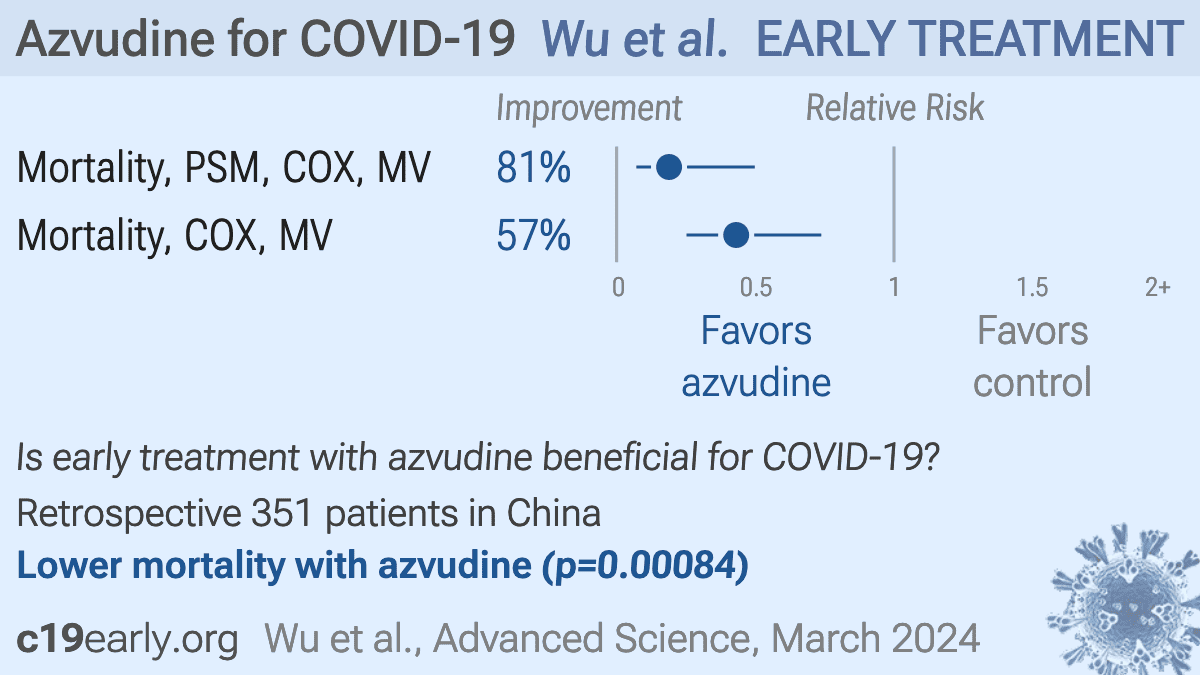
Retrospective 351 hospitalized COVID-19 patients with pre-existing cardiovascular diseases in China, showing lower mortality with azvudine treatment.
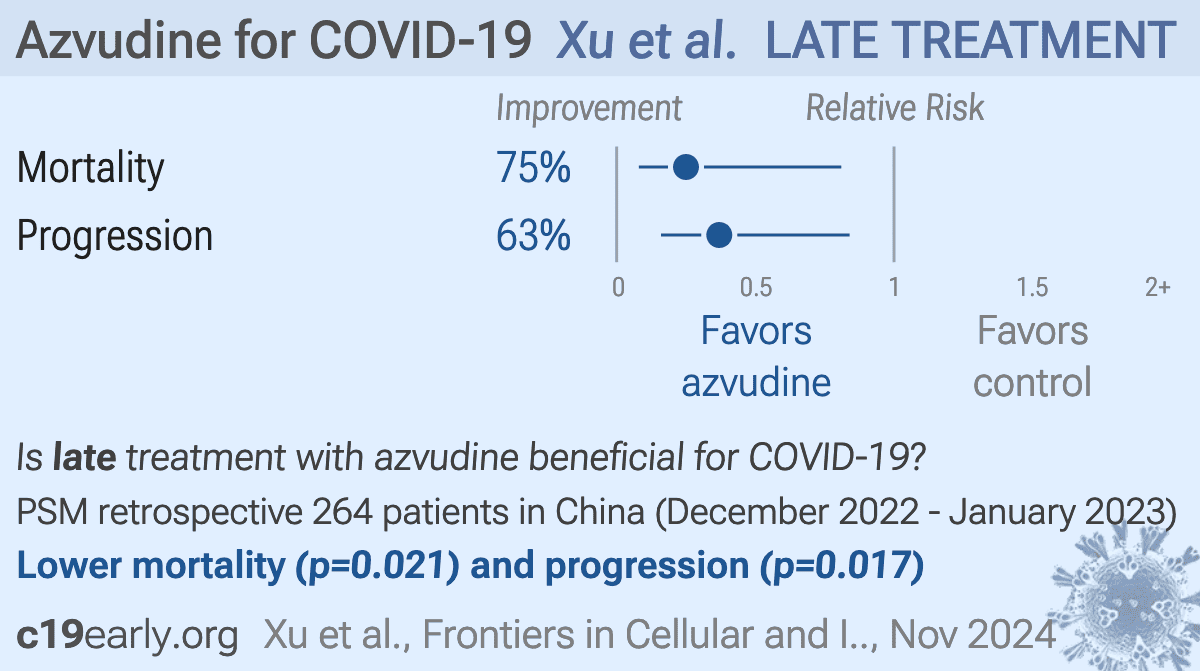
Retrospective 264 hospitalized COVID-19 patients in China showing lower risk of composite disease progression and all-cause mortality with azvudine treatment.
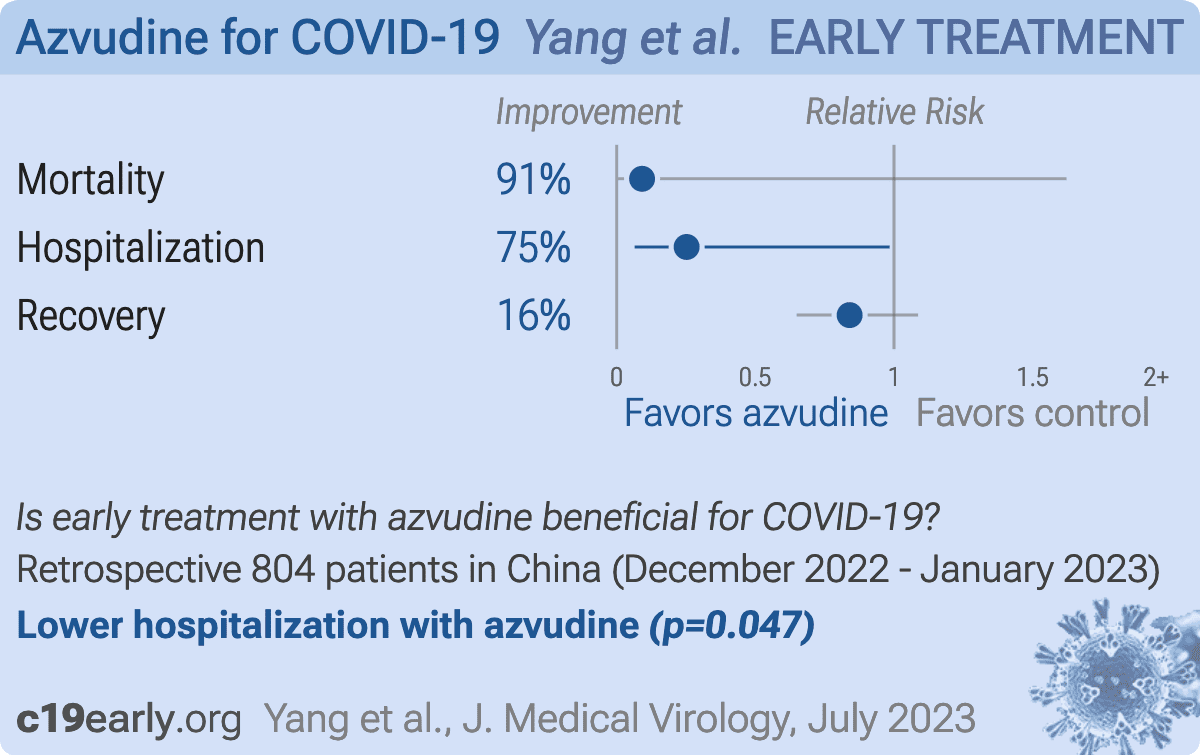
PSM retrospective 804 high-risk, nonhospitalized adults with mild to moderate COVID-19 in China. The study compared outcomes between 317 patients who received azvudine with 487 patients who received standard supportive treatment only. The azvudine group had a lower rate of disease progression (composite of death or COVID-19 hospitalization) at 28 days, as well as a lower rate of COVID-19 hospitalization specifically after adjusting for factors. In addition, azvudine shortened the duration of fever if given within 3 days of symptom onset. However, azvudine treatment was associated with a higher incidence of adverse effects, including mainly mild gastrointestinal and nervous system effects.
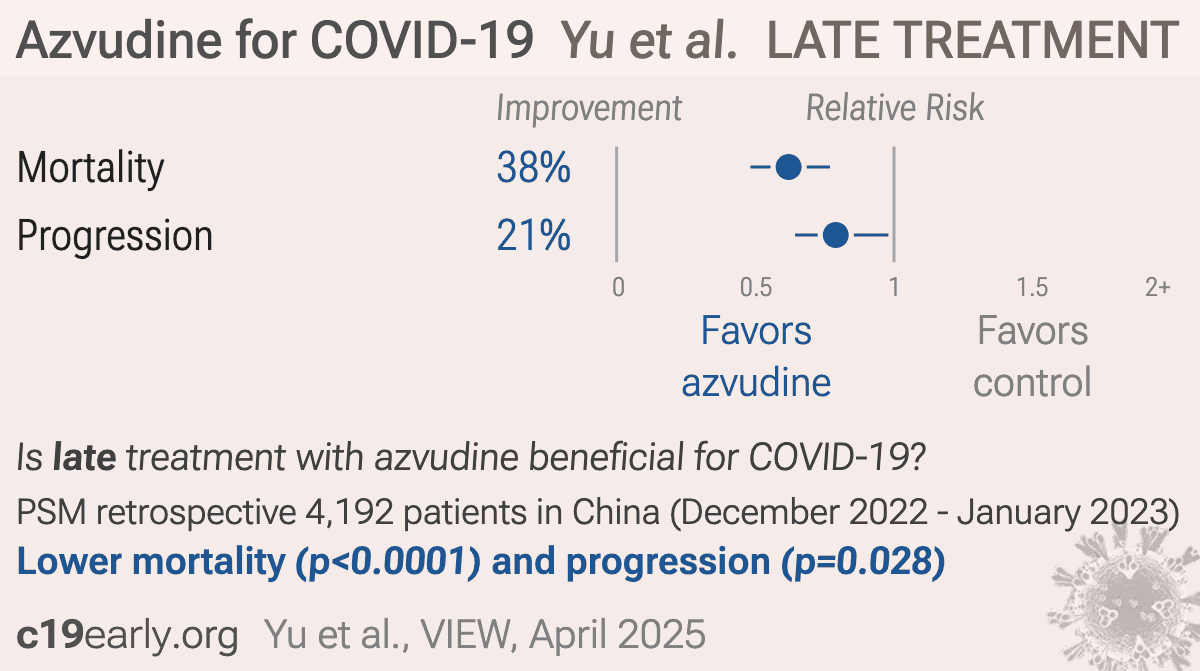
PSM retrospective 4,192 hospitalized COVID-19 patients with kidney disease showing significantly reduced all-cause mortality and disease progression with azvudine.
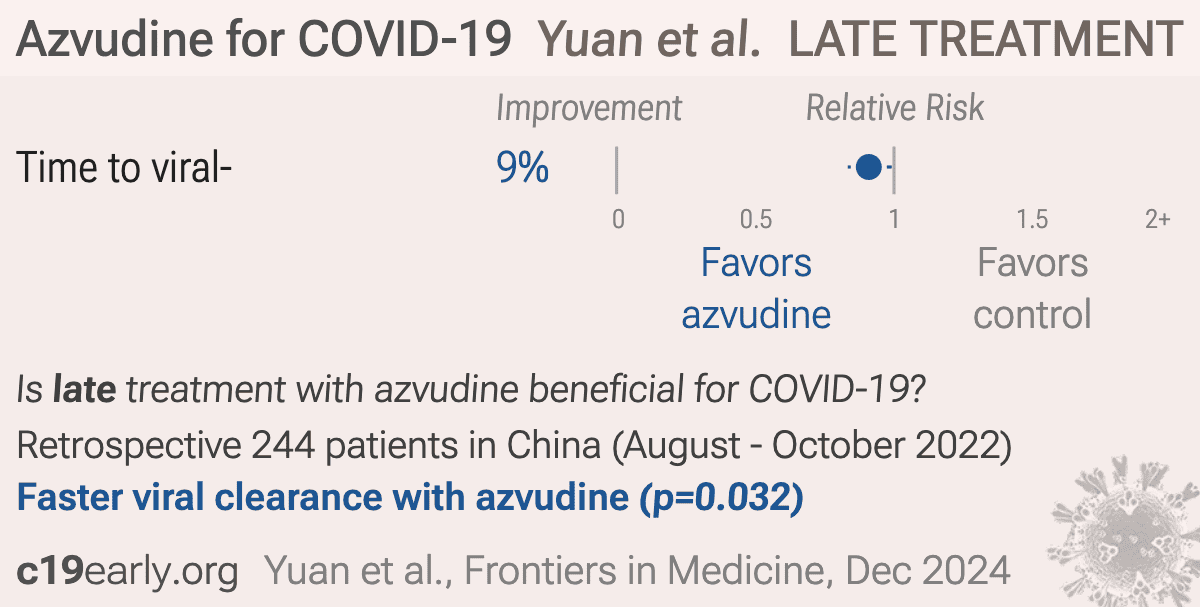
Retrospective 244 non-severe COVID-19 patients in China infected with Omicron BA.2.76 or BA.5.1 subvariants, showing improved viral clearance with azvudine.
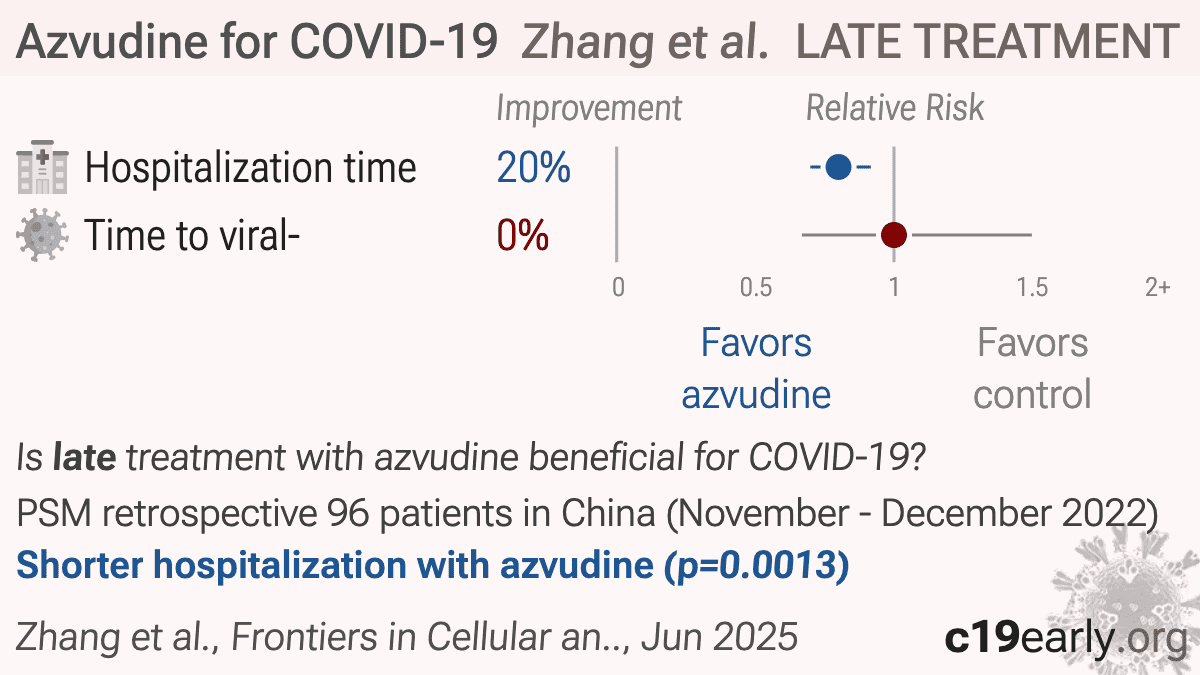
Retrospective 192 COVID-19 patients in China showing significantly shorter hospitalization with azvudine treatment, but no significant difference for viral clearance.
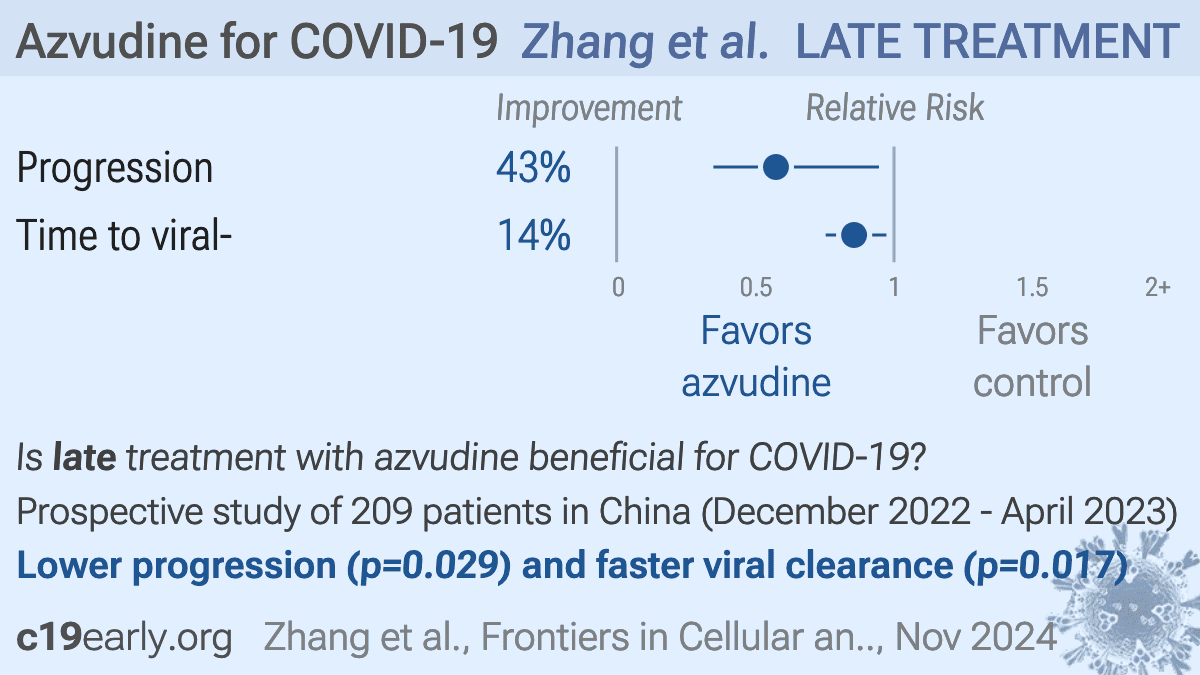
Prospective multicenter study of 209 severe hospitalized COVID-19 patients in China showing improved 28-day composite outcomes, faster viral clearance, and higher PaO2/FiO2 levels with azvudine plus dexamethasone compared to dexamethasone alone.
PSM retrospective 303 hospitalized patients treated with azvudine and 303 matched controls in China, showing shorter hospital stay and higher lymphocyte improvement rate, particularly for non-severe patients, however there were no significant differences for mortality, ICU admission, or mechanical ventilation.
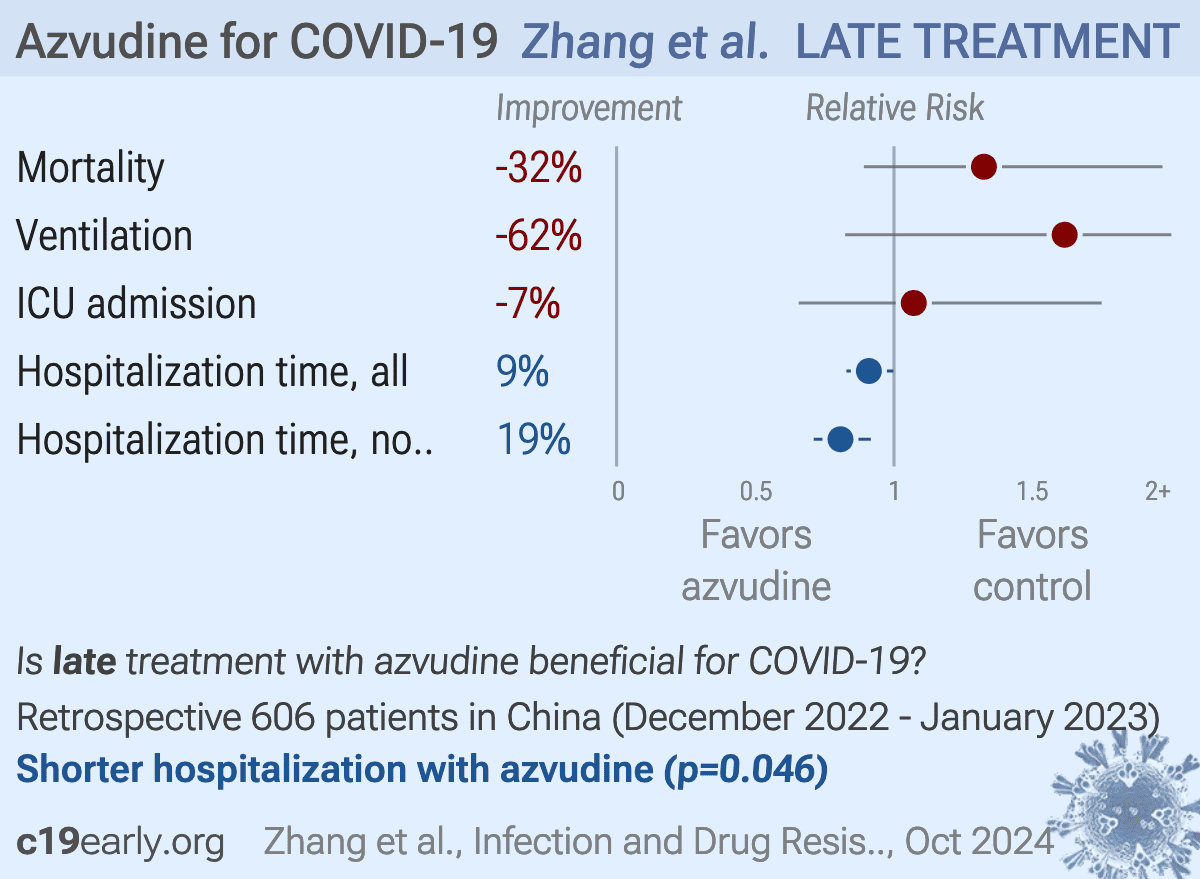
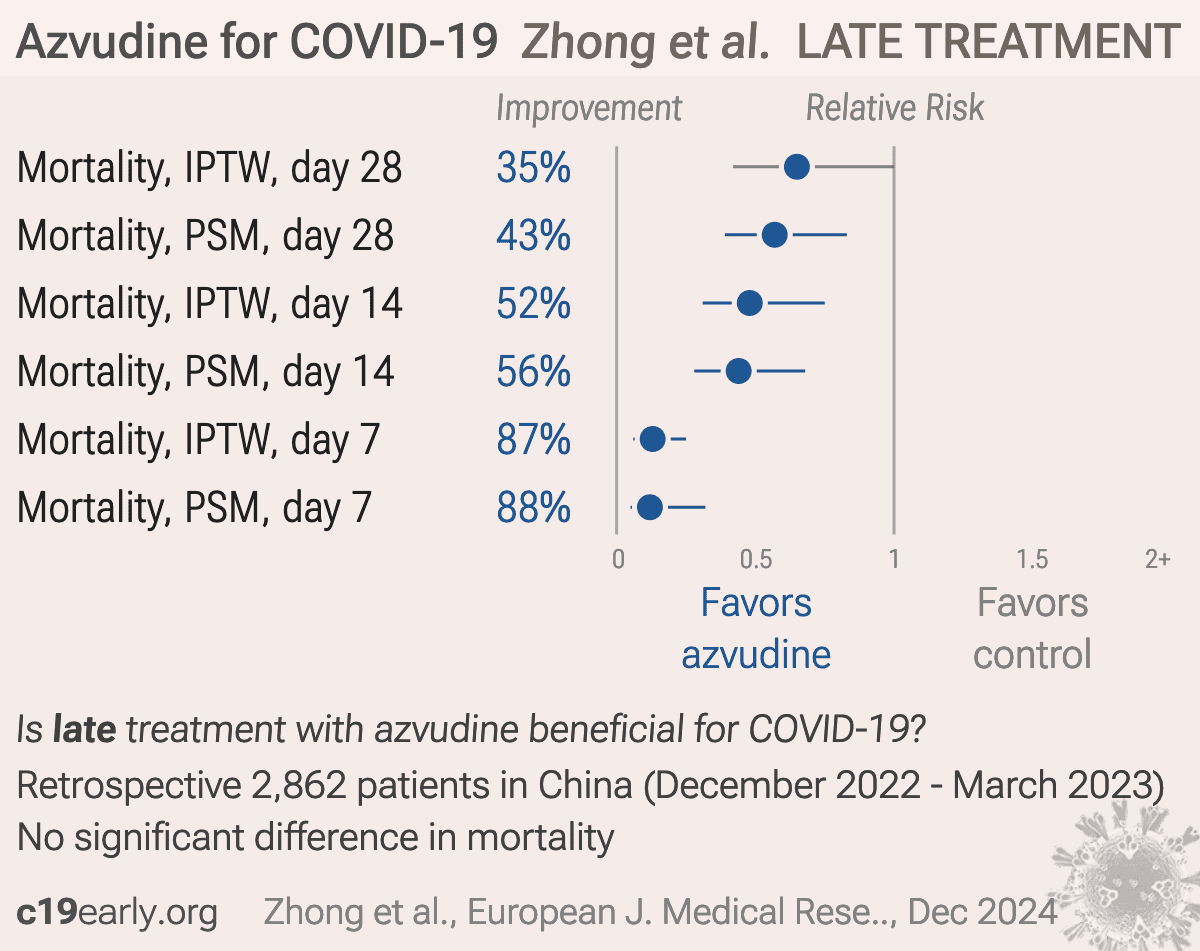
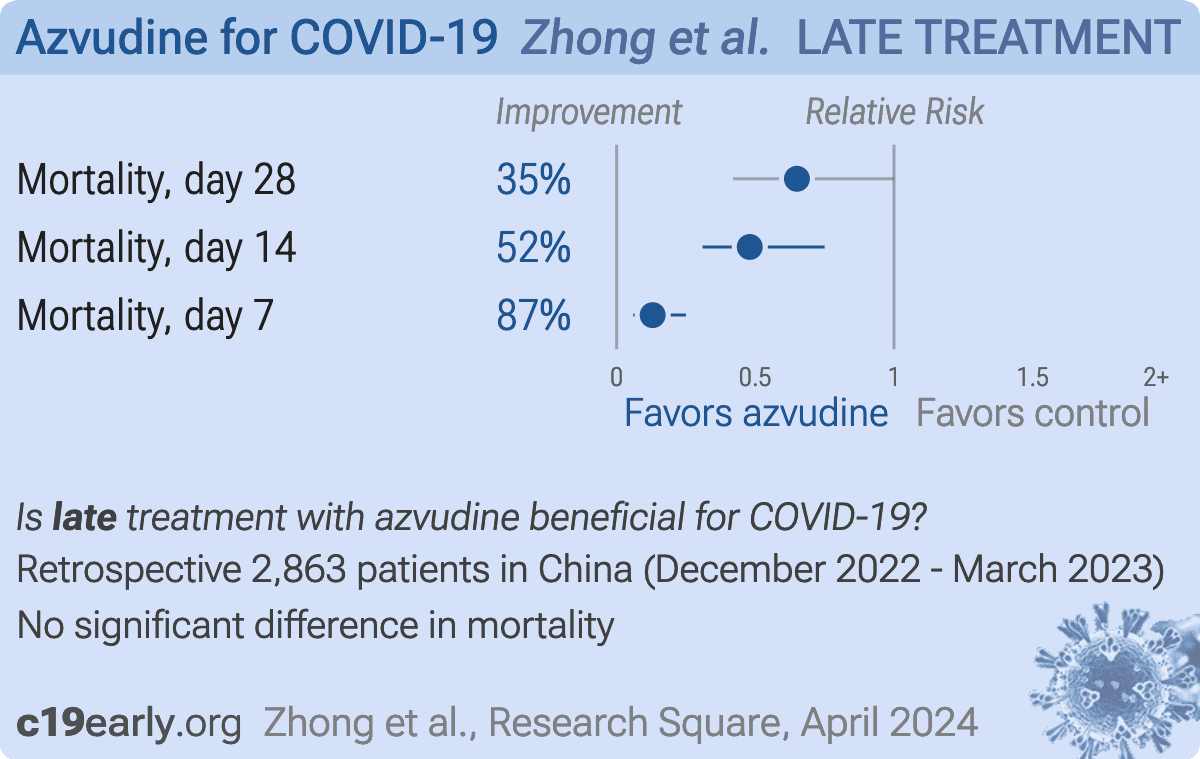
Retrospective 2,862 hospitalized COVID-19 patients in China showing lower mortality with azvudine treatment, with greater efficacy for severe and critical patients.
Retrospective 2,862 hospitalized COVID-19 patients in China showing lower mortality with azvudine treatment.
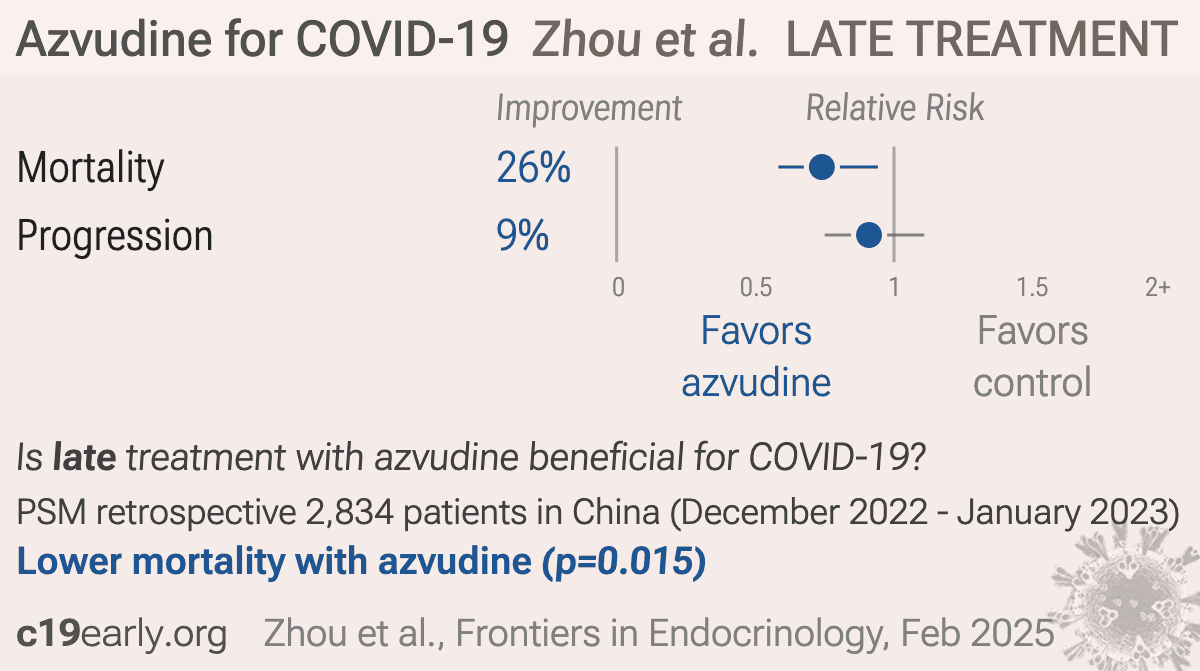
PSM retrospective 2,834 hospitalized COVID-19 patients with pre-existing diabetes in China showing lower all-cause mortality with azvudine, but no significant difference in composite disease progression.
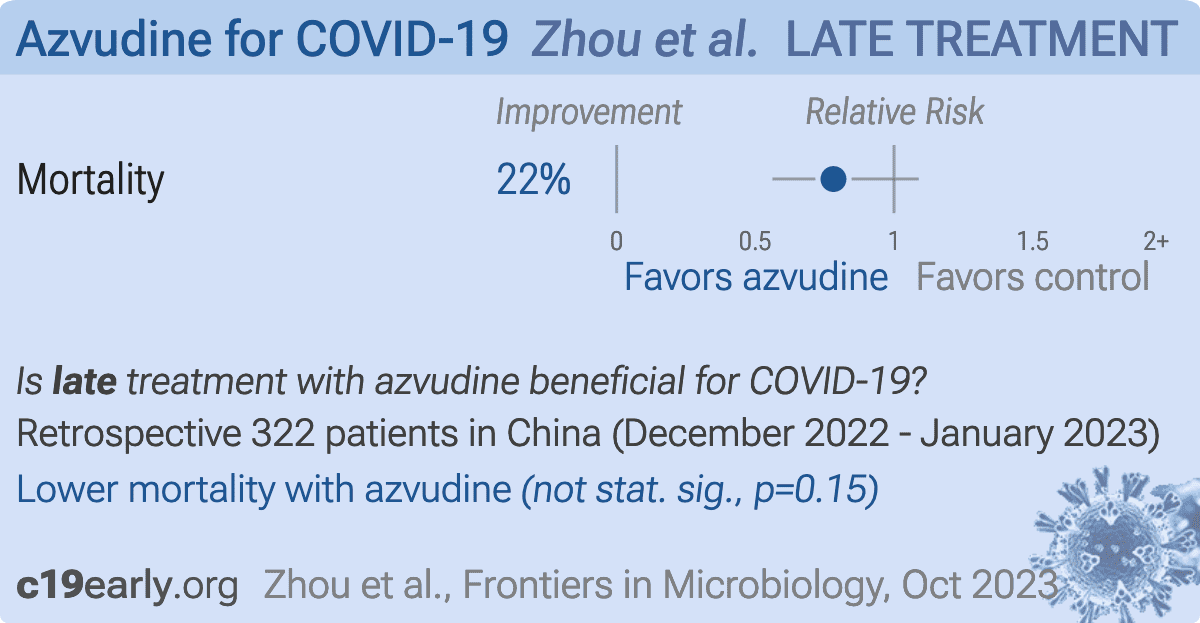
Retrospective 322 hospitalized patients ≥65 in China, showing lower mortality with azvudine treatment, without statistical significance.
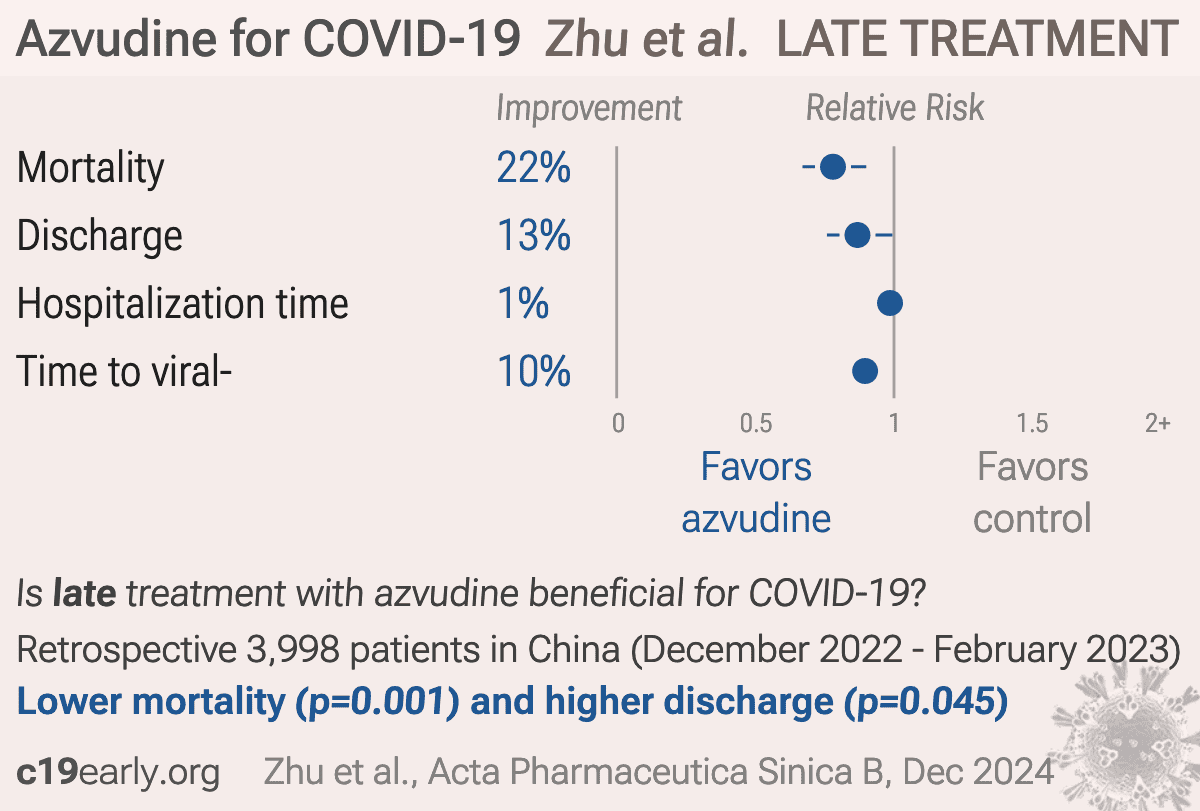
PSM retrospective 3,998 hospitalized COVID-19 patients aged 60 years and older in China showing lower all-cause mortality, higher rate of discharge, and shorter time to viral clearance with azvudine treatment.
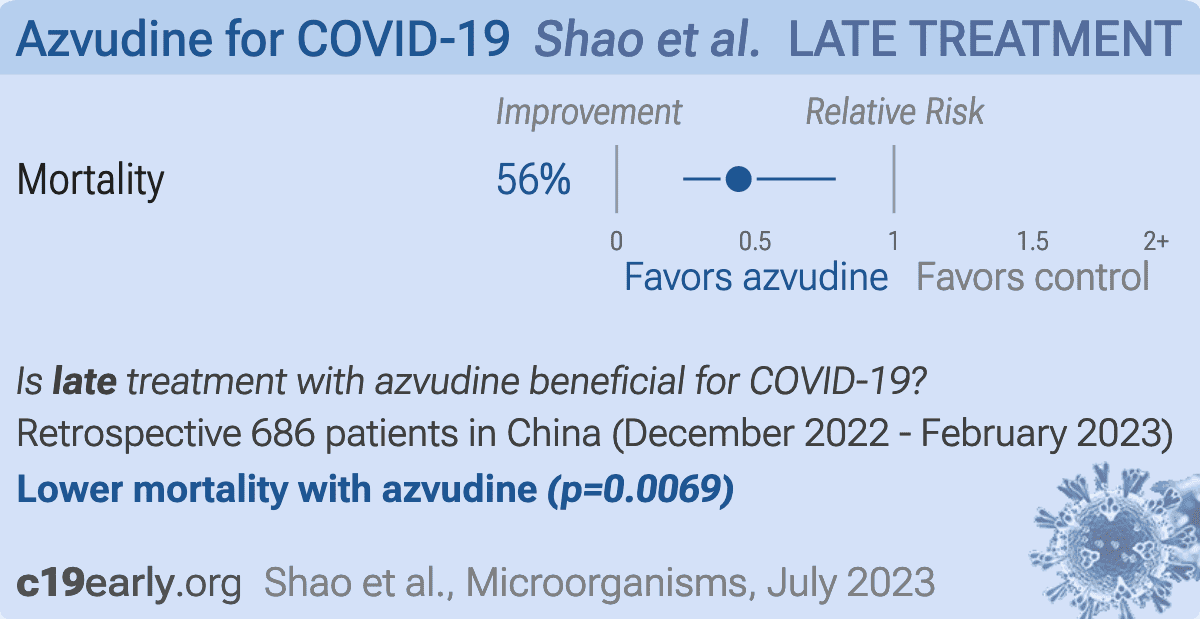
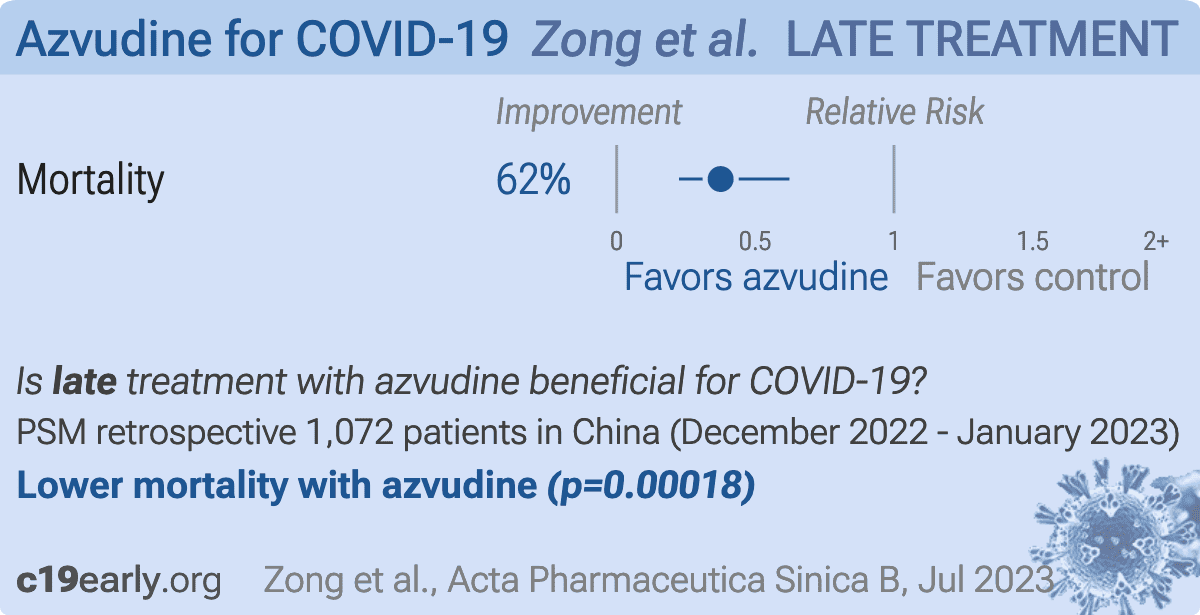
PSM retrospective 1072 hospitalized patients with COVID-19 pneumonia in China, showing lower mortality with azvudine treatment.
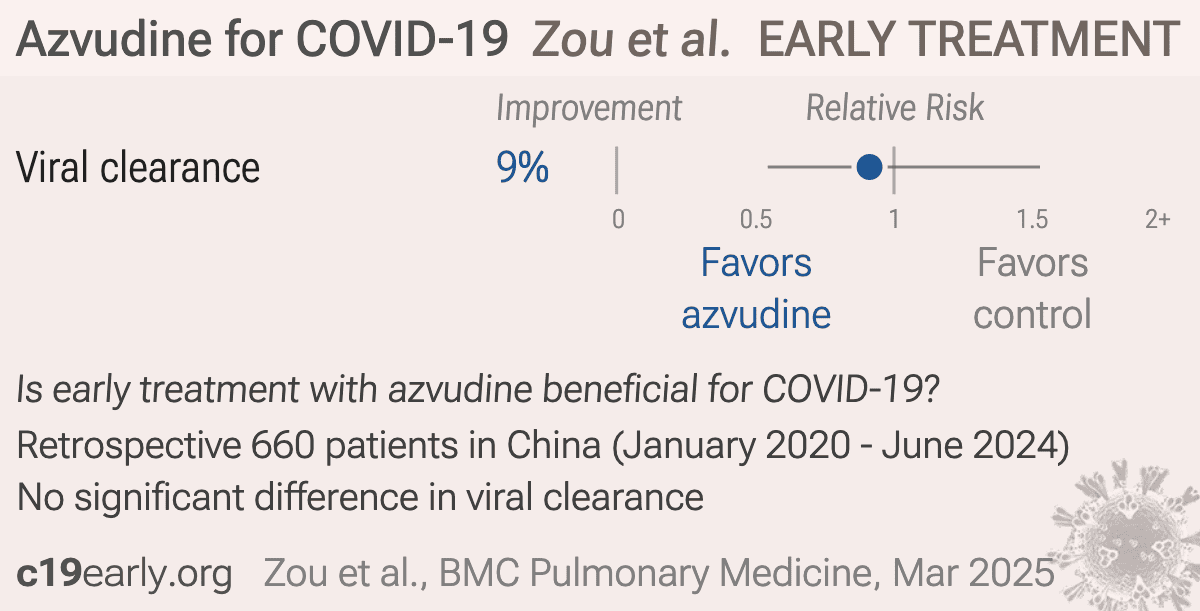
Retrospective 660 patients with non-Hodgkin lymphoma (NHL) and SARS-CoV-2 infection, identifying risk factors for persistent COVID-19. There was no significant difference in persistent SARS-CoV-2 infection with paxlovid, molnupiravir, or azvudine treatment in unadjusted results. The extended study time period adds potential confounding by time, however this should result in overestimating treatment effects due to the later availability of these treatments and reducing severity of infection over time.
We perform ongoing searches of PubMed, medRxiv, Europe PMC, ClinicalTrials.gov, The Cochrane
Library, Google Scholar, Research Square, ScienceDirect, Oxford University Press, the
reference lists of other studies and meta-analyses, and submissions to the site c19early.org, which regularly receives notification of studies upon
publication.
Search terms are azvudine and COVID-19 or SARS-CoV-2. Automated searches are performed twice daily, with all matches reviewed for inclusion.
All studies regarding the use of azvudine for COVID-19 that report a comparison with a
control group are included in the main analysis.
Sensitivity analysis is performed, excluding studies with major issues, epidemiological
studies, and studies with minimal available information.
Studies with major unexplained data issues, for example major outcome data that is
impossible to be correct with no response from the authors, are excluded.

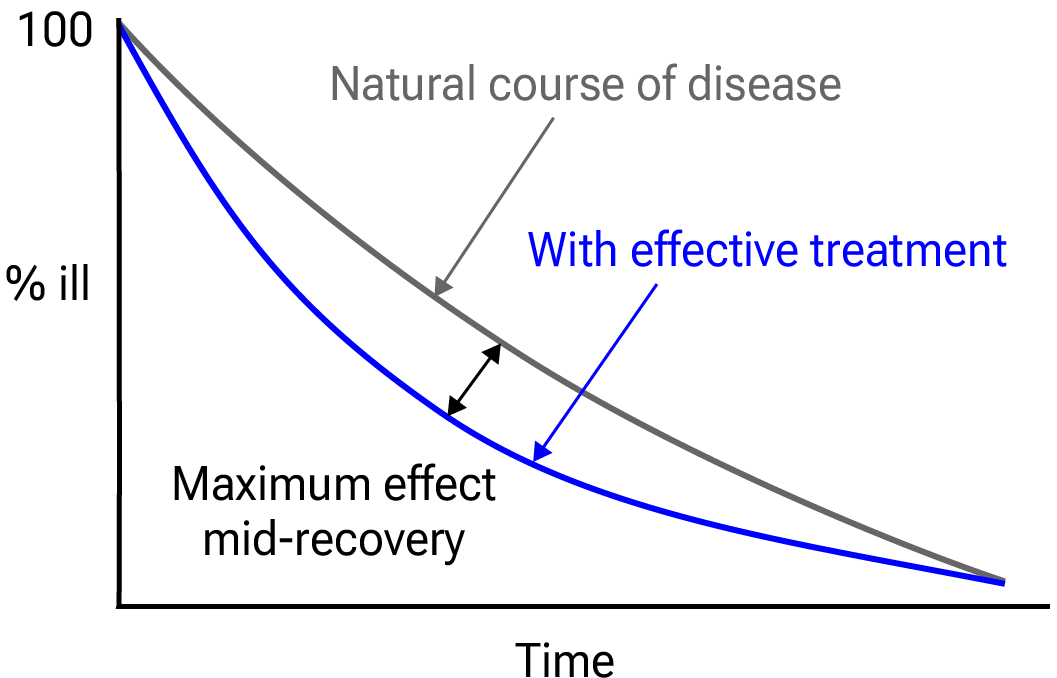
Fig. 32.
Mid-recovery results can more accurately reflect efficacy when almost all patients
recover. Mateja et al. confirm that intermediate viral load results more accurately
reflect hospitalization/death.
We extracted effect sizes and associated data from all studies. If studies report multiple
kinds of effects then the most serious outcome is used in pooled analysis, while
other outcomes are included in the outcome-specific analyses. For example, if effects for
mortality and cases are reported then they are both used in specific outcome analyses,
while mortality is used for pooled analysis.
If symptomatic results are reported at multiple times, we use the latest time, for example
if mortality results are provided at 14 days and 28 days, the results at 28 days have
preference. Mortality alone is preferred over combined outcomes.
Outcomes with zero events in both arms are not used, the next most serious outcome with
one or more events is used. For example, in low-risk populations with no mortality, a
reduction in mortality with treatment is not possible, however a reduction in
hospitalization, for example, is still valuable.
Clinical outcomes are considered more important than viral outcomes.
When basically all patients recover in both treatment and control groups, preference for
viral clearance and recovery is given to results mid-recovery where available. After most
or all patients have recovered there is little or no room for an effective treatment to do
better, however faster recovery is valuable.
An IPD meta-analysis confirms that intermediate viral load reduction is more closely
associated with hospitalization/death than later viral load reduction186.
If only individual symptom data is available, the most serious symptom has
priority, for example difficulty breathing or low SpO2 is more
important than cough.
Forest plots are computed using PythonMeta187 with the DerSimonian and
Laird random-effects model (the fixed effect assumption is not plausible in this case) and
inverse variance weighting.
Results are presented with 95% confidence intervals. Heterogeneity among studies was
assessed using the I2 statistic.
When results provide an odds ratio, we compute the relative risk when possible, or convert
to a relative risk according to Zhang (E) et al.
Reported confidence intervals and p-values are used when available, and adjusted
values are used when provided. If multiple types of adjustments are reported propensity
score matching and multivariable regression has preference over propensity score matching
or weighting, which has preference over multivariable regression. Adjusted results have
preference over unadjusted results for a more serious outcome when the adjustments
significantly alter results.
When needed, conversion between reported p-values and confidence intervals followed
Altman, Altman (B), and Fisher's exact test was used to calculate
p-values for event data. If continuity correction for zero values is required, we
use the reciprocal of the opposite arm with the sum of the correction factors equal to
1191.
Results are expressed with RR < 1.0 favoring treatment, and using the risk of a negative
outcome when applicable (for example, the risk of death rather than the risk of survival).
If studies only report relative continuous values such as relative times, the ratio of the
time for the treatment group versus the time for the control group is used. Calculations
are done in Python (3.14.6) with
scipy (1.18.0), pythonmeta (1.26), numpy (2.5.0), statsmodels (0.14.6), and plotly (6.8.0).
Mixed-effects meta-regression results are computed with R (4.4.0) using the metafor
(4.6-0) and rms (6.8-0) packages, and using the most serious sufficiently powered outcome.
For all statistical tests, a p-value less than 0.05 was considered statistically
significant.
Grobid 0.8.2 is used to parse PDF documents.
When evaluating potential effect modification across groups, we use an
interaction test as described by Altman (C) et al. We compared the log-transformed
relative risks using a z-test, deriving the standard error of the difference from
the 95% confidence intervals. A two-sided interaction p-value of < 0.05 was
considered a statistically significant difference in treatment effect between the
groups.
Cochrane RoB 2/ROBINS-I are often used to evaluate studies, and have the advantage of
providing standardized rules that can be applied with minimal understanding of the domain
and study. However, the rules do not account for many real-world issues, often
overemphasize or underemphasize others, and studies show low inter-rater
reliability199.
Certain domains are more applicable for these tools, however the time-sensitive nature of
a pandemic, with significant mortality for every day of delay in evidence assessment, and
the characteristics of COVID-19 make them inappropriate for this domain.
This can be demonstrated with examples where expert RoB 2/ROBINS-I ratings do not match
reality for COVID-19. Popp et al. use RoB 2 to classify Reis et al. as low
risk of bias, however this is the opposite of reality—the trial not only has very
high risk of bias, but has very high actual known bias, refusing to release data despite
pledging to, reporting multiple impossible numbers, having blinding and randomization
failure, and many other issues201.
Axfors et al. use RoB 2 to classify Horby et al. as low risk of bias, however
this is the opposite of reality—the very late treatment and excessive dosage used
produces results with no relevance to recommended usage.
HCQ shows poor results with
late treatment and excessive dosage, and the combination shows harmD.
Hempenius et al. use ROBINS-I to classify 33 studies for HCQ. The two rated as having
the lowest risk of bias197,198 are far from the most informative. Both
involve very late treatment, providing no information on recommended usage, and ROBINS-I
does a very poor job of accounting for the impact of confounding factorsE.
Our quality evaluation focuses on known issues and bias, and the potential
impact on outcomes, rather than just the risk of bias.
The estimated potential impact of each confounding factor, and the direction of the impact
is considered. For example, consider a study that shows significantly lower risk, the
value of the study varies significantly if confounding points to an underestimate or an
overestimate of efficacy. In one case, the real effect may be null, while the other case
provides stronger evidence of efficacy (which may be greater than the study shows).
Analysis focusing on the risk of bias, while simpler, may penalize studies for theoretical
or technical issues that have no or minimal impact on outcomes. Analysis also depends on
the outcome, for example certain issues are less relevant for objective outcomes such as
mortality.
Inaccurate penalization, and inaccurate high-quality evaluation in the face of known major
issues affecting outcomes, increases in significance during a pandemic when immediate
recognition of new evidence is critical, and when considering all global studies, as
required during a pandemic. Investigators in other countries may have different customs
for design, analysis, and reporting, and different English language skills, however they
may not be less diligent or have greater bias.
Investigators in lower-pharmaceutical-profit countries may have lower bias towards
profitable interventions.
We have classified studies as
early treatment if most patients are not already at a severe stage at the time of
treatment (for example based on oxygen status or lung involvement), and treatment started
within 5 days of the onset of symptoms. If studies contain a mix of early treatment and
late treatment patients, we consider the treatment time of patients contributing most to
the events (for example, consider a study where most patients are treated early but late
treatment patients are included, and all mortality events were observed with late
treatment patients).
We note that a shorter time may be preferable. Antivirals are typically only considered
effective when used within a shorter timeframe, for example 0-36 or 0-48 hours for
oseltamivir, with longer delays not being effective76,77.
This is a living analysis and is updated regularly.
We received no funding, this research is done in our spare time.
We have no affiliation with any pharmaceutical companies, supplement companies, governments, political parties, or advocacy organizations.
A summary of study results is below. Please submit
updates and corrections at https://c19early.org/azvmeta.html.
Effect extraction follows pre-specified rules as detailed above
and gives priority to more serious outcomes.
For pooled analyses, the first (most serious) outcome is used, which may
differ from the effect a paper focuses on.
Other outcomes are used in outcome specific analyses.
| Chen (C), 1/6/2023, retrospective, China, preprint, 7 authors, study period August 2022 - October 2022. | recovery time, 12.5% higher, relative time 1.12, p = 0.94, treatment 66, control 41. |
| risk of no viral clearance, 31.6% lower, HR 0.68, p = 0.04, treatment 166, control 41, adjusted per study, inverted to make HR<1 favor treatment, multivariable, Cox proportional hazards. | |
| Chu, 3/10/2026, prospective, China, peer-reviewed, mean age 51.6, 6 authors. | risk of long COVID, 24.1% higher, OR 1.24, p = 0.65, treatment 6 of 178 (3.4%) cases, 19 of 695 (2.7%) controls, case control OR. |
| Guo, 10/14/2025, retrospective, China, peer-reviewed, mean age 65.4, 12 authors, study period 1 December, 2022 - 31 May, 2023, trial ChiCTR2300072963. | risk of death, 56.0% lower, HR 0.44, p = 0.005, treatment 703, control 703, propensity score matching. |
| ICU/mechanical ventilation, 62.0% lower, HR 0.38, p < 0.001, treatment 703, control 703, propensity score matching. | |
| risk of no viral clearance, 34.2% lower, HR 0.66, p < 0.001, treatment 703, control 703, inverted to make HR<1 favor treatment, propensity score matching. | |
| Han, 7/14/2023, retrospective, China, preprint, 22 authors, study period 10 December, 2022 - 20 February, 2023. | risk of death, 37.0% lower, HR 0.63, p = 0.048, treatment 428, control 428, propensity score matching. |
| risk of no improvement, 2.9% lower, HR 0.97, p = 0.73, treatment 428, control 428, inverted to make HR<1 favor treatment, propensity score matching. | |
| Jin, 2/12/2024, retrospective, China, peer-reviewed, 14 authors. | recovery time, 0.7% higher, relative time 1.01, p = 0.90, treatment mean 12.21 (±2.84) n=33, control mean 12.12 (±2.82) n=33. |
| Wang (D), 2/9/2024, retrospective, China, peer-reviewed, 47 authors. | risk of death, 20.1% lower, HR 0.80, p = 0.44, treatment 128, control 55, adjusted per study, multivariable, Cox proportional hazards. |
| risk of progression, 3.0% lower, HR 0.97, p = 0.91, treatment 128, control 55, adjusted per study, ICU, mechanical ventilation, or death, multivariable, Cox proportional hazards. | |
| Wu (B), 3/27/2024, retrospective, China, peer-reviewed, 7 authors, average treatment delay 2.0 days. | risk of death, 81.1% lower, HR 0.19, p < 0.001, treatment 90, control 90, adjusted per study, propensity score matching, multivariable, Cox proportional hazards. |
| risk of death, 56.9% lower, HR 0.43, p = 0.002, treatment 106, control 245, adjusted per study, multivariable, Cox proportional hazards. | |
| Yang (B), 7/20/2023, retrospective, China, peer-reviewed, 11 authors, study period 19 December, 2022 - 5 January, 2023. | risk of death, 90.8% lower, RR 0.09, p = 0.09, treatment 0 of 317 (0.0%), control 6 of 487 (1.2%), NNT 81, relative risk is not 0 because of continuity correction due to zero events (with reciprocal of the contrasting arm). |
| risk of hospitalization, 74.8% lower, RR 0.25, p = 0.047, treatment 317, control 487, propensity score weighting. | |
| risk of no recovery, 16.0% lower, RR 0.84, p = 0.19, treatment 317, control 487, propensity score weighting. | |
| Zou, 3/15/2025, retrospective, China, peer-reviewed, 14 authors, study period January 2020 - June 2024, excluded in exclusion analyses: unadjusted results with no group details; significant confounding by time possible. | risk of no viral clearance, 8.8% lower, RR 0.91, p = 0.88, treatment 14 of 91 (15.4%), control 96 of 569 (16.9%), NNT 67, day 14. |
Effect extraction follows pre-specified rules as detailed above
and gives priority to more serious outcomes.
For pooled analyses, the first (most serious) outcome is used, which may
differ from the effect a paper focuses on.
Other outcomes are used in outcome specific analyses.
| Chen, 2/26/2026, retrospective, China, peer-reviewed, 15 authors, study period December 2022 - January 2023, trial NCT06349655 (history), excluded in exclusion analyses: potential significant differential censoring. | risk of death, 36.0% lower, HR 0.64, p < 0.001, treatment 2,434, control 2,434, propensity score matching. |
| Chen (D), 4/30/2023, retrospective, China, peer-reviewed, 9 authors. | risk of death, 6.5% lower, RR 0.94, p = 0.88, treatment 29 of 99 (29.3%), control 31 of 99 (31.3%), NNT 49, in-hospital mortality, propensity score matching. |
| risk of death, 63.0% lower, HR 0.37, p = 0.007, treatment 99, control 99, propensity score matching, day 14. | |
| de Souza, 10/19/2023, Double Blind Randomized Controlled Trial, placebo-controlled, Brazil, peer-reviewed, median age 48.0, 12 authors, study period April 2021 - May 2022, trial NCT04668235 (history). | risk of ICU admission, 27.5% lower, RR 0.73, p = 0.72, treatment 3 of 91 (3.3%), control 4 of 88 (4.5%), NNT 80. |
| risk of no hospital discharge, 42.0% lower, RR 0.58, p = 0.49, treatment 3 of 91 (3.3%), control 5 of 88 (5.7%), NNT 42. | |
| relative final score, 81.8% better, RR 0.18, p = 0.01, treatment mean 0.02 (±0.15) n=91, control mean 0.11 (±0.31) n=88. | |
| time to viral-, 13.0% lower, relative time 0.87, p = 0.03, treatment 91, control 88. | |
| Dian, 8/31/2023, retrospective, China, peer-reviewed, 5 authors, study period 5 December, 2022 - 31 January, 2023, this trial compares with another treatment - results may be better when compared to placebo. | risk of death, 63.6% lower, RR 0.36, p = 0.11, treatment 4 of 228 (1.8%), control 11 of 228 (4.8%), NNT 33, propensity score matching. |
| risk of mechanical ventilation, 66.7% lower, RR 0.33, p = 0.28, treatment 2 of 228 (0.9%), control 6 of 228 (2.6%), NNT 57, propensity score matching. | |
| risk of ICU admission, no change, RR 1.00, p = 1.00, treatment 1 of 228 (0.4%), control 1 of 228 (0.4%), propensity score matching. | |
| composite outcome, 48.4% lower, RR 0.52, p = 0.03, treatment 16 of 228 (7.0%), control 31 of 228 (13.6%), NNT 15, non-invasive respiratory support, endotracheal intubation, ICU admission, all-cause death, propensity score matching. | |
| respiratory support, 44.4% lower, RR 0.56, p = 0.07, treatment 15 of 228 (6.6%), control 27 of 228 (11.8%), NNT 19, propensity score matching. | |
| Han (B), 10/8/2025, retrospective, China, peer-reviewed, 7 authors, trial ChiCTR2000029853. | risk of death, 26.8% lower, RR 0.73, p = 0.02, treatment 90 of 901 (10.0%), control 123 of 901 (13.7%), NNT 27, propensity score matching. |
| risk of mechanical ventilation, 18.2% lower, RR 0.82, p = 0.06, treatment 139 of 901 (15.4%), control 170 of 901 (18.9%), NNT 29, propensity score matching. | |
| risk of ICU admission, 20.9% lower, RR 0.79, p = 0.03, treatment 140 of 901 (15.5%), control 177 of 901 (19.6%), NNT 24, propensity score matching. | |
| death/mechanical ventilation/ICU, 20.1% lower, RR 0.80, p = 0.01, treatment 182 of 901 (20.2%), control 230 of 910 (25.3%), NNT 20, propensity score matching. | |
| He, 3/3/2025, retrospective, China, peer-reviewed, median age 71.0, 8 authors, study period December 2022 - January 2023. | risk of death, 47.5% higher, RR 1.48, p < 0.001, treatment 165 of 865 (19.1%), control 214 of 1,655 (12.9%), all. |
| risk of death, 54.6% higher, RR 1.55, p < 0.001, treatment 158 of 832 (19.0%), control 198 of 1,612 (12.3%), w/o VTE. | |
| risk of death, 43.0% lower, RR 0.57, p = 0.21, treatment 7 of 33 (21.2%), control 16 of 43 (37.2%), NNT 6.3, VTE. | |
| Li (B), 3/4/2026, retrospective, China, peer-reviewed, 14 authors, study period 5 December, 2022 - 31 January, 2023, excluded in exclusion analyses: potential significant differential censoring. | risk of death, 35.0% lower, HR 0.65, p = 0.02, treatment 629, control 1,200, propensity score matching, Cox proportional hazards. |
| risk of progression, 30.0% lower, HR 0.70, p = 0.02, treatment 629, control 1,200, propensity score matching, Cox proportional hazards. | |
| Li (D), 3/4/2024, retrospective, China, peer-reviewed, 6 authors. | risk of ICU admission, 50.0% lower, RR 0.50, p = 0.68, treatment 2 of 42 (4.8%), control 4 of 42 (9.5%), NNT 21. |
| hospitalization time, 11.1% lower, relative time 0.89, p = 0.26, treatment 42, control 42. | |
| risk of no viral clearance, 49.8% lower, HR 0.50, p = 0.03, treatment 42, control 42, adjusted per study, inverted to make HR<1 favor treatment, multivariable, Cox proportional hazards. | |
| risk of no viral clearance, 31.8% lower, RR 0.68, p = 0.19, treatment 15 of 42 (35.7%), control 22 of 42 (52.4%), NNT 6.0. | |
| Li (E), 1/5/2024, retrospective, China, preprint, 7 authors, study period 1 November, 2022 - 31 May, 2023, trial NCT06006611 (history). | risk of death, 29.2% lower, HR 0.71, p = 0.03, treatment 1,103, control 1,103, propensity score matching, Cox proportional hazards. |
| Liu, 4/30/2024, retrospective, China, peer-reviewed, 3 authors, study period 1 December, 2022 - 19 January, 2023. | risk of progression, 45.1% lower, HR 0.55, p = 0.36, inverted to make HR<1 favor treatment, propensity score matching, Cox proportional hazards. |
| Liu (B), 10/21/2023, retrospective, China, peer-reviewed, 4 authors, study period 5 December, 2022 - 31 January, 2023. | risk of progression, 24.1% lower, RR 0.76, p = 0.44, treatment 12 of 126 (9.5%), control 56 of 446 (12.6%), NNT 33, intubation, non-invasive respiratory support, ICU admission, and all-cause death. |
| Lv (B), 6/24/2024, retrospective, China, peer-reviewed, 10 authors, average treatment delay 14.0 days. | risk of death, 42.3% higher, RR 1.42, p = 0.64, treatment 2 of 11 (18.2%), control 40 of 313 (12.8%). |
| Peng, 1/31/2024, retrospective, China, peer-reviewed, 8 authors, study period 12 December, 2022 - 15 January, 2023, excluded in exclusion analyses: unadjusted results with no group details. | risk of death, 13.0% higher, OR 1.13, p = 0.85, treatment 42, control 124, RR approximated with OR. |
| Ren, 11/17/2024, retrospective, China, peer-reviewed, 22 authors, study period 5 December, 2022 - 31 January, 2023, trial NCT06349655 (history). | risk of death, 32.0% lower, HR 0.68, p < 0.001, treatment 5,735, control 5,735, adjusted per study, propensity score matching, multivariable, Cox proportional hazards, RR approximated with OR. |
| risk of progression, 12.0% lower, HR 0.88, p = 0.01, treatment 5,735, control 5,735, adjusted per study, progression to severe disease or death, propensity score matching, multivariable, Cox proportional hazards, RR approximated with OR. | |
| Ren (B), 8/13/2020, Randomized Controlled Trial, China, peer-reviewed, median age 52.0, 22 authors, study period 18 February, 2020 - 29 February, 2020, trial ChiCTR2000029853. | recovery time, 37.5% lower, relative time 0.62, p = 0.04, treatment 10, control 10, pneumonia resolution. |
| time to viral-, 53.6% lower, relative time 0.46, p = 0.008, treatment mean 2.6 (±0.97) n=10, control mean 5.6 (±3.06) n=10. | |
| Shao, 7/23/2023, retrospective, China, peer-reviewed, 9 authors, study period 8 December, 2022 - 9 February, 2023. | risk of death, 56.0% lower, HR 0.44, p = 0.007, treatment 177, control 509, adjusted per study, day 60. |
| Shen, 1/23/2023, retrospective, China, preprint, 12 authors, average treatment delay 8.2 days. | risk of death, 74.0% lower, HR 0.26, p = 0.04, treatment 3 of 226 (1.3%), control 10 of 226 (4.4%), NNT 32, propensity score matching, Cox proportional hazards. |
| risk of mechanical ventilation, 90.9% lower, RR 0.09, p = 0.06, treatment 0 of 226 (0.0%), control 5 of 226 (2.2%), NNT 45, relative risk is not 0 because of continuity correction due to zero events (with reciprocal of the contrasting arm), propensity score matching. | |
| risk of ICU admission, 75.0% lower, RR 0.25, p = 0.37, treatment 1 of 226 (0.4%), control 4 of 226 (1.8%), NNT 75, propensity score matching. | |
| risk of progression, 57.0% lower, HR 0.43, p = 0.048, treatment 8 of 226 (3.5%), control 17 of 226 (7.5%), NNT 25, all-cause death, intensive care unit admission, initiation of invasive mechanical ventilation, and need for high-flow oxygen therapy, propensity score matching, Cox proportional hazards. | |
| Sun, 2/5/2025, retrospective, China, peer-reviewed, 18 authors, study period 5 December, 2022 - 31 January, 2023, trial NCT06349655 (history). | risk of death, 27.0% lower, HR 0.73, p = 0.02, treatment 1,462, control 1,462, adjusted per study, propensity score matching, multivariable, Cox proportional hazards. |
| risk of progression, 15.0% higher, HR 1.15, p = 0.16, treatment 1,462, control 1,462, adjusted per study, progression to severe or death, propensity score matching, multivariable, Cox proportional hazards. | |
| Sun (B), 5/5/2023, retrospective, China, peer-reviewed, 7 authors, study period 5 December, 2022 - 31 January, 2023. | risk of death, 54.1% lower, HR 0.46, p = 0.16, treatment 5 of 245 (2.0%), control 9 of 245 (3.7%), NNT 61, odds ratio converted to relative risk, Cox proportional hazards. |
| risk of mechanical ventilation, no change, RR 1.00, p = 1.00, treatment 2 of 245 (0.8%), control 2 of 245 (0.8%). | |
| risk of ICU admission, 100% higher, RR 2.00, p = 1.00, treatment 2 of 245 (0.8%), control 1 of 245 (0.4%). | |
| risk of oxygen therapy, 38.5% lower, RR 0.62, p = 0.15, treatment 16 of 245 (6.5%), control 26 of 245 (10.6%), NNT 25. | |
| risk of progression, 47.6% lower, HR 0.52, p = 0.02, treatment 17 of 245 (6.9%), control 31 of 245 (12.7%), NNT 18, odds ratio converted to relative risk, non-invasive respiratory support, endotracheal intubation, ICU admission, and all-cause death, Cox proportional hazards, primary outcome. | |
| Wang (E), 7/1/2025, retrospective, China, peer-reviewed, 27 authors, study period 1 November, 2022 - 27 February, 2023. | risk of death, 45.0% lower, OR 0.55, p = 0.05, treatment 302, control 302, all patients, RR approximated with OR. |
| risk of death, 69.0% lower, OR 0.31, p = 0.03, treatment 126, control 302, ≤ 8 days, RR approximated with OR. | |
| risk of death, 32.0% lower, OR 0.68, p = 0.25, treatment 176, control 302, > 8 days, RR approximated with OR. | |
| Wei, 10/13/2023, retrospective, China, peer-reviewed, 8 authors, study period 1 December, 2022 - 31 January, 2023, this trial compares with another treatment - results may be better when compared to placebo. | risk of death, 0.2% higher, RR 1.00, p = 1.00, treatment 63 of 461 (13.7%), control 36 of 264 (13.6%). |
| risk of mechanical ventilation, 27.7% lower, RR 0.72, p = 0.04, treatment 77 of 461 (16.7%), control 61 of 264 (23.1%), NNT 16. | |
| risk of ICU admission, 55.0% lower, RR 0.45, p = 0.05, treatment 11 of 461 (2.4%), control 14 of 264 (5.3%), NNT 34. | |
| risk of progression, 22.1% lower, RR 0.78, p = 0.07, treatment 98 of 461 (21.3%), control 72 of 264 (27.3%), NNT 17, ICU admission, invasive mechanical ventilation, and in-hospital death, primary outcome. | |
| Xu (B), 11/7/2024, retrospective, China, peer-reviewed, 6 authors, study period 1 December, 2022 - 31 January, 2023. | risk of death, 75.0% lower, HR 0.25, p = 0.02, treatment 132, control 132, adjusted per study, propensity score matching, multivariable. |
| risk of progression, 63.0% lower, HR 0.37, p = 0.02, treatment 132, control 132, adjusted per study, respiratory support, ICU admission, or death, propensity score matching, multivariable. | |
| Yu, 4/9/2025, retrospective, China, peer-reviewed, mean age 64.4, 14 authors, study period 5 December, 2022 - 31 January, 2023, trial NCT06349655 (history). | risk of death, 38.0% lower, HR 0.62, p < 0.001, treatment 831, control 831, adjusted per study, propensity score matching, multivariable, Cox proportional hazards. |
| risk of progression, 21.0% lower, HR 0.79, p = 0.03, treatment 831, control 831, adjusted per study, propensity score matching, multivariable, Cox proportional hazards. | |
| Yuan, 12/18/2024, retrospective, China, peer-reviewed, 10 authors, study period 10 August, 2022 - 9 October, 2022, excluded in exclusion analyses: substantial unadjusted confounding by indication likely. | time to viral-, 9.1% lower, relative time 0.91, p = 0.03, treatment 121, control 123. |
| Zhang, 6/18/2025, retrospective, China, peer-reviewed, mean age 53.5, 6 authors, study period 1 November, 2022 - 31 December, 2022. | hospitalization time, 20.0% lower, relative time 0.80, p = 0.001, treatment median 8.0 IQR 4.0 n=48, control median 10.0 IQR 4.0 n=48, propensity score matching. |
| time to viral-, no change, relative time 1.00, p = 1.00, treatment median 4.0 IQR 2.75 n=48, control median 4.0 IQR 5.0 n=48, propensity score matching. | |
| Zhang (B), 11/22/2024, prospective, China, peer-reviewed, 6 authors, study period 15 December, 2022 - 30 April, 2023. | risk of progression, 42.6% lower, RR 0.57, p = 0.03, treatment 28 of 165 (17.0%), control 13 of 44 (29.5%), NNT 8.0, death, ICU, or mechanical ventilation, day 28. |
| time to viral-, 14.4% lower, relative time 0.86, p = 0.02, treatment 165, control 44. | |
| Zhang (C), 10/7/2024, retrospective, China, peer-reviewed, mean age 68.8, 7 authors, study period 10 December, 2022 - 10 January, 2023. | risk of death, 32.4% higher, RR 1.32, p = 0.20, treatment 49 of 303 (16.2%), control 37 of 303 (12.2%). |
| risk of mechanical ventilation, 61.5% higher, RR 1.62, p = 0.22, treatment 21 of 303 (6.9%), control 13 of 303 (4.3%). | |
| risk of ICU admission, 7.1% higher, RR 1.07, p = 0.89, treatment 30 of 303 (9.9%), control 28 of 303 (9.2%). | |
| hospitalization time, 9.1% lower, relative time 0.91, p = 0.046, treatment mean 8.34 (±4.79) n=303, control mean 9.17 (±6.25) n=303, all patients. | |
| hospitalization time, 19.3% lower, relative time 0.81, p = 0.001, treatment mean 8.07 (±4.35) n=165, control mean 10.0 (±6.29) n=181, non-severe patients. | |
| Zhong, 12/26/2024, retrospective, China, peer-reviewed, 7 authors, study period 1 December, 2022 - 31 March, 2023. | risk of death, 35.0% lower, HR 0.65, p = 0.048, treatment 1,490, control 1,372, propensity score weighting, day 28. |
| risk of death, 43.0% lower, HR 0.57, p = 0.003, treatment 920, control 920, propensity score matching, day 28. | |
| risk of death, 52.0% lower, HR 0.48, p = 0.048, treatment 1,490, control 1,372, propensity score weighting, day 14. | |
| risk of death, 56.0% lower, HR 0.44, p = 0.003, treatment 920, control 920, propensity score matching, day 14. | |
| risk of death, 87.0% lower, HR 0.13, p = 0.048, treatment 1,490, control 1,372, propensity score weighting, day 7. | |
| risk of death, 88.0% lower, HR 0.12, p = 0.003, treatment 920, control 920, propensity score matching, day 7. | |
| Zhong (B), 4/1/2024, retrospective, China, preprint, 7 authors, study period 1 December, 2022 - 31 March, 2023. | risk of death, 35.0% lower, HR 0.65, p = 0.048, treatment 1,490, control 1,373, propensity score weighting, day 28. |
| risk of death, 52.0% lower, HR 0.48, p = 0.001, treatment 1,490, control 1,373, propensity score weighting, day 14. | |
| risk of death, 87.0% lower, HR 0.13, p = 0.001, treatment 1,490, control 1,373, propensity score weighting, day 7. | |
| Zhou (B), 2/18/2025, retrospective, China, peer-reviewed, 15 authors, study period 5 December, 2022 - 31 January, 2023. | risk of death, 26.0% lower, HR 0.74, p = 0.01, treatment 1,417, control 1,417, adjusted per study, propensity score matching, multivariable, Cox proportional hazards. |
| risk of progression, 9.0% lower, HR 0.91, p = 0.35, treatment 1,417, control 1,417, adjusted per study, propensity score matching, multivariable, Cox proportional hazards. | |
| Zhou, 10/12/2023, retrospective, China, peer-reviewed, median age 81.0, 6 authors, study period 1 December, 2022 - 31 January, 2023, excluded in exclusion analyses: substantial unadjusted confounding by indication likely; unadjusted results with no group details. | risk of death, 21.8% lower, RR 0.78, p = 0.15, treatment 37 of 131 (28.2%), control 69 of 191 (36.1%), NNT 13. |
| Zhu, 12/12/2024, retrospective, China, peer-reviewed, 55 authors, study period 1 December, 2022 - 28 February, 2023, trial ChiCTR2300072750. | risk of death, 22.0% lower, RR 0.78, p = 0.001, treatment 265 of 1,999 (13.3%), control 341 of 1,999 (17.1%), NNT 26, propensity score matching. |
| risk of no hospital discharge, 13.2% lower, RR 0.87, p = 0.045, treatment 323 of 1,999 (16.2%), control 372 of 1,999 (18.6%), NNT 41, propensity score matching. | |
| hospitalization time, 1.4% lower, relative time 0.99, p = 0.43, treatment mean 13.8 (±6.2) n=1,676, control mean 14.0 (±8.2) n=1,623. | |
| time to viral-, 10.4% lower, relative time 0.90, p < 0.001, treatment mean 12.9 (±6.6) n=1,676, control mean 14.4 (±9.5) n=1,623. | |
| Zong, 7/13/2023, retrospective, China, peer-reviewed, 6 authors, study period 8 December, 2022 - 20 January, 2023. | risk of death, 62.5% lower, OR 0.38, p < 0.001, treatment 195, control 390, propensity score matching, RR approximated with OR. |
Viral infection and replication involves attachment, entry, uncoating and release, genome replication and transcription, translation and protein processing, assembly and budding, and release. Each step can be disrupted by therapeutics.
Monoclonal antibodies were
previously included. Other treatments such as dexamethasone, tocilizumab, and baricitinib
were recommended for late stage hospitalized patients.
Smoking was
known to cause lung cancer since at least 1939, but this was not widely recognized in the
US until 1964, 25 years later. Surgeon general Leroy Burney tried publicizing the danger
starting in 1957, with limited success. Surgeon general Luther Terry, appointed in 1961,
prompted by President Kennedy in 1962 amid pressure from health advocates, finally got
recognition in 1964. The 1964 report reviewed 7,000+ studies, but these could (and should)
have been reviewed and acted upon in real-time as they were published.
Historians attribute the 25 year delay to an industry campaign to manufacture doubt and
controversy, through tactics like funding biased and fraudulent research from
"independent" organizations, attacking scientists, and political lobbying.
The success of the industry campaign is only possible because officials did not analyze
the research in detail. Fraudulent industry research supported prior failures, but would
have been called out as fraudulent by officials that analyzed and understood the research
in real-time.
When administered late in infection, HCQ may enhance viral egress by further increasing
lysosomal pH beyond the effect of ORF3a's water channel activity, thereby promoting
lysosomal exocytosis, inactivating degradative enzymes, and facilitating the release of
SARS-CoV-2 particles into the extracellular environment193,194.
Research also suggests potential cardioprotective effects at lower doses, but
cardiotoxicity with excessive dosage195. Bobrowski et al. also
indicate negative effects if HCQ and remdesivir are combined.
Peters (B) et al. is subject to confounding by calendar-time (SOC evolved rapidly early in
the pandemic, the linear covariate does not reflect non-linear SOC changes and hospital
specific effects), hospital type (non-treatment hospitals were tertiary university
centers), confounding by indication (4/7 hospitals initiated treatment on deterioration),
immortal-time bias for as-treated (exposure assigned after baseline), significant
differences for other experimental treatments, potential overadjustment from collider bias
(steroid use and indication bias), limited baseline severity information, differences in
hospice referral propensity across hospitals, unadjusted difference in time from onset to
admission, difference in PCR positivity, and other factors.
Mahévas et al. is subject to confounding by hospital (treatment highly dependent on
the hospital, different SOC/ICU transfer practices, not included in PS), immortal time
(only partly addressed in sensitivity analysis), co-treatment differences, calendar-time
(SOC evolved rapidly early in the pandemic), binary coding for age (age ≥65 despite steep
age-risk gradient), residual imbalance (variables dropped from PS), a composite outcome
dependent on hospital triage/capacity, and other factors.
Xiong et al., Real-world data of Azvudine-induced hepatotoxicity among hospitalized COVID-19 patients in China: a retrospective case-control study, Frontiers in Pharmacology, doi:10.3389/fphar.2025.1558054.
Wang et al., Development and validation of a nomogram to assess the occurrence of liver dysfunction in patients with COVID-19 pneumonia in the ICU, BMC Infectious Diseases, doi:10.1186/s12879-025-10684-1.
Zheng et al., Small-molecule antivirals treatment for COVID-19: A systematic review and network meta-analysis, International Journal of Antimicrobial Agents, doi:10.1016/j.ijantimicag.2024.107096.
Wang (B) et al., Effectiveness of azvudine in reducing mortality of COVID-19 patients: a systematic review and meta-analysis, Virology Journal, doi:10.1186/s12985-024-02316-y.
Amani et al., Effectiveness and safety of azvudine in COVID-19: A systematic review and meta-analysis, PLOS ONE, doi:10.1371/journal.pone.0298772.
Dong et al., Efficacy and Safety of Azvudine in Patients With COVID‐19 in China: A Meta‐Analysis of Observational Studies, The Clinical Respiratory Journal, doi:10.1111/crj.13798.
Kapar et al., Real‐World Evaluation Study of Azvudine for the Treatment of Patients With COVID‐19: A Systematic Review and Meta‐Analysis, Canadian Journal of Infectious Diseases and Medical Microbiology, doi:10.1155/cjid/3645253.
Ryu et al., Fibrin drives thromboinflammation and neuropathology in COVID-19, Nature, doi:10.1038/s41586-024-07873-4.
Rong et al., Persistence of spike protein at the skull-meninges-brain axis may contribute to the neurological sequelae of COVID-19, Cell Host & Microbe, doi:10.1016/j.chom.2024.11.007.
Yang et al., SARS-CoV-2 infection causes dopaminergic neuron senescence, Cell Stem Cell, doi:10.1016/j.stem.2023.12.012.
Scardua-Silva et al., Microstructural brain abnormalities, fatigue, and cognitive dysfunction after mild COVID-19, Scientific Reports, doi:10.1038/s41598-024-52005-7.
Hampshire et al., Cognition and Memory after Covid-19 in a Large Community Sample, New England Journal of Medicine, doi:10.1056/NEJMoa2311330.
Duloquin et al., Is COVID-19 Infection a Multiorganic Disease? Focus on Extrapulmonary Involvement of SARS-CoV-2, Journal of Clinical Medicine, doi:10.3390/jcm13051397.
Sodagar et al., Pathological Features and Neuroinflammatory Mechanisms of SARS-CoV-2 in the Brain and Potential Therapeutic Approaches, Biomolecules, doi:10.3390/biom12070971.
Sagar et al., COVID-19-associated cerebral microbleeds in the general population, Brain Communications, doi:10.1093/braincomms/fcae127.
Verma et al., Persistent Neurological Deficits in Mouse PASC Reveal Antiviral Drug Limitations, bioRxiv, doi:10.1101/2024.06.02.596989.
Panagea et al., Neurocognitive Impairment in Long COVID: A Systematic Review, Archives of Clinical Neuropsychology, doi:10.1093/arclin/acae042.
Ariza et al., COVID-19: Unveiling the Neuropsychiatric Maze—From Acute to Long-Term Manifestations, Biomedicines, doi:10.3390/biomedicines12061147.
Vashisht et al., Neurological Complications of COVID-19: Unraveling the Pathophysiological Underpinnings and Therapeutic Implications, Viruses, doi:10.3390/v16081183.
Ahmad et al., Neurological Complications and Outcomes in Critically Ill Patients With COVID-19: Results From International Neurological Study Group From the COVID-19 Critical Care Consortium, The Neurohospitalist, doi:10.1177/19418744241292487.
Wang (C) et al., SARS-CoV-2 membrane protein induces neurodegeneration via affecting Golgi-mitochondria interaction, Translational Neurodegeneration, doi:10.1186/s40035-024-00458-1.
Freitas et al., Central nervous system and systemic inflammatory networks associated with acute neurological outcomes in COVID-19, Scientific Reports, doi:10.1038/s41598-025-08632-9.
Lu et al., Risk of neuropsychiatric and related conditions associated with SARS-CoV-2 infection: a difference-in-differences analysis, Nature Communications, doi:10.1038/s41467-025-61961-1.
Jachman-Kapułka et al., Cross-Section of Neurological Manifestations Among SARS-CoV-2 Omicron Subvariants—Single-Center Study, Brain Sciences, doi:10.3390/brainsci14111161.
Beckman et al., SARS-CoV-2 infects neurons and induces neuroinflammation in a non-human primate model of COVID-19, Cell Reports, doi:10.1016/j.celrep.2022.111573.
Eberhardt et al., SARS-CoV-2 infection triggers pro-atherogenic inflammatory responses in human coronary vessels, Nature Cardiovascular Research, doi:10.1038/s44161-023-00336-5.
Van Tin et al., Spike Protein of SARS-CoV-2 Activates Cardiac Fibrogenesis through NLRP3 Inflammasomes and NF-κB Signaling, Cells, doi:10.3390/cells13161331.
Borka Balas et al., COVID-19 and Cardiac Implications—Still a Mystery in Clinical Practice, Reviews in Cardiovascular Medicine, doi:10.31083/j.rcm2405125.
AlTaweel et al., An In-Depth Insight into Clinical, Cellular and Molecular Factors in COVID19-Associated Cardiovascular Ailments for Identifying Novel Disease Biomarkers, Drug Targets and Clinical Management Strategies, Archives of Microbiology & Immunology, doi:10.26502/ami.936500177.
Saha et al., COVID-19 beyond the lungs: Unraveling its vascular impact and cardiovascular complications—mechanisms and therapeutic implications, Science Progress, doi:10.1177/00368504251322069.
Yin et al., COVID-19: a vascular nightmare unfolding, Frontiers in Immunology, doi:10.3389/fimmu.2025.1593885.
Bruno et al., Accelerated vascular ageing after COVID-19 infection: the CARTESIAN study, European Heart Journal, doi:10.1093/eurheartj/ehaf430.
Abiri et al., The silent legacy of COVID-19: exploring genomic instability in long-term COVID-19 survivors, BMC Infectious Diseases, doi:10.1186/s12879-025-11419-y.
Gioia et al., SARS-CoV-2 infection induces DNA damage, through CHK1 degradation and impaired 53BP1 recruitment, and cellular senescence, Nature Cell Biology, doi:10.1038/s41556-023-01096-x.
Doğan et al., Clinical Investigation of Leukocyte DNA Damage in COVID-19 Patients, Current Issues in Molecular Biology, doi:10.3390/cimb45020062.
Rueda-Torres et al., Longitudinal Assessment of DNA Damage in PBMCs From Hospitalized COVID‐19 Patients via Alkaline Comet Assay, Environmental and Molecular Mutagenesis, doi:10.1002/em.70055.
Trender et al., Changes in memory and cognition during the SARS-CoV-2 human challenge study, eClinicalMedicine, doi:10.1016/j.eclinm.2024.102842.
Dugied et al., Multimodal SARS-CoV-2 interactome sketches the virus-host spatial organization, Communications Biology, doi:10.1038/s42003-025-07933-z.
Malone et al., Structures and functions of coronavirus replication–transcription complexes and their relevance for SARS-CoV-2 drug design, Nature Reviews Molecular Cell Biology, doi:10.1038/s41580-021-00432-z.
Murigneux et al., Proteomic analysis of SARS-CoV-2 particles unveils a key role of G3BP proteins in viral assembly, Nature Communications, doi:10.1038/s41467-024-44958-0.
Lv et al., Host proviral and antiviral factors for SARS-CoV-2, Virus Genes, doi:10.1007/s11262-021-01869-2.
Lui et al., Nsp1 facilitates SARS-CoV-2 replication through calcineurin-NFAT signaling, Virology, doi:10.1128/mbio.00392-24.
Niarakis et al., Drug-target identification in COVID-19 disease mechanisms using computational systems biology approaches, Frontiers in Immunology, doi:10.3389/fimmu.2023.1282859.
Katiyar et al., SARS-CoV-2 Assembly: Gaining Infectivity and Beyond, Viruses, doi:10.3390/v16111648.
Wu et al., Decoding the genome of SARS-CoV-2: a pathway to drug development through translation inhibition, RNA Biology, doi:10.1080/15476286.2024.2433830.
web.archive.org, web.archive.org/web/20211117052139/https://astralcodexten.substack.com/p/ivermectin-much-more-than-you-wanted.
Hayward et al., Ivermectin for COVID-19 in adults in the community (PRINCIPLE): an open, randomised, controlled, adaptive platform trial of short- and longer-term outcomes, Journal of Infection, doi:10.1016/j.jinf.2024.106130.
Li et al., Azvudine alleviates SARS-CoV-2-induced inflammation by targeting myeloperoxidase in NETosis, Chinese Chemical Letters, doi:10.1016/j.cclet.2024.110238.
Chen et al., Evaluating the effectiveness and safety of Azvudine for hospitalised patients with COVID-19 and hypertension: a multicenter retrospective cohort study, Scientific Reports, doi:10.1038/s41598-025-34514-1.
Zeraatkar et al., Consistency of covid-19 trial preprints with published reports and impact for decision making: retrospective review, BMJ Medicine, doi:10.1136/bmjmed-2022-0003091.
Davidson et al., No evidence of important difference in summary treatment effects between COVID-19 preprints and peer-reviewed publications: a meta-epidemiological study, Journal of Clinical Epidemiology, doi:10.1016/j.jclinepi.2023.08.011.
Jadad et al., Randomized Controlled Trials: Questions, Answers, and Musings, Second Edition, doi:10.1002/9780470691922.
Gøtzsche, P., Bias in double-blind trials, Doctoral Thesis, University of Copenhagen, www.scientificfreedom.dk/2023/05/16/bias-in-double-blind-trials-doctoral-thesis/.
Als-Nielsen et al., Association of Funding and Conclusions in Randomized Drug Trials, JAMA, doi:10.1001/jama.290.7.921.
Bekelman et al., Scope and Impact of Financial Conflicts of Interest in Biomedical Research, JAMA, doi:10.1001/jama.289.4.454.
Lundh et al., Industry sponsorship and research outcome, Cochrane Database of Systematic Reviews, doi:10.1002/14651858.MR000033.pub3.
Concato et al., Randomized, Controlled Trials, Observational Studies, and the Hierarchy of Research Designs, New England Journal of Medicine, doi:10.1056/NEJM200006223422507.
Anglemyer et al., Healthcare outcomes assessed with observational study designs compared with those assessed in randomized trials, Cochrane Database of Systematic Reviews, doi:10.1002/14651858.MR000034.pub2.
Lee et al., Analysis of Overall Level of Evidence Behind Infectious Diseases Society of America Practice Guidelines, Arch Intern Med., 2011, 171:1, 18-22, doi:10.1001/archinternmed.2010.482.
Deaton et al., Understanding and misunderstanding randomized controlled trials, Social Science & Medicine, 210, doi:10.1016/j.socscimed.2017.12.005.
Nichol et al., Challenging issues in randomised controlled trials, Injury, 2010, doi: 10.1016/j.injury.2010.03.033, www.injuryjournal.com/article/S0020-1383(10)00233-0/fulltext.
Li (B) et al., Azvudine for the treatment of cancer patients with COVID-19: a multicenter, real-world, retrospective, cohort study, BMC Cancer, doi:10.1186/s12885-026-15800-1.
Peng et al., Impact of Anti-angiogenic Drugs on Severity of COVID-19 in Patients with Non-Small Cell Lung Cancer, Technology in Cancer Research & Treatment, doi:10.1177/15330338241248573.
Yuan et al., Characteristics of patients with non-severe infections of different SARS-CoV-2 omicron subvariants in China, Frontiers in Medicine, doi:10.3389/fmed.2024.1511227.
Zhou et al., Secondary pulmonary infection and co-infection in elderly COVID-19 patients during the pandemics in a tertiary general hospital in Beijing, China, Frontiers in Microbiology, doi:10.3389/fmicb.2023.1280026.
Zou et al., Risk prediction and early intervention strategies for persistent SARS-CoV-2 infection in patients with non-Hodgkin lymphoma: a retrospective cohort study, BMC Pulmonary Medicine, doi:10.1186/s12890-025-03524-0.
help.altmetric.com, help.altmetric.com/support/solutions/articles/6000235983-attention-sources-tracked-by-altmetric.
Treanor et al., Efficacy and Safety of the Oral Neuraminidase Inhibitor Oseltamivir in Treating Acute Influenza: A Randomized Controlled Trial, JAMA, 2000, 283:8, 1016-1024, doi:10.1001/jama.283.8.1016.
McLean et al., Impact of Late Oseltamivir Treatment on Influenza Symptoms in the Outpatient Setting: Results of a Randomized Trial, Open Forum Infect. Dis. September 2015, 2:3, doi:10.1093/ofid/ofv100.
Ikematsu et al., Baloxavir Marboxil for Prophylaxis against Influenza in Household Contacts, New England Journal of Medicine, doi:10.1056/NEJMoa1915341.
Hayden et al., Baloxavir Marboxil for Uncomplicated Influenza in Adults and Adolescents, New England Journal of Medicine, doi:10.1056/NEJMoa1716197.
Kumar et al., Combining baloxavir marboxil with standard-of-care neuraminidase inhibitor in patients hospitalised with severe influenza (FLAGSTONE): a randomised, parallel-group, double-blind, placebo-controlled, superiority trial, The Lancet Infectious Diseases, doi:10.1016/S1473-3099(21)00469-2.
López-Medina et al., Effect of Ivermectin on Time to Resolution of Symptoms Among Adults With Mild COVID-19: A Randomized Clinical Trial, JAMA, doi:10.1001/jama.2021.3071.
Korves et al., SARS-CoV-2 Genetic Variants and Patient Factors Associated with Hospitalization Risk, medRxiv, doi:10.1101/2024.03.08.24303818.
Faria et al., Genomics and epidemiology of the P.1 SARS-CoV-2 lineage in Manaus, Brazil, Science, doi:10.1126/science.abh2644.
Nonaka et al., SARS-CoV-2 variant of concern P.1 (Gamma) infection in young and middle-aged patients admitted to the intensive care units of a single hospital in Salvador, Northeast Brazil, February 2021, International Journal of Infectious Diseases, doi:10.1016/j.ijid.2021.08.003.
Karita et al., Trajectory of viral load in a prospective population-based cohort with incident SARS-CoV-2 G614 infection, medRxiv, doi:10.1101/2021.08.27.21262754.
Zavascki et al., Advanced ventilatory support and mortality in hospitalized patients with COVID-19 caused by Gamma (P.1) variant of concern compared to other lineages: cohort study at a reference center in Brazil, Research Square, doi:10.21203/rs.3.rs-910467/v1.
Willett et al., The hyper-transmissible SARS-CoV-2 Omicron variant exhibits significant antigenic change, vaccine escape and a switch in cell entry mechanism, medRxiv, doi:10.1101/2022.01.03.21268111.
Peacock et al., The SARS-CoV-2 variant, Omicron, shows rapid replication in human primary nasal epithelial cultures and efficiently uses the endosomal route of entry, bioRxiv, doi:10.1101/2021.12.31.474653.
Williams, T., Not All Ivermectin Is Created Equal: Comparing The Quality of 11 Different Ivermectin Sources, Do Your Own Research, doyourownresearch.substack.com/p/not-all-ivermectin-is-created-equal.
Xu et al., A study of impurities in the repurposed COVID-19 drug hydroxychloroquine sulfate by UHPLC-Q/TOF-MS and LC-SPE-NMR, Rapid Communications in Mass Spectrometry, doi:10.1002/rcm.9358.
Jitobaom et al., Favipiravir and Ivermectin Showed in Vitro Synergistic Antiviral Activity against SARS-CoV-2, Research Square, doi:10.21203/rs.3.rs-941811/v1.
Jitobaom (B) et al., Synergistic anti-SARS-CoV-2 activity of repurposed anti-parasitic drug combinations, BMC Pharmacology and Toxicology, doi:10.1186/s40360-022-00580-8.
Jeffreys et al., Remdesivir-ivermectin combination displays synergistic interaction with improved in vitro activity against SARS-CoV-2, International Journal of Antimicrobial Agents, doi:10.1016/j.ijantimicag.2022.106542.
Ostrov et al., Highly Specific Sigma Receptor Ligands Exhibit Anti-Viral Properties in SARS-CoV-2 Infected Cells, Pathogens, doi:10.3390/pathogens10111514.
Alsaidi et al., Griffithsin and Carrageenan Combination Results in Antiviral Synergy against SARS-CoV-1 and 2 in a Pseudoviral Model, Marine Drugs, doi:10.3390/md19080418.
Andreani et al., In vitro testing of combined hydroxychloroquine and azithromycin on SARS-CoV-2 shows synergistic effect, Microbial Pathogenesis, doi:10.1016/j.micpath.2020.104228.
De Forni et al., Synergistic drug combinations designed to fully suppress SARS-CoV-2 in the lung of COVID-19 patients, PLoS ONE, doi:10.1371/journal.pone.0276751.
Wan et al., Synergistic inhibition effects of andrographolide and baicalin on coronavirus mechanisms by downregulation of ACE2 protein level, Scientific Reports, doi:10.1038/s41598-024-54722-5.
Said et al., The effect of Nigella sativa and vitamin D3 supplementation on the clinical outcome in COVID-19 patients: A randomized controlled clinical trial, Frontiers in Pharmacology, doi:10.3389/fphar.2022.1011522.
Fiaschi et al., In Vitro Combinatorial Activity of Direct Acting Antivirals and Monoclonal Antibodies against the Ancestral B.1 and BQ.1.1 SARS-CoV-2 Viral Variants, Viruses, doi:10.3390/v16020168.
Xing et al., Published anti-SARS-CoV-2 in vitro hits share common mechanisms of action that synergize with antivirals, Briefings in Bioinformatics, doi:10.1093/bib/bbab249.
Chen (B) et al., Synergistic Inhibition of SARS-CoV-2 Replication Using Disulfiram/Ebselen and Remdesivir, ACS Pharmacology & Translational Science, doi:10.1021/acsptsci.1c00022.
Hempel et al., Synergistic inhibition of SARS-CoV-2 cell entry by otamixaban and covalent protease inhibitors: pre-clinical assessment of pharmacological and molecular properties, Chemical Science, doi:10.1039/D1SC01494C.
Schultz et al., Pyrimidine inhibitors synergize with nucleoside analogues to block SARS-CoV-2, Nature, doi:10.1038/s41586-022-04482-x.
Ohashi et al., Potential anti-COVID-19 agents, cepharanthine and nelfinavir, and their usage for combination treatment, iScience, doi:10.1016/j.isci.2021.102367.
Al Krad et al., The protease inhibitor Nirmatrelvir synergizes with inhibitors of GRP78 to suppress SARS-CoV-2 replication, bioRxiv, doi:10.1101/2025.03.09.642200.
Abd Elsalam et al., Anti-COVID-19 activity and simple HPLC method for concurrent detection of repurposed drugs in novel binary mixtures, AMB Express, doi:10.1186/s13568-026-02030-8.
Rana et al., Ivermectin and Doxycycline combination as a promising anti-viral drug candidate: an in-silico and DFT study, In Silico Pharmacology, doi:10.1007/s40203-026-00576-w.
Setz et al., Synergistic Virus Neutralizing Activities of European Black Elderberry Fruit Extract and Iota-Carrageenan Against SARS-CoV-2, Influenza A Virus and Respiratory Syncytial Virus, Nutrients, doi:10.3390/nu18081205.
Ali et al., Preclinical Screening Platform Identifies Azatadine‐Dimaleate as a Potent Repurposed Therapeutic Against SARS‐CoV‐2 Infection, Journal of Medical Virology, doi:10.1002/jmv.70713.
Thairu et al., A Comparison of Ivermectin and Non Ivermectin Based Regimen for COVID-19 in Abuja: Effects on Virus Clearance, Days-to-discharge and Mortality, Journal of Pharmaceutical Research International, doi:10.9734/jpri/2022/v34i44A36328.
Singh et al., The relationship between viral clearance rates and disease progression in early symptomatic COVID-19: a systematic review and meta-regression analysis, Journal of Antimicrobial Chemotherapy, doi:10.1093/jac/dkae045.
Rothstein, H., Publication Bias in Meta-Analysis: Prevention, Assessment and Adjustments, www.wiley.com/en-ae/Publication+Bias+in+Meta+Analysis:+Prevention,+Assessment+and+Adjustments-p-9780470870143.
Stanley et al., Meta-regression approximations to reduce publication selection bias, Research Synthesis Methods, doi:10.1002/jrsm.1095.
Rücker et al., Arcsine test for publication bias in meta-analyses with binary outcomes, Statistics in Medicine, doi:10.1002/sim.2971.
Peters, J., Comparison of Two Methods to Detect Publication Bias in Meta-analysis, JAMA, doi:10.1001/jama.295.6.676.
Moreno et al., Assessment of regression-based methods to adjust for publication bias through a comprehensive simulation study, BMC Medical Research Methodology, doi:10.1186/1471-2288-9-2.
Macaskill et al., A comparison of methods to detect publication bias in meta-analysis, Statistics in Medicine, doi:10.1002/sim.698.
Egger et al., Bias in meta-analysis detected by a simple, graphical test, BMJ, doi:10.1136/bmj.315.7109.629.
Harbord et al., A modified test for small-study effects in meta-analyses of controlled trials with binary endpoints, Statistics in Medicine, doi:10.1002/sim.2380.
Li (C) et al., Advances in the effectiveness and safety of azvudine treatment: a comprehensive review, Frontiers in Pharmacology, doi:10.3389/fphar.2025.1524072.
Chu et al., Analysis of Long COVID characteristics and risk factors in individuals infected with COVID-19: a follow-up study based on a cohort of 2,792 participants, Frontiers in Public Health, doi:10.3389/fpubh.2026.1760355.
Guo et al., Association of Azvudine with severe outcomes among hospitalized patients with COVID-19 during an omicron-dominance period in Wuhan, China: a single-center, retrospective, matched cohort study, BMC Infectious Diseases, doi:10.1186/s12879-025-11625-8.
Wu (B) et al., Azvudine for the Treatment of COVID‐19 in Pre‐Existing Cardiovascular Diseases: A Single‐Center, Real‐World Experience, Advanced Science, doi:10.1002/advs.202306050.
Jin et al., Effects of Azvudine on the Low-Risk Patients Infected with COVID-19 Omicron Variants: A Retrospective Case-Control Study, Journal of Clinical Pharmacology and Therapeutics, 5:1, www.medtextpublications.com/open-access/effects-of-azvudine-on-the-low-risk-patients-infected-with-covid-19-1584.pdf.
Wang (D) et al., Antiviral effectiveness and survival correlation of azvudine and nirmatrelvir/ritonavir in elderly severe patients with COVID-19: a retrospective real-world study, eClinicalMedicine, doi:10.1016/j.eclinm.2024.102468.
Yang (B) et al., Oral azvudine for mild‐to‐moderate COVID‐19 in high risk, nonhospitalized adults: Results of a real‐world study, Journal of Medical Virology, doi:10.1002/jmv.28947.
Han et al., Effectiveness and Optimal Timing of Azvudine in COVID-19 Patients: A Multi-center Retrospective Study in Beijing, China, Research Square, doi:10.21203/rs.3.rs-3145554/v1.
Chen (C) et al., Oral Azvudine (FNC) Tablets in Patients infected with SARS-CoV-2 Omicron Variant: A Retrospective Cohort Study, medRxiv, doi:10.1101/2023.01.05.23284180.
Han (B) et al., Real-world efficacy of oral azvudine in hospitalized patients with COVID-19: A multicenter retrospective cohort study, Journal of Infection and Public Health, doi:10.1016/j.jiph.2025.102987.
Wang (E) et al., Impact of early and delayed azvudine administration on COVID-19 mortality: a retrospective study, Scientific Reports, doi:10.1038/s41598-025-05381-7.
Zhang et al., Effectiveness and safety of azvudine in the treatment of COVID-19 patients: a retrospective cohort study using propensity score matching, Frontiers in Cellular and Infection Microbiology, doi:10.3389/fcimb.2025.1584261.
Yu et al., The effectiveness and safety of azvudine treatment in COVID‐19 patients with kidney disease based on a multicenter retrospective cohort study, VIEW, doi:10.1002/VIW.20240075.
He et al., Prognostic factors in hospitalized patients with COVID-19 pneumonia and effectiveness of prophylactic anticoagulant therapy: a single-center retrospective study, BMC Infectious Diseases, doi:10.1186/s12879-025-10666-3.
Zhou (B) et al., A multicenter, real-world cohort study: effectiveness and safety of Azvudine in hospitalized COVID-19 patients with pre-existing diabetes, Frontiers in Endocrinology, doi:10.3389/fendo.2025.1467303.
Sun et al., Antiviral effectiveness and safety of azvudine in hospitalized SARS‐CoV‐2 patients with pre‐existing chronic respiratory diseases: A multicenter, retrospective cohort study, VIEW, doi:10.1002/VIW.20240133.
Zhong et al., Azvudine efficacy in reducing mortality in COVID-19 patients, European Journal of Medical Research, doi:10.1186/s40001-024-02220-9.
Zhu et al., Real-world efficacy and safety of azvudine in hospitalized older patients with COVID-19 during the omicron wave in China: A retrospective cohort study, Acta Pharmaceutica Sinica B, doi:10.1016/j.apsb.2024.12.004.
Zhang (B) et al., Efficacy of azvudine plus dexamethasone in severe hospitalized patients with Omicron infection: a prospective multicenter study, Frontiers in Cellular and Infection Microbiology, doi:10.3389/fcimb.2024.1390098.
Ren et al., Real-world effectiveness and safety of Azvudine in hospitalized patients with SARS-CoV-2 infection: a multicenter, retrospective cohort study, Journal of Infection, doi:10.1016/j.jinf.2024.106355.
Xu (B) et al., Systematic evaluation of therapeutic effectiveness of Azvudine in treating COVID-19 hospitalized patients: a retrospective cohort study, Frontiers in Cellular and Infection Microbiology, doi:10.3389/fcimb.2024.1453234.
Zhang (C) et al., Efficacy of Azvudine Therapy in Patients with Severe and Non-Severe COVID‐19: A Propensity Score-Matched Analysis, Infection and Drug Resistance, doi:10.2147/IDR.S481591.
Lv (B) et al., Clinical characteristics and outcomes of hospitalized kidney transplant recipients with COVID-19 infection in China during the Omicron wave: a single-center cohort study, Journal of Zhejiang University - SCIENCE B (Biomedicine & Biotechnology, doi:10.1631/jzus.B2300538.
Liu et al., Effectiveness of Azvudine and Nirmatrelvir-ritonavir in Kidney Transplant Recipients With COVID-19: A Retrospective Cohort Study, Infections in the immunosuppressed and immunocompromised host, doi:10.1164/ajrccm-conference.2024.209.1_MeetingAbstracts.A2917.
Zhong (B) et al., Azvudine reduces the mortality rate of patients with Coronavirus disease 2019: a single-center retrospective analysis study, Research Square, doi:10.21203/rs.3.rs-4157424/v1.
Li (D) et al., A Retrospective Analysis of Azvudine in Patients with COVID-19 and Pre-existing Cancer, Journal of Cancer, doi:10.7150/jca.91530.
Li (E) et al., Risk of severe case in COVID-19 patients and Azvudine: A Retrospective cohort study after exit from ‘zero-COVID’ policy, Research Square, doi:10.21203/rs.3.rs-3707560/v1.
Liu (B) et al., Clinical characteristics, outcomes, and risk factors of SARS-CoV-2 breakthrough infections among 572 fully vaccinated (BBIBP-CorV) hospitalized patients, Heliyon, doi:10.1016/j.heliyon.2023.e21387.
de Souza et al., Phase III, randomized, double-blind, placebo-controlled clinical study: a study on the safety and clinical efficacy of AZVUDINE in moderate COVID-19 patients, Frontiers in Medicine, doi:10.3389/fmed.2023.1215916.
Wei et al., Head-to-head comparison of azvudine and nirmatrelvir/ritonavir for the hospitalized patients with COVID-19: a real-world retrospective cohort study with propensity score matching, Frontiers in Pharmacology, doi:10.3389/fphar.2023.1274294.
Dian et al., Azvudine versus Paxlovid for oral treatment of COVID-19 in Chinese patients with pre-existing comorbidities, Journal of Infection, doi:10.1016/j.jinf.2023.05.012.
Shao et al., Composite Interventions on Outcomes of Severely and Critically Ill Patients with COVID-19 in Shanghai, China, Microorganisms, doi:10.3390/microorganisms11071859.
Zong et al., Azvudine reduces the in-hospital mortality of COVID-19 patients: A retrospective cohort study, Acta Pharmaceutica Sinica B, doi:10.1016/j.apsb.2023.07.007.
Sun (B) et al., Oral Azvudine for hospitalised patients with COVID-19 and pre-existing conditions: a retrospective cohort study, eClinicalMedicine, doi:10.1016/j.eclinm.2023.101981.
Chen (D) et al., All-cause mortality in moderate and severe COVID-19 patients with myocardial injury receiving versus not receiving azvudine: a propensity score-matched analysis, Cardiology Plus, doi:10.1097/CP9.0000000000000049.
Shen et al., Real-world effectiveness of Azvudine in hospitalized patients with COVID-19: a retrospective cohort study, medRxiv, doi:10.1101/2023.01.23.23284899.
Ren (B) et al., A Randomized, Open‐Label, Controlled Clinical Trial of Azvudine Tablets in the Treatment of Mild and Common COVID‐19, a Pilot Study, Advanced Science, doi:10.1002/advs.202001435.
Yu (B) et al., The first Chinese oral anti-COVID-19 drug Azvudine launched, The Innovation, doi:10.1016/j.xinn.2022.100321.
da Silva et al., Serial viral load analysis by DDPCR to evaluate FNC efficacy and safety in the treatment of mild cases of COVID-19, Frontiers in Medicine, doi:10.3389/fmed.2023.1143485.
Zhu (B), K., Efficacy and safety evaluation of Azvudine in the prospective treatment of COVID-19 based on four phase III clinical trials, Frontiers in Pharmacology, doi:10.3389/fphar.2023.1228548.
Porta et al., Targeting SARS-CoV-2 Non-Structural Proteins: A Blueprint for Next-Generation Small-Molecule Coronavirus Antivirals, Pharmaceutics, doi:10.3390/pharmaceutics18060693.
Bolinger et al., Lessons learnt from broad-spectrum coronavirus antiviral drug discovery, Expert Opinion on Drug Discovery, doi:10.1080/17460441.2024.2385598.
Alici, H., Structure-Based Design and In-Silico Evaluation of Computationally Proposed Curcumin Derivatives as Potential Inhibitors of the Coronaviral PLpro Enzymes, Pharmaceuticals, doi:10.3390/ph18060798.
Zeng et al., Novel receptor, mutation, vaccine, and establishment of coping mode for SARS-CoV-2: current status and future, Frontiers in Microbiology, doi:10.3389/fmicb.2023.1232453.
Zhang (D) et al., Oridonin inhibits SARS-CoV-2 replication by targeting viral proteinase and polymerase, Virologica Sinica, doi:10.1016/j.virs.2023.04.008.
Zhao et al., Identification of RdRp-NiRAN/JAK1 Dual-Target Drugs for COVID-19 Treatment, The Journal of Physical Chemistry B, doi:10.1021/acs.jpcb.4c06123.
Barghash et al., Navigating the COVID-19 Therapeutic Landscape: Unveiling Novel Perspectives on FDA-Approved Medications, Vaccination Targets, and Emerging Novel Strategies, Molecules, doi:10.3390/molecules29235564.
Huang et al., Advancements in the Development of Anti-SARS-CoV-2 Therapeutics, International Journal of Molecular Sciences, doi:10.3390/ijms251910820.
Barghash (B) et al., Navigating the COVID-19 Therapeutic Landscape: Unveiling Novel Perspectives on FDA-Approved Medications, Vaccination Targets, and Emerging Novel Strategies, MDPI AG, doi:10.20944/preprints202409.2409.v1.
Chhetri et al., Identification of lead inhibitors for 3CLpro of SARS-CoV-2 target using machine learning based virtual screening, ADMET analysis, molecular docking and molecular dynamics simulations, RSC Advances, doi:10.1039/d4ra04502e.
Liang et al., Repurposing existing drugs for the treatment ofCOVID-19/SARS-CoV-2: A review of pharmacological effects and mechanism of action, Heliyon, doi:10.1016/j.heliyon.2024.e35988.
Sharma et al., Reviewing the insights of SARS-CoV-2: Its Epidemiology, Pathophysiology, and Potential Preventive Measures in Traditional Medicinal System, Clinical Traditional Medicine and Pharmacology, doi:10.1016/j.ctmp.2024.200147.
Choi et al., Review of COVID-19 Therapeutics by Mechanism: From Discovery to Approval, Journal of Korean Medical Science, doi:10.3346/jkms.2024.39.e134.
Cao et al., Small-molecule anti-COVID-19 drugs and a focus on China’s homegrown mindeudesivir (VV116), Frontiers of Medicine, doi:10.1007/s11684-023-1037-3.
Fragkou et al., Review of trials currently testing treatment and prevention of COVID-19, Clinical Microbiology and Infection, doi:10.1016/j.cmi.2020.05.019.
Moura et al., Converging Paths: A Comprehensive Review of the Synergistic Approach between Complementary Medicines and Western Medicine in Addressing COVID-19 in 2020, BioMed, doi:10.3390/biomed3020025.
Guo (B) et al., Multi-omics in COVID-19: Driving development of therapeutics and vaccines, National Science Review, doi:10.1093/nsr/nwad161.
Oliver et al., Different drug approaches to COVID-19 treatment worldwide: an update of new drugs and drugs repositioning to fight against the novel coronavirus, Therapeutic Advances in Vaccines and Immunotherapy, doi:10.1177/25151355221144845.
Yang (C) et al., Bench-to-bedside: Innovation of small molecule anti-SARS-CoV-2 drugs in China, European Journal of Medicinal Chemistry, doi:10.1016/j.ejmech.2023.115503.
Xue et al., Repurposing clinically available drugs and therapies for pathogenic targets to combat SARS‐CoV‐2, MedComm, doi:10.1002/mco2.254.
Săndulescu et al., Therapeutic developments for SARS-CoV-2 infection—Molecular mechanisms of action of antivirals and strategies for mitigating resistance in emerging variants in clinical practice, Frontiers in Microbiology, doi:10.3389/fmicb.2023.1132501.
Zhong (C) et al., Recent advances in small-molecular therapeutics for COVID-19, Precision Clinical Medicine, doi:10.1093/pcmedi/pbac024.
Sarkar et al., Potential Therapeutic Options for COVID-19: Current Status, Challenges, and Future Perspectives, Frontiers in Pharmacology, doi:10.3389/fphar.2020.572870.
Frediansyah et al., Antivirals for COVID-19: A critical review, Clinical Epidemiology and Global Health, doi:10.1016/j.cegh.2020.07.006.
Mateja et al., The choice of viral load endpoint in early phase trials of COVID-19 treatments aiming to reduce 28-day hospitalization and/or death, The Journal of Infectious Diseases, doi:10.1093/infdis/jiaf282.
Zhang (E) et al., What's the relative risk? A method of correcting the odds ratio in cohort studies of common outcomes, JAMA, 80:19, 1690, doi:10.1001/jama.280.19.1690.
Altman (B) et al., How to obtain the confidence interval from a P value, BMJ, doi:10.1136/bmj.d2090.
Sweeting et al., What to add to nothing? Use and avoidance of continuity corrections in meta-analysis of sparse data, Statistics in Medicine, doi:10.1002/sim.1761.
Altman (C) et al., Interaction revisited: the difference between two estimates, BMJ, doi:10.1136/bmj.326.7382.219.
Michelucci et al., SARS-CoV-2 ORF3a accessory protein is a water-permeable channel that induces lysosome swelling, Communications Biology, doi:10.1038/s42003-024-07442-5.
Ghosh et al., β-Coronaviruses Use Lysosomes for Egress Instead of the Biosynthetic Secretory Pathway, Cell, doi:10.1016/j.cell.2020.10.039.
Kamga Kapchoup et al., In vitro effect of hydroxychloroquine on pluripotent stem cells and their cardiomyocytes derivatives, Frontiers in Pharmacology, doi:10.3389/fphar.2023.1128382.
Bobrowski et al., Synergistic and Antagonistic Drug Combinations against SARS-CoV-2, Molecular Therapy, doi:10.1016/j.ymthe.2020.12.016.
Peters (B) et al., Outcomes of Persons With COVID-19 in Hospitals With and Without Standard Treatment With (Hydroxy)chloroquine, Clinical Microbiology and Infection, doi:10.1016/j.cmi.2020.10.004.
Mahévas et al., Clinical efficacy of hydroxychloroquine in patients with covid-19 pneumonia who require oxygen: observational comparative study using routine care data, BMJ 2020, doi:10.1136/bmj.m1844.
Minozzi et al., The revised Cochrane risk of bias tool for randomized trials (RoB 2) showed low interrater reliability and challenges in its application, Journal of Clinical Epidemiology, doi:10.1016/j.jclinepi.2020.06.015.
Popp et al., Ivermectin for preventing and treating COVID-19, Cochrane Database of Systematic Reviews, doi:10.1002/14651858.CD015017.pub3.
Reis et al., Effect of Early Treatment with Ivermectin among Patients with Covid-19, New England Journal of Medicine, doi:10.1056/NEJMoa2115869.
Axfors et al., Mortality outcomes with hydroxychloroquine and chloroquine in COVID-19 from an international collaborative meta-analysis of randomized trials, Nature, doi:10.1038/s41467-021-22446-z.