October 2026
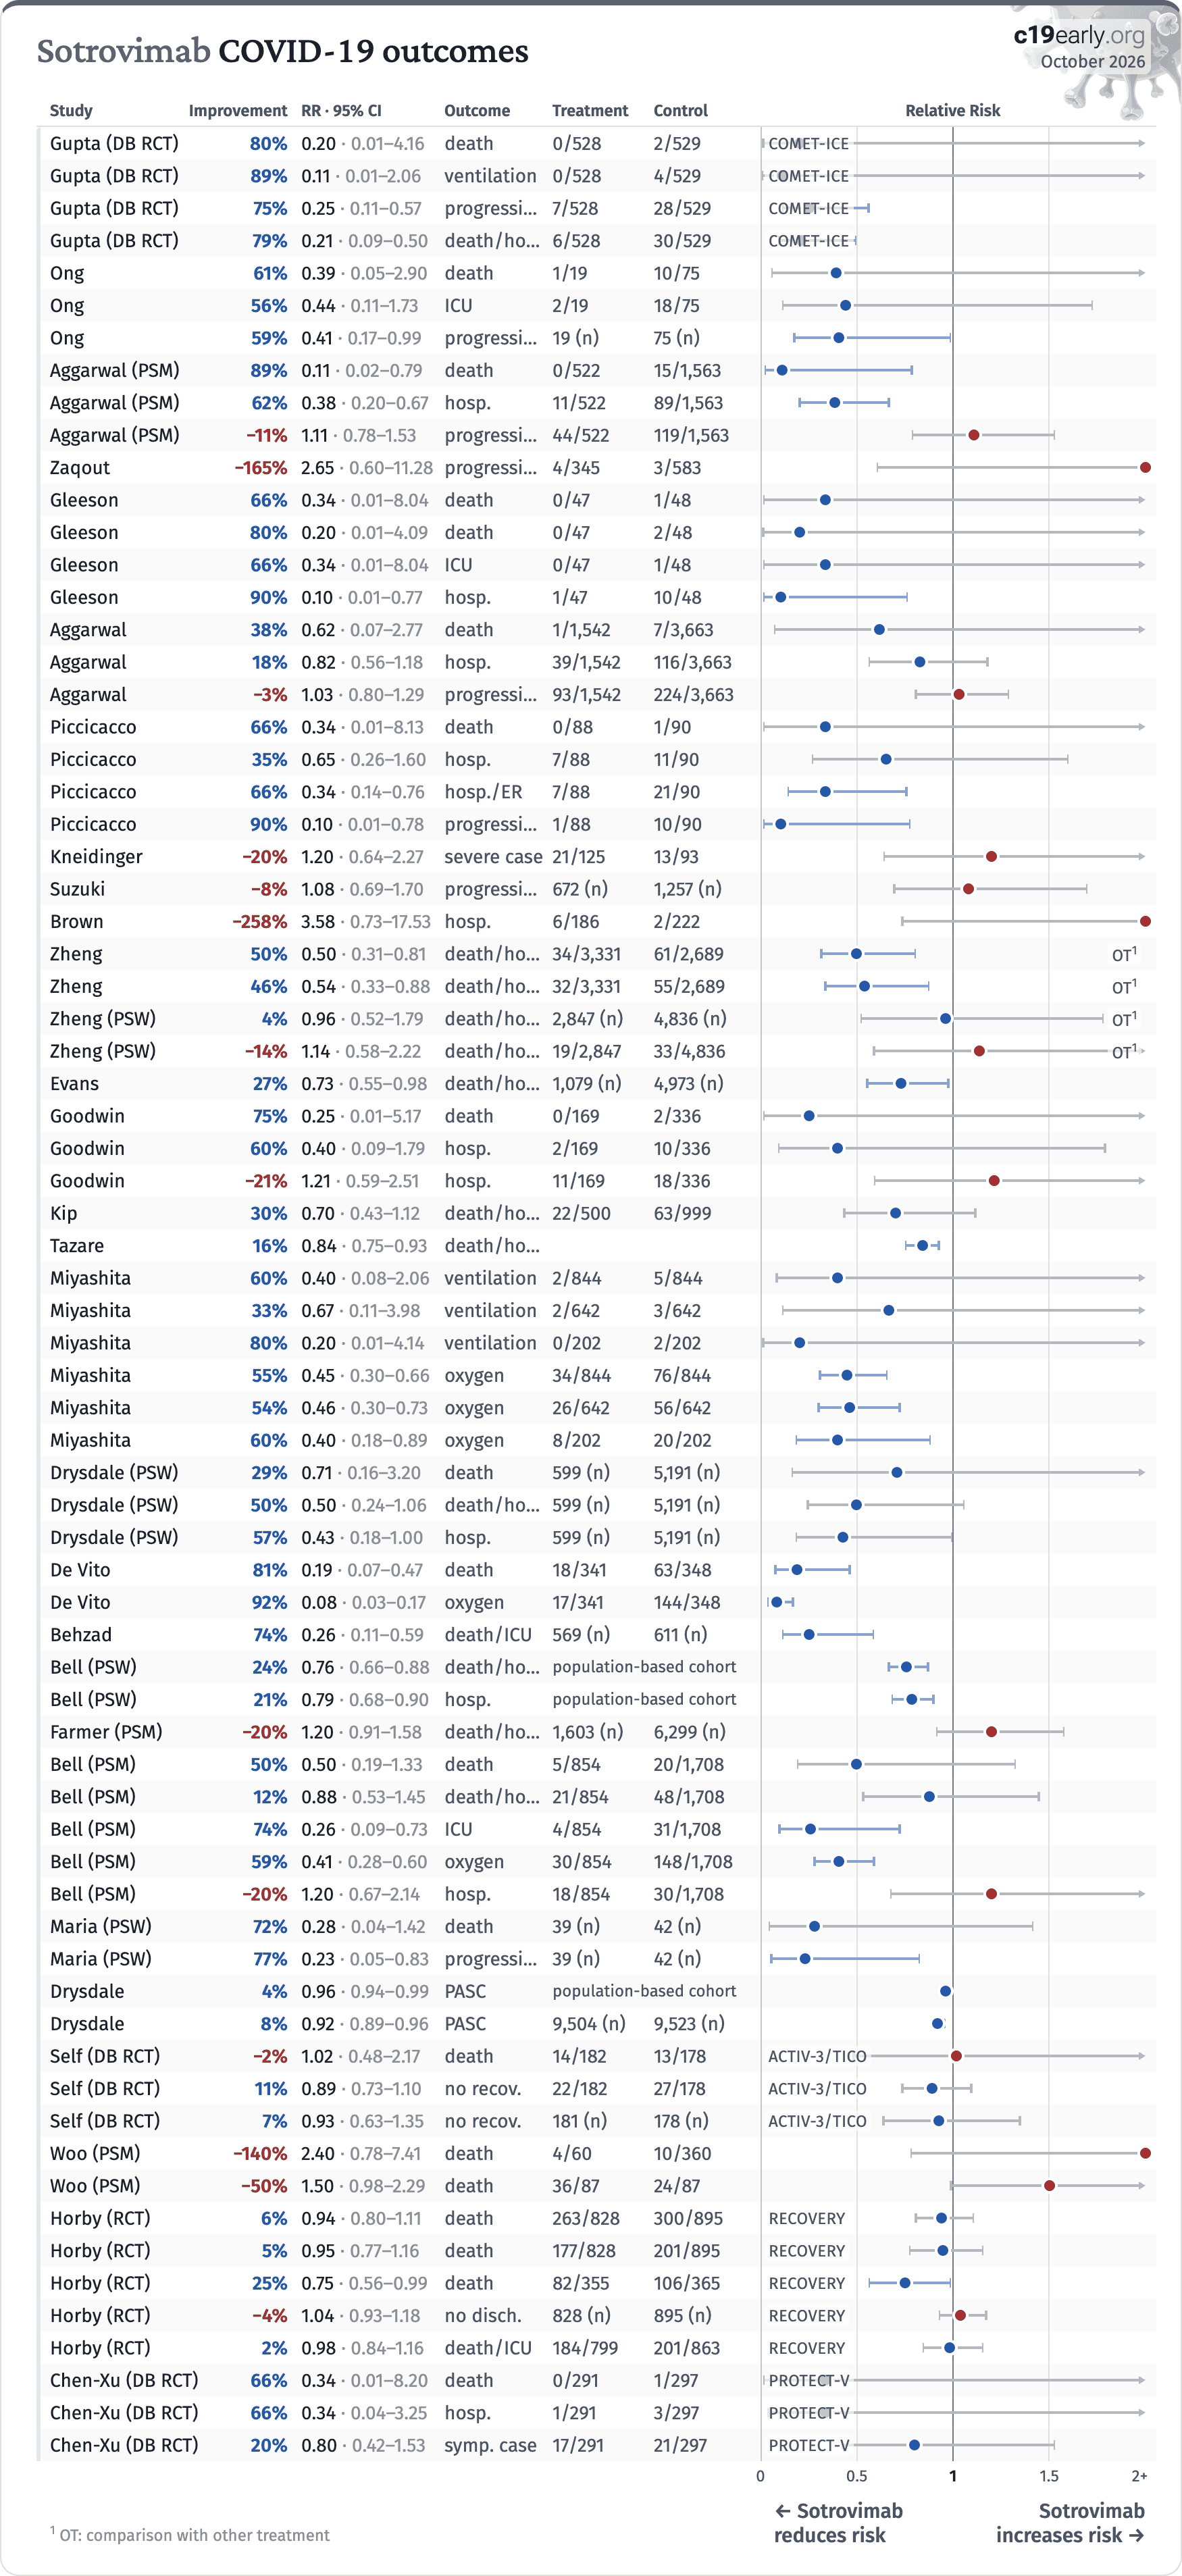
Sotrovimab COVID-19 outcomes
StudyImprovementRR · 95% CIOutcomeTreatmentControlRelative Risk
Gupta (DB RCT)80%0.20 · 0.01–4.16death0/5282/529COMET-ICE
Gupta (DB RCT)89%0.11 · 0.01–2.06ventilation0/5284/529COMET-ICE
Gupta (DB RCT)75%0.25 · 0.11–0.57progression7/52828/529COMET-ICE
Gupta (DB RCT)79%0.21 · 0.09–0.50death/hosp.6/52830/529COMET-ICE
Ong61%0.39 · 0.05–2.90death1/1910/75
Ong56%0.44 · 0.11–1.73ICU2/1918/75
Ong59%0.41 · 0.17–0.99progression19 (n)75 (n)
Aggarwal (PSM)89%0.11 · 0.02–0.79death0/52215/1,563
Aggarwal (PSM)62%0.38 · 0.20–0.67hosp.11/52289/1,563
Aggarwal (PSM)−11%1.11 · 0.78–1.53progression44/522119/1,563
Zaqout−165%2.65 · 0.60–11.28progression4/3453/583
Gleeson66%0.34 · 0.01–8.04death0/471/48
Gleeson80%0.20 · 0.01–4.09death0/472/48
Gleeson66%0.34 · 0.01–8.04ICU0/471/48
Gleeson90%0.10 · 0.01–0.77hosp.1/4710/48
Aggarwal38%0.62 · 0.07–2.77death1/1,5427/3,663
Aggarwal18%0.82 · 0.56–1.18hosp.39/1,542116/3,663
Aggarwal−3%1.03 · 0.80–1.29progression93/1,542224/3,663
Piccicacco66%0.34 · 0.01–8.13death0/881/90
Piccicacco35%0.65 · 0.26–1.60hosp.7/8811/90
Piccicacco66%0.34 · 0.14–0.76hosp./ER7/8821/90
Piccicacco90%0.10 · 0.01–0.78progression1/8810/90
Kneidinger−20%1.20 · 0.64–2.27severe case21/12513/93
Suzuki−8%1.08 · 0.69–1.70progression672 (n)1,257 (n)
Brown−258%3.58 · 0.73–17.53hosp.6/1862/222
Zheng50%0.50 · 0.31–0.81death/hosp.34/3,33161/2,689OT1
Zheng46%0.54 · 0.33–0.88death/hosp.32/3,33155/2,689OT1
Zheng (PSW)4%0.96 · 0.52–1.79death/hosp.2,847 (n)4,836 (n)OT1
Zheng (PSW)−14%1.14 · 0.58–2.22death/hosp.19/2,84733/4,836OT1
Evans27%0.73 · 0.55–0.98death/hosp.1,079 (n)4,973 (n)
Goodwin75%0.25 · 0.01–5.17death0/1692/336
Goodwin60%0.40 · 0.09–1.79hosp.2/16910/336
Goodwin−21%1.21 · 0.59–2.51hosp.11/16918/336
Kip30%0.70 · 0.43–1.12death/hosp.22/50063/999
Tazare16%0.84 · 0.75–0.93death/hosp.
Miyashita60%0.40 · 0.08–2.06ventilation2/8445/844
Miyashita33%0.67 · 0.11–3.98ventilation2/6423/642
Miyashita80%0.20 · 0.01–4.14ventilation0/2022/202
Miyashita55%0.45 · 0.30–0.66oxygen34/84476/844
Miyashita54%0.46 · 0.30–0.73oxygen26/64256/642
Miyashita60%0.40 · 0.18–0.89oxygen8/20220/202
Drysdale (PSW)29%0.71 · 0.16–3.20death599 (n)5,191 (n)
Drysdale (PSW)50%0.50 · 0.24–1.06death/hosp.599 (n)5,191 (n)
Drysdale (PSW)57%0.43 · 0.18–1.00hosp.599 (n)5,191 (n)
De Vito81%0.19 · 0.07–0.47death18/34163/348
De Vito92%0.08 · 0.03–0.17oxygen17/341144/348
Behzad74%0.26 · 0.11–0.59death/ICU569 (n)611 (n)
Bell (PSW)24%0.76 · 0.66–0.88death/hosp.population-based cohort
Bell (PSW)21%0.79 · 0.68–0.90hosp.population-based cohort
Farmer (PSM)−20%1.20 · 0.91–1.58death/hosp.1,603 (n)6,299 (n)
Bell (PSM)50%0.50 · 0.19–1.33death5/85420/1,708
Bell (PSM)12%0.88 · 0.53–1.45death/hosp.21/85448/1,708
Bell (PSM)74%0.26 · 0.09–0.73ICU4/85431/1,708
Bell (PSM)59%0.41 · 0.28–0.60oxygen30/854148/1,708
Bell (PSM)−20%1.20 · 0.67–2.14hosp.18/85430/1,708
Maria (PSW)72%0.28 · 0.04–1.42death39 (n)42 (n)
Maria (PSW)77%0.23 · 0.05–0.83progression39 (n)42 (n)
Drysdale4%0.96 · 0.94–0.99PASCpopulation-based cohort
Drysdale8%0.92 · 0.89–0.96PASC9,504 (n)9,523 (n)
Self (DB RCT)−2%1.02 · 0.48–2.17death14/18213/178ACTIV-3/TICO
Self (DB RCT)11%0.89 · 0.73–1.10no recov.22/18227/178ACTIV-3/TICO
Self (DB RCT)7%0.93 · 0.63–1.35no recov.181 (n)178 (n)ACTIV-3/TICO
Woo (PSM)−140%2.40 · 0.78–7.41death4/6010/360
Woo (PSM)−50%1.50 · 0.98–2.29death36/8724/87
Horby (RCT)6%0.94 · 0.80–1.11death263/828300/895RECOVERY
Horby (RCT)5%0.95 · 0.77–1.16death177/828201/895RECOVERY
Horby (RCT)25%0.75 · 0.56–0.99death82/355106/365RECOVERY
Horby (RCT)−4%1.04 · 0.93–1.18no disch.828 (n)895 (n)RECOVERY
Horby (RCT)2%0.98 · 0.84–1.16death/ICU184/799201/863RECOVERY
Chen-Xu (DB RCT)66%0.34 · 0.01–8.20death0/2911/297PROTECT-V
Chen-Xu (DB RCT)66%0.34 · 0.04–3.25hosp.1/2913/297PROTECT-V
Chen-Xu (DB RCT)20%0.80 · 0.42–1.53symp. case17/29121/297PROTECT-V
00.511.52+