October 2026
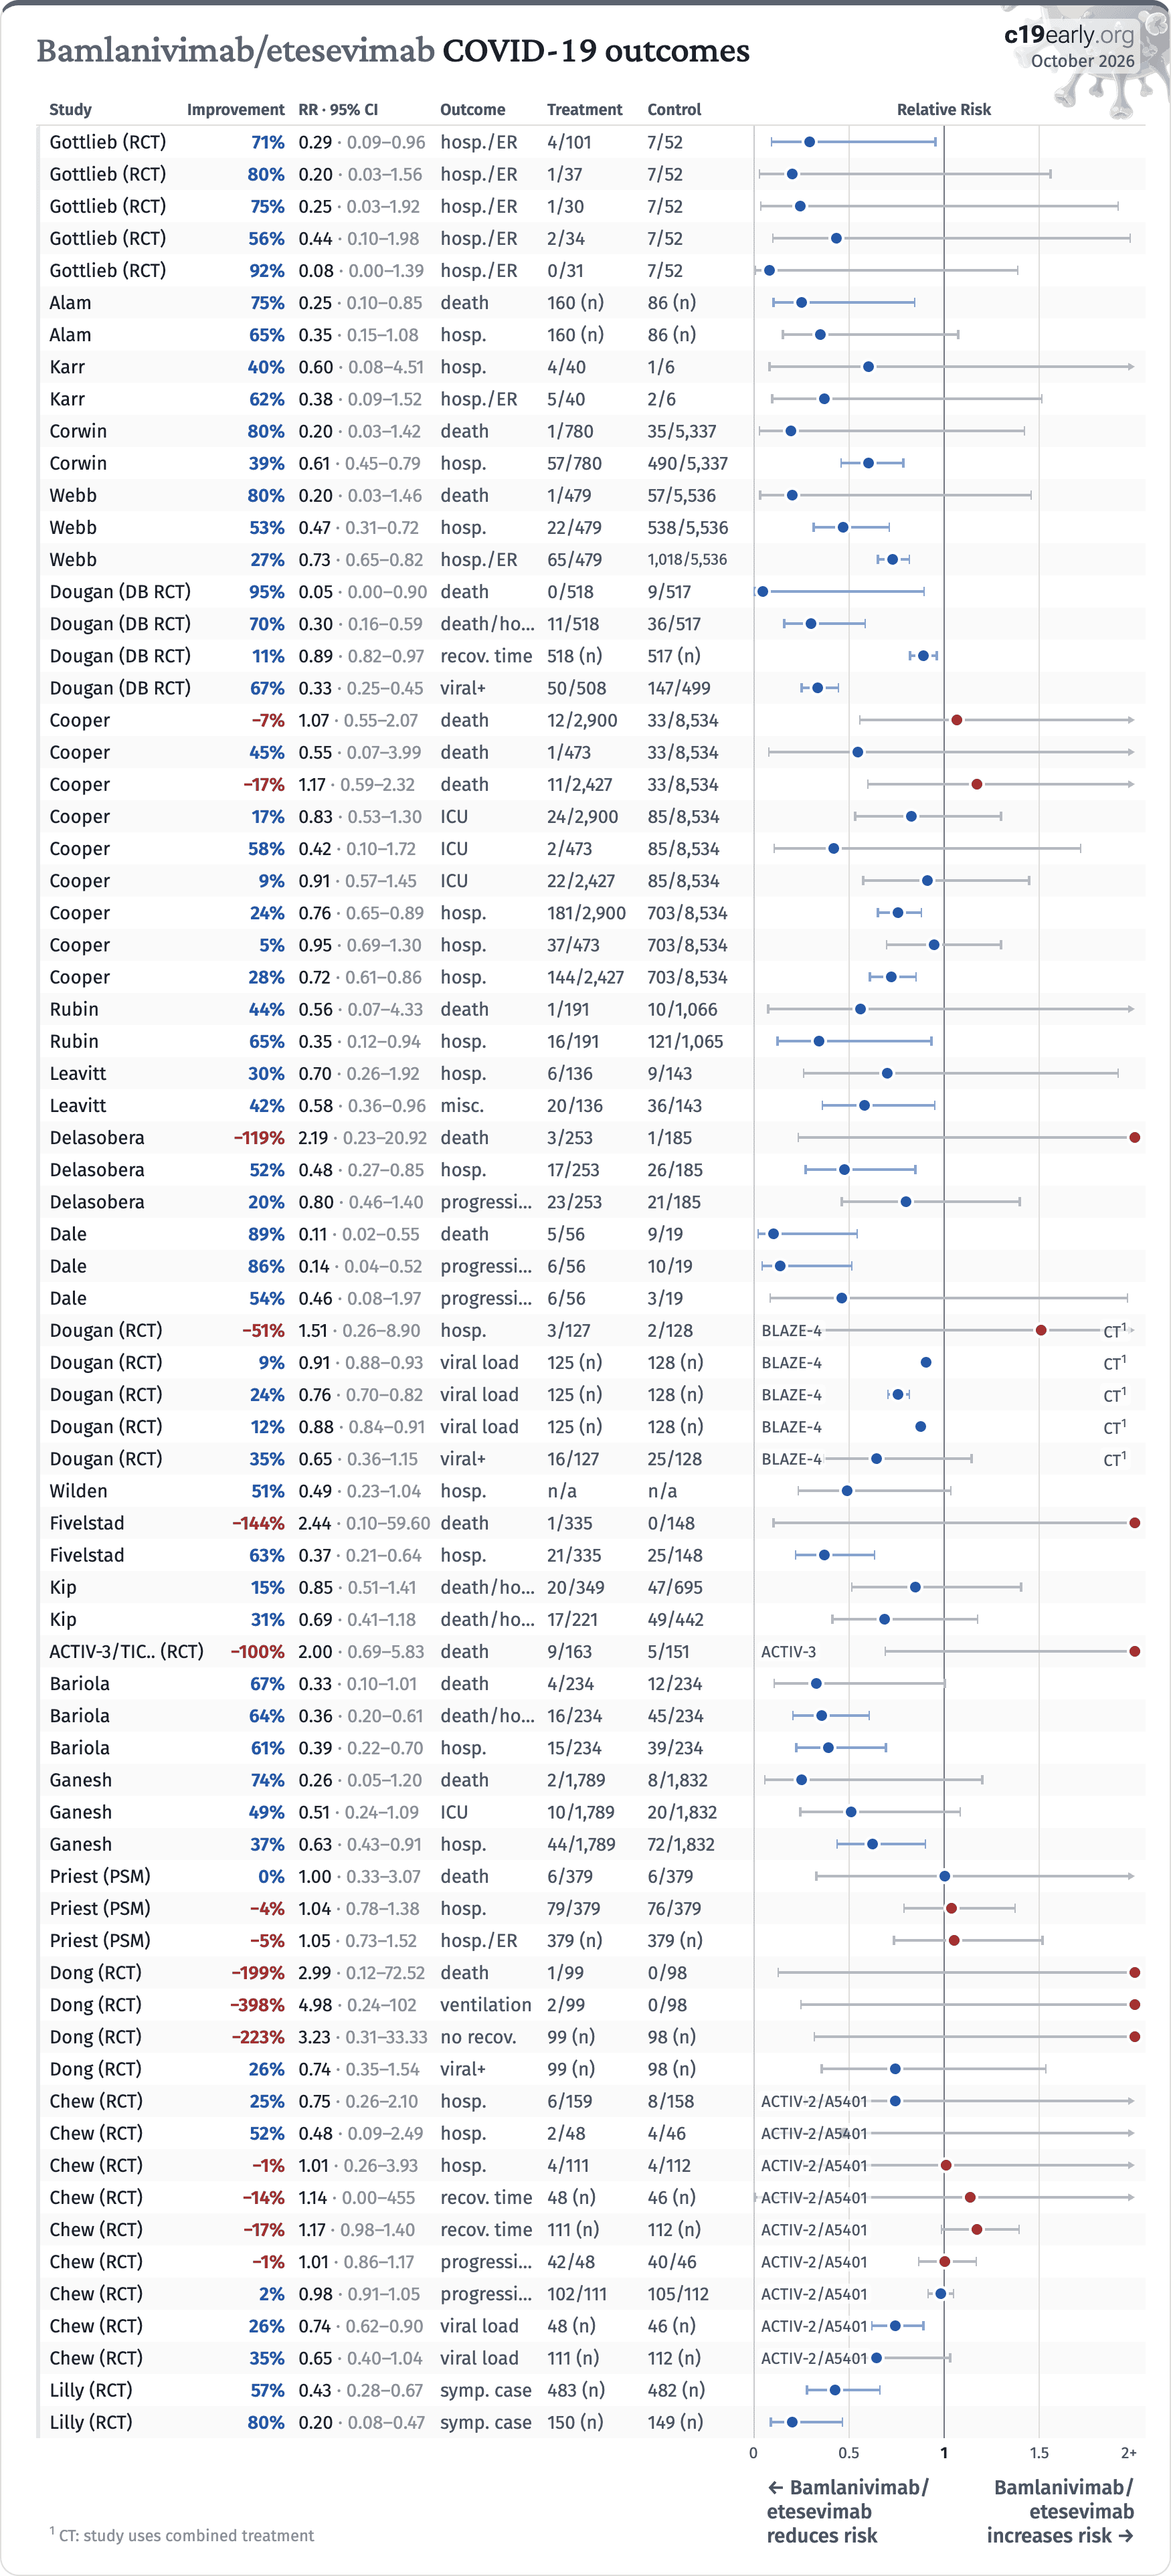
Bamlanivimab/etesevimab COVID-19 outcomes
StudyImprovementRR · 95% CIOutcomeTreatmentControlRelative Risk
Gottlieb (RCT)71%0.29 · 0.09–0.96hosp./ER4/1017/52
Gottlieb (RCT)80%0.20 · 0.03–1.56hosp./ER1/377/52
Gottlieb (RCT)75%0.25 · 0.03–1.92hosp./ER1/307/52
Gottlieb (RCT)56%0.44 · 0.10–1.98hosp./ER2/347/52
Gottlieb (RCT)92%0.08 · 0.00–1.39hosp./ER0/317/52
Alam75%0.25 · 0.10–0.85death160 (n)86 (n)
Alam65%0.35 · 0.15–1.08hosp.160 (n)86 (n)
Karr40%0.60 · 0.08–4.51hosp.4/401/6
Karr62%0.38 · 0.09–1.52hosp./ER5/402/6
Corwin80%0.20 · 0.03–1.42death1/78035/5,337
Corwin39%0.61 · 0.45–0.79hosp.57/780490/5,337
Webb80%0.20 · 0.03–1.46death1/47957/5,536
Webb53%0.47 · 0.31–0.72hosp.22/479538/5,536
Webb27%0.73 · 0.65–0.82hosp./ER65/4791,018/5,536
Dougan (DB RCT)95%0.05 · 0.00–0.90death0/5189/517
Dougan (DB RCT)70%0.30 · 0.16–0.59death/hosp.11/51836/517
Dougan (DB RCT)11%0.89 · 0.82–0.97recov. time518 (n)517 (n)
Dougan (DB RCT)67%0.33 · 0.25–0.45viral+50/508147/499
Cooper−7%1.07 · 0.55–2.07death12/2,90033/8,534
Cooper45%0.55 · 0.07–3.99death1/47333/8,534
Cooper−17%1.17 · 0.59–2.32death11/2,42733/8,534
Cooper17%0.83 · 0.53–1.30ICU24/2,90085/8,534
Cooper58%0.42 · 0.10–1.72ICU2/47385/8,534
Cooper9%0.91 · 0.57–1.45ICU22/2,42785/8,534
Cooper24%0.76 · 0.65–0.89hosp.181/2,900703/8,534
Cooper5%0.95 · 0.69–1.30hosp.37/473703/8,534
Cooper28%0.72 · 0.61–0.86hosp.144/2,427703/8,534
Rubin44%0.56 · 0.07–4.33death1/19110/1,066
Rubin65%0.35 · 0.12–0.94hosp.16/191121/1,065
Leavitt30%0.70 · 0.26–1.92hosp.6/1369/143
Leavitt42%0.58 · 0.36–0.96misc.20/13636/143
Delasobera−119%2.19 · 0.23–20.92death3/2531/185
Delasobera52%0.48 · 0.27–0.85hosp.17/25326/185
Delasobera20%0.80 · 0.46–1.40progression23/25321/185
Dale89%0.11 · 0.02–0.55death5/569/19
Dale86%0.14 · 0.04–0.52progression6/5610/19
Dale54%0.46 · 0.08–1.97progression6/563/19
Dougan (RCT)−51%1.51 · 0.26–8.90hosp.3/1272/128BLAZE-4CT1
Dougan (RCT)9%0.91 · 0.88–0.93viral load125 (n)128 (n)BLAZE-4CT1
Dougan (RCT)24%0.76 · 0.70–0.82viral load125 (n)128 (n)BLAZE-4CT1
Dougan (RCT)12%0.88 · 0.84–0.91viral load125 (n)128 (n)BLAZE-4CT1
Dougan (RCT)35%0.65 · 0.36–1.15viral+16/12725/128BLAZE-4CT1
Wilden51%0.49 · 0.23–1.04hosp.n/an/a
Fivelstad−144%2.44 · 0.10–59.60death1/3350/148
Fivelstad63%0.37 · 0.21–0.64hosp.21/33525/148
Kip15%0.85 · 0.51–1.41death/hosp.20/34947/695
Kip31%0.69 · 0.41–1.18death/hosp.17/22149/442
ACTIV-3/TIC.. (RCT)−100%2.00 · 0.69–5.83death9/1635/151ACTIV-3
Bariola67%0.33 · 0.10–1.01death4/23412/234
Bariola64%0.36 · 0.20–0.61death/hosp.16/23445/234
Bariola61%0.39 · 0.22–0.70hosp.15/23439/234
Ganesh74%0.26 · 0.05–1.20death2/1,7898/1,832
Ganesh49%0.51 · 0.24–1.09ICU10/1,78920/1,832
Ganesh37%0.63 · 0.43–0.91hosp.44/1,78972/1,832
Priest (PSM)0%1.00 · 0.33–3.07death6/3796/379
Priest (PSM)−4%1.04 · 0.78–1.38hosp.79/37976/379
Priest (PSM)−5%1.05 · 0.73–1.52hosp./ER379 (n)379 (n)
Dong (RCT)−199%2.99 · 0.12–72.52death1/990/98
Dong (RCT)−398%4.98 · 0.24–102ventilation2/990/98
Dong (RCT)−223%3.23 · 0.31–33.33no recov.99 (n)98 (n)
Dong (RCT)26%0.74 · 0.35–1.54viral+99 (n)98 (n)
Chew (RCT)25%0.75 · 0.26–2.10hosp.6/1598/158ACTIV-2/A5401
Chew (RCT)52%0.48 · 0.09–2.49hosp.2/484/46ACTIV-2/A5401
Chew (RCT)−1%1.01 · 0.26–3.93hosp.4/1114/112ACTIV-2/A5401
Chew (RCT)−14%1.14 · 0.00–455recov. time48 (n)46 (n)ACTIV-2/A5401
Chew (RCT)−17%1.17 · 0.98–1.40recov. time111 (n)112 (n)ACTIV-2/A5401
Chew (RCT)−1%1.01 · 0.86–1.17progression42/4840/46ACTIV-2/A5401
Chew (RCT)2%0.98 · 0.91–1.05progression102/111105/112ACTIV-2/A5401
Chew (RCT)26%0.74 · 0.62–0.90viral load48 (n)46 (n)ACTIV-2/A5401
Chew (RCT)35%0.65 · 0.40–1.04viral load111 (n)112 (n)ACTIV-2/A5401
Lilly (RCT)57%0.43 · 0.28–0.67symp. case483 (n)482 (n)
Lilly (RCT)80%0.20 · 0.08–0.47symp. case150 (n)149 (n)
00.511.52+