Interaction revisited: the difference between two estimates
et al., BMJ, doi:10.1136/bmj.326.7382.219, Jan 2003
Statistics note for comparing two independent estimates (such as treatment effects in different subgroups) using a test of interaction.
Altman et al., 25 Jan 2003, peer-reviewed, 2 authors.
Abstract: Education and debate
Statistics Notes
Interaction revisited: the difference between two estimates
We often want to compare two estimates of the same
quantity derived from separate analyses. Thus we might
want to compare the treatment effect in subgroups in a
randomised trial, such as two age groups. The term for
such a comparison is a test of interaction. In earlier Statistics Notes we discussed interaction in terms of heterogeneity of treatment effect.1–3 Here we revisit interaction
and consider the concept more generally.
The comparison of two estimated quantities, such as
means or proportions, each with its standard error, is a
general method that can be applied widely. The two estimates should be independent, not obtained from the
same individuals—examples are the results from
subgroups in a randomised trial or from two independent studies. The samples should be large. If the estimates
are E1 and E2 with standard errors SE(E1) and SE(E2),
then the difference d=E1 − E2 has standard error
SE(d)=√[SE(E1)2 + SE(E2)2] (that is, the square root of the
sum of the squares of the separate standard errors). This
formula is an example of a well known relation that the
variance of the difference between two estimates is the
sum of the separate variances (here the variance is the
square of the standard error). Then the ratio z=d/SE(d)
gives a test of the null hypothesis that in the population
the difference d is zero, by comparing the value of z to
the standard normal distribution. The 95% confidence
interval for the difference is d−1.96SE(d) to d+1.96SE(d).
We illustrated this for means and proportions,3
although we did not show how to get the standard
error of the difference. Here we consider comparing
relative risks or odds ratios. These measures are always
analysed on the log scale because the distributions of
the log ratios tend to be those closer to normal than of
the ratios themselves.
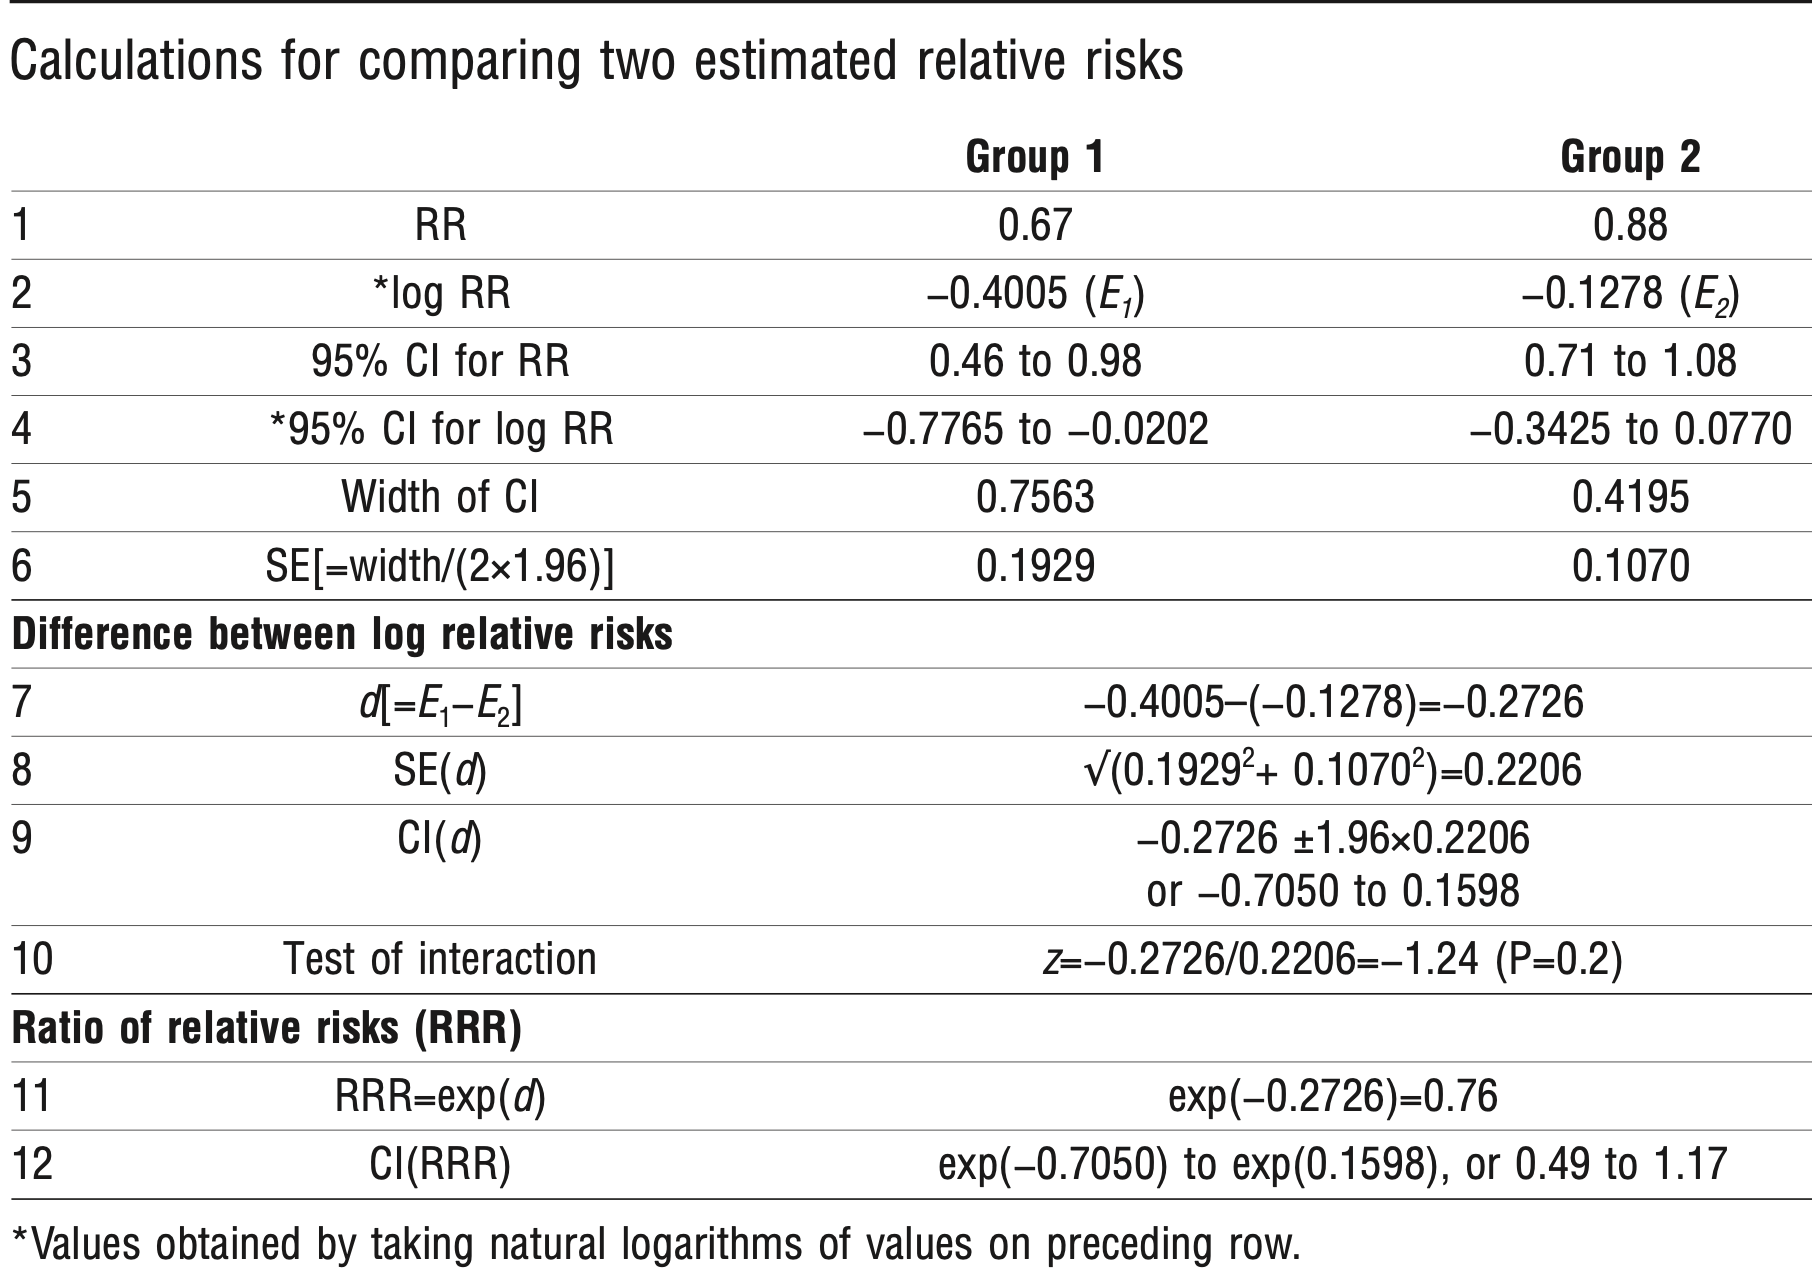
In a meta-analysis of non-vertebral fractures in randomised trials of hormone replacement therapy the
estimated relative risk from 22 trials was 0.73 (P=0.02) in
favour of hormone replacement therapy.4 From 14 trials
of women aged on average < 60 years the relative risk
was 0.67 (95% confidence interval 0.46 to 0.98; P=0.03).
From eight trials of women aged >60 the relative risk
was 0.88 (0.71 to 1.08; P=0.22). In other words, in
younger women the estimated treatment benefit was a
33% reduction in risk of fracture, which was statistically
significant, compared with a 12% reduction in older
women, which was not significant. But are the relative
risks from the subgroups significantly different from
each other? We show how to answer this question using
just the summary data quoted.
Because the calculations were made on the log scale,
comparing the two estimates is complex (see table). We
need to obtain the logs of the relative risks and their
confidence intervals (rows 2 and 4).5 As 95% confidence
intervals are obtained as 1.96 standard errors either side
of the estimate, the SE of each log relative risk is
obtained by dividing the width of its confidence interval
by 2×1.96 (row 6). The estimated difference in log
relative risks is d=E1− E2= − 0.2726 and its standard error
BMJ VOLUME 326
25 JANUARY 2003
bmj.com
0.2206 (row 8). From these two values we can test the
interaction and estimate the ratio of the relative risks
(with confidence interval). The test of interaction is the
ratio of d to its standard error: z= − 0.2726/
0.2206= − 1.24, which gives..
DOI record:
{
"DOI": "10.1136/bmj.326.7382.219",
"ISSN": [
"0959-8138",
"1468-5833"
],
"URL": "http://dx.doi.org/10.1136/bmj.326.7382.219",
"alternative-id": [
"10.1136/bmj.326.7382.219"
],
"author": [
{
"affiliation": [],
"family": "Altman",
"given": "Douglas G",
"sequence": "first"
},
{
"affiliation": [],
"family": "Bland",
"given": "J Martin",
"sequence": "additional"
}
],
"container-title": "BMJ",
"container-title-short": "BMJ",
"content-domain": {
"crossmark-restriction": false,
"domain": []
},
"created": {
"date-parts": [
[
2003,
1,
23
]
],
"date-time": "2003-01-23T18:25:48Z",
"timestamp": 1043346348000
},
"deposited": {
"date-parts": [
[
2025,
12,
22
]
],
"date-time": "2025-12-22T17:49:47Z",
"timestamp": 1766425787000
},
"indexed": {
"date-parts": [
[
2026,
1,
16
]
],
"date-time": "2026-01-16T05:12:05Z",
"timestamp": 1768540325969,
"version": "3.49.0"
},
"is-referenced-by-count": 2661,
"issue": "7382",
"issued": {
"date-parts": [
[
2003,
1,
25
]
]
},
"journal-issue": {
"issue": "7382",
"published-online": {
"date-parts": [
[
2003,
1,
25
]
]
},
"published-print": {
"date-parts": [
[
2003,
1,
25
]
]
}
},
"language": "en",
"license": [
{
"URL": "http://www.bmj.com/company/legal-information/terms-conditions/legal-information/tdm-licencepolicy",
"content-version": "tdm",
"delay-in-days": 0,
"start": {
"date-parts": [
[
2003,
1,
25
]
],
"date-time": "2003-01-25T00:00:00Z",
"timestamp": 1043452800000
}
}
],
"link": [
{
"URL": "http://data.bmj.org/tdm/10.1136/bmj.326.7382.219",
"content-type": "unspecified",
"content-version": "vor",
"intended-application": "text-mining"
},
{
"URL": "https://syndication.highwire.org/content/doi/10.1136/bmj.326.7382.219",
"content-type": "unspecified",
"content-version": "vor",
"intended-application": "similarity-checking"
}
],
"member": "239",
"original-title": [],
"page": "219",
"prefix": "10.1136",
"published": {
"date-parts": [
[
2003,
1,
25
]
]
},
"published-online": {
"date-parts": [
[
2003,
1,
25
]
]
},
"published-print": {
"date-parts": [
[
2003,
1,
25
]
]
},
"publisher": "BMJ",
"reference": [
{
"DOI": "10.1136/bmj.313.7055.486",
"article-title": "Interaction 1: Heterogeneity of effects.",
"author": "Altman",
"doi-asserted-by": "crossref",
"first-page": "486",
"journal-title": "BMJ",
"key": "2025122209493845000_326.7382.219.1",
"volume": "313",
"year": "1996"
},
{
"DOI": "10.1136/bmj.313.7060.808",
"doi-asserted-by": "publisher",
"key": "2025122209493845000_326.7382.219.2"
},
{
"DOI": "10.1136/bmj.313.7061.862",
"doi-asserted-by": "publisher",
"key": "2025122209493845000_326.7382.219.3"
},
{
"DOI": "10.1001/jama.285.22.2891",
"doi-asserted-by": "publisher",
"key": "2025122209493845000_326.7382.219.4"
},
{
"DOI": "10.1136/bmj.312.7032.700",
"article-title": "Logarithms.",
"author": "Bland",
"doi-asserted-by": "crossref",
"first-page": "700",
"journal-title": "BMJ",
"key": "2025122209493845000_326.7382.219.5",
"volume": "312",
"year": "1996"
},
{
"key": "2025122209493845000_326.7382.219.6",
"unstructured": "Bland M Peacock J . Interpreting statistics with confidence. Obstetrician and Gynaecologist (in press)."
}
],
"reference-count": 6,
"references-count": 6,
"relation": {},
"resource": {
"primary": {
"URL": "https://www.bmj.com/lookup/doi/10.1136/bmj.326.7382.219"
}
},
"score": 1,
"short-title": [],
"source": "Crossref",
"subject": [],
"subtitle": [],
"title": "Interaction revisited: the difference between two estimates",
"type": "journal-article",
"volume": "326"
}